Special notes of this burst
Image
Pre-slew 15.0-350.0 keV image (Event data)

#   RAcent    DECcent   POSerr    Theta     Phi              Peak Cts       SNR   Name
  328.7615    29.1706   0.0219    27.7743   -35.1405         0.7010708      8.792 TRIG_00421962

Foreground time interval of the image:
  0.304  30.284 (delta_t =  29.980 [sec])
Background time interval of the image:
-44.667   0.304 (delta_t =  44.971 [sec])
Lightcurves
Notes:
- 1) The mask-weighted light curves are using the flight position.
- 2) Multiple plots of different time binning/intervals are shown to cover all scenarios of short/long GRBs, rate/image triggers, and real/false positives.
- 3) For all the mask-weighted lightcurves, the y-axis units are counts/sec/det where a det is 0.4 x 0.4 = 0.16 sq cm.
- 4) The verticle lines correspond to following: green dotted lines are T50 interval, black dotted lines are T90 interval, blue solid line(s) is a spacecraft slew start time, and orange solid line(s) is a spacecraft slew end time.
- 5) Time of each bin is in the middle of the bin.
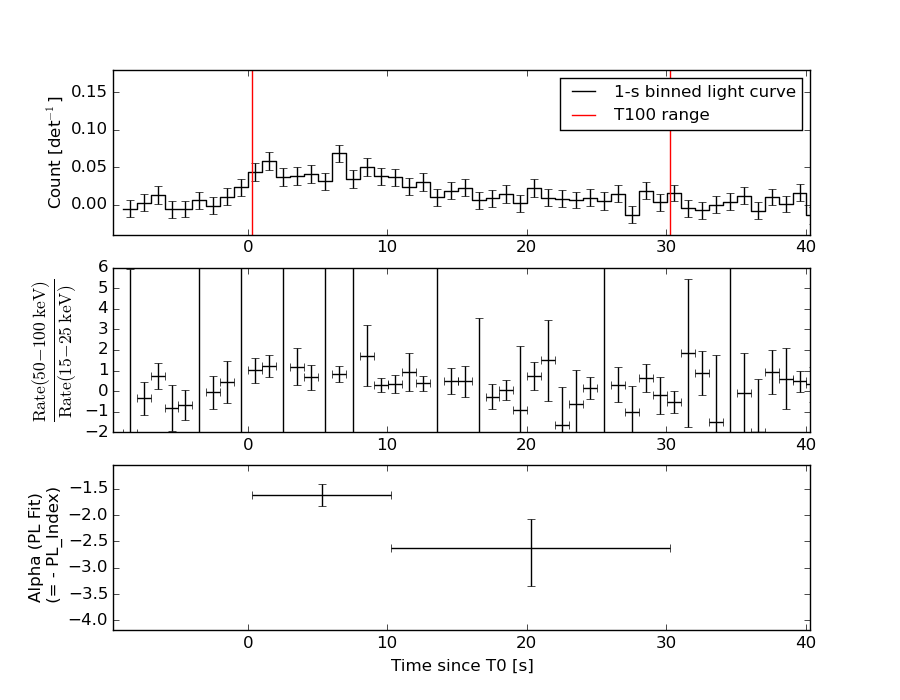
1 s binning
From T0-310 s to T0+310 s

From T100_start - 20 s to T100_end + 30 s

Full time interval

64 ms binning
Full time interval

From T100_start to T100_end

From T0-5 sec to T0+5 sec

16 ms binning
From T100_start-5 s to T100_start+5 s

Blue+Cyan dotted lines: Time interval of the scaled map
From 0.000000 to 3.072000
8 ms binning
From T100_start-3 s to T100_start+3 s

Blue+Cyan dotted lines: Time interval of the scaled map
From 0.000000 to 3.072000
2 ms binning
From T100_start-1 s to T100_start+1 s

Blue+Cyan dotted lines: Time interval of the scaled map
From 0.000000 to 3.072000
SN=5 or 10 sec. binning (whichever binning is satisfied first)

SN=5 or 10 sec. binning (T < 200 sec)
Quad-rate summed light curves (from T0-300s to T0+1000s)
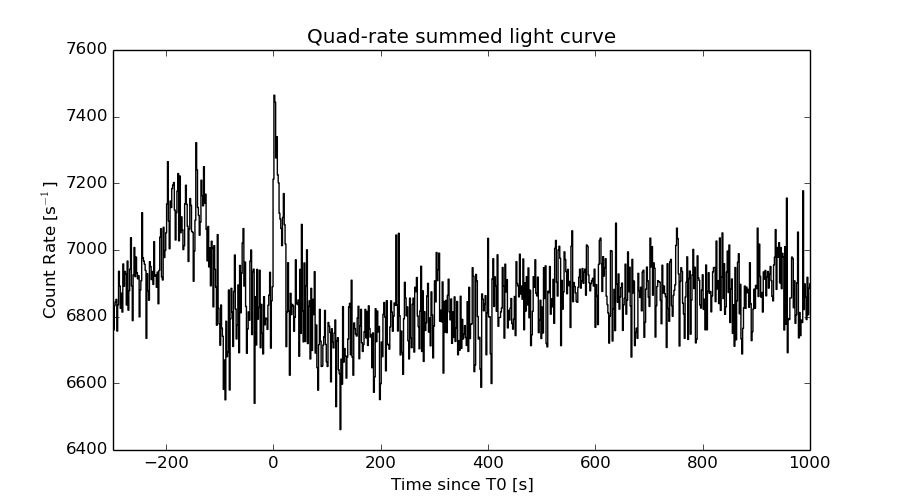
The mask-weighted light curves based on cleaned DPHs

Spectral Evolution
Spectra
Notes:
- 1) The fitting includes the systematic errors.
- 2) When the burst includes telescope slew time periods, the fitting uses an average response file made from multiple 5-s response files through out the slew time plus single time preiod for the non-slew times, and weighted by the total counts in the corresponding time period using addrmf. An average response file is needed becuase a spectral fit using the pre-slew DRM will introduce some errors in both a spectral shape and a normalization if the PHA file contains a lot of the slew/post-slew time interval.
- 3) For fits to more complicated models (e.g. a power-law over a cutoff power-law), the BAT team has decided to require a chi-square improvement of more than 6 for each extra dof.
Time averaged spectrum fit using the average DRM
Power-law model

Time interval is from    0.304 sec. to   30.284 sec.

Spectral model in power-law:
------------------------------------------------------------
Parameters  : value       lower 90%   higher 90%
Photon index: 1.98122     ( -0.242065   0.261079 )
Norm@50keV  : 1.44507E-03    ( -0.000254833   0.000248075 )
------------------------------------------------------------
#Fit statistic : Chi-Squared =          44.11 using 59 PHA bins.
# Reduced chi-squared =         0.7738 for     57 degrees of freedom
# Null hypothesis probability =   8.941584e-01

Photon flux (15-150 keV)    in 29.98 sec: 0.214909 ( -0.0290895  0.0290909 ) ph/cm2/s
Energy fluence (15-150 keV)             : 3.9916e-07 ( -6.56103e-08  6.7637e-08 ) ergs/cm2
Cutoff power-law model

Time interval is from    0.304 sec. to   30.284 sec.
Spectral model in the cutoff power-law:
------------------------------------------------------------
Parameters  : value       lower 90%   higher 90%
Photon index: 0.914635     ( -1.35453   1.03623 )
Epeak [keV] : 42.5082      ( -25.1186 40.9887 )
Norm@50keV  : 5.95164E-03    ( -0.0059515   0.0308757 )
------------------------------------------------------------
#Fit statistic : Chi-Squared =          40.99 using 59 PHA bins.
# Reduced chi-squared =         0.7320 for     56 degrees of freedom
# Null hypothesis probability =   9.338111e-01

Photon flux (15-150 keV)    in 29.98 sec: 0.207656 ( -0.029694  0.029789 ) ph/cm2/s
Energy fluence (15-150 keV)             : 3.64494e-07 ( -6.66192e-08  7.3469e-08 ) ergs/cm2
Band function

Time interval is from    0.304 sec. to   30.284 sec.

Spectral model in the Band function:
------------------------------------------------------------
Parameters  : value       lower 90%   higher 90%
alpha       : -0.916513   ( -0.641243   1.90914 )
beta        : -10.0000    ( 10   3.55271e-15 )
Epeak [keV] : 42.5136      ( -24.7923 40.922 )
Norm@50keV   : 5.93531E-03    ( -0.00593531   0.0309651 )
------------------------------------------------------------
#Fit statistic : Chi-Squared =          40.99 using 59 PHA bins.
# Reduced chi-squared =         0.7453 for     55 degrees of freedom
# Null hypothesis probability =   9.199252e-01

Photon flux (15-150 keV)    in 29.98 sec: 0.209867 ( 6.79013  -0.032415 ) ph/cm2/s
Energy fluence (15-150 keV)             : 0 ( 0  0 ) ergs/cm2
Single BB
Spectral model blackbody:
------------------------------------------------------------
Parameters  : value    Lower 90%  Upper 90%
kT [keV]    : 10.2546  (-1.50206  1.7622)
R^2/D10^2   : 9.31084E-02  (-0.0421113   0.0764138)
(R is the radius in km and D10 is the distance to the source in units of 10 kpc)
------------------------------------------------------------
#Fit statistic : Chi-Squared =          48.21 using 59 PHA bins.
# Reduced chi-squared =         0.8458 for     57 degrees of freedom
# Null hypothesis probability =   7.900431e-01

Energy  Fluence     90% Error
[keV]   [erg/cm2]   [erg/cm2]
15- 25  6.027e-08   1.498e-08
25- 50  1.552e-07   2.764e-08
50-150  8.707e-08   3.167e-08
15-150  3.025e-07   5.441e-08
Thermal bremsstrahlung (OTTB)

Spectral model: thermal bremsstrahlung
------------------------------------------------------------
Parameters  : value         Lower 90%    Upper 90%
kT [keV]    : 66.5907       (-21.9335      41.2963)
Norm        : 1.08645       (-0.211224     0.262569)
------------------------------------------------------------
#Fit statistic : Chi-Squared =          41.36 using 59 PHA bins.
# Reduced chi-squared =         0.7256 for     57 degrees of freedom
# Null hypothesis probability =   9.407648e-01

Energy  Fluence     90% Error
[keV]   [erg/cm2]   [erg/cm2]
15- 25  8.309e-08   1.550e-08
25- 50  1.304e-07   2.184e-08
50-150  1.613e-07   7.039e-08
15-150  3.747e-07   8.550e-08
Double BB
Spectral model: bbodyrad<1> + bbodyrad<2>
------------------------------------------------------------
Parameters  : value         Lower 90%    Upper 90%
kT1 [keV]   : 4.73032        (-3.44715      3.55048)
R1^2/D10^2  : 0.937824        (-0.783967      2536.83)
kT2 [keV]   : 14.4767        (-4.09973      11.0935)
R2^2/D10^2  : 1.98049E-02    (-0.0183249   0.0633006)
------------------------------------------------------------
#Fit statistic : Chi-Squared =          40.93 using 59 PHA bins.
# Reduced chi-squared =         0.7442 for     55 degrees of freedom
# Null hypothesis probability =   9.209416e-01

Energy  Fluence     90% Error
[keV]   [erg/cm2]   [erg/cm2]
15- 25  8.067e-08   4.449e-08
25- 50  1.316e-07   6.780e-08
50-150  1.422e-07   8.462e-08
15-150  3.544e-07   1.838e-07
Peak spectrum fit
Power-law model

Time interval is from    6.208 sec. to    7.208 sec.

Spectral model in power-law:
------------------------------------------------------------
Parameters  : value       lower 90%   higher 90%
Photon index: 1.87630     ( -0.407094   0.455029 )
Norm@50keV  : 4.68128E-03    ( -0.00139488   0.00133636 )
------------------------------------------------------------
#Fit statistic : Chi-Squared =          50.12 using 59 PHA bins.
# Reduced chi-squared =         0.8793 for     57 degrees of freedom
# Null hypothesis probability =   7.286934e-01

Photon flux (15-150 keV)    in 1 sec: 0.665155 ( -0.156132  0.156133 ) ph/cm2/s
Energy fluence (15-150 keV)             : 4.30347e-08 ( -1.21846e-08  1.28061e-08 ) ergs/cm2
Cutoff power-law model

Time interval is from    6.208 sec. to    7.208 sec.
Spectral model in the cutoff power-law:
------------------------------------------------------------
Parameters  : value       lower 90%   higher 90%
Photon index: 0.932495     ( -3.5128   1.22916 )
Epeak [keV] : 46.2103      (   )
Norm@50keV  : 1.67826E-02    (     )
------------------------------------------------------------
#Fit statistic : Chi-Squared =          49.31 using 59 PHA bins.
# Reduced chi-squared =         0.8805 for     56 degrees of freedom
# Null hypothesis probability =   7.244005e-01

Photon flux (15-150 keV)    in 1 sec: 0.646058 ( -0.159535  0.159985 ) ph/cm2/s
Energy fluence (15-150 keV)             : 3.90141e-08 ( -1.29841e-08  1.47321e-08 ) ergs/cm2
Band function

Time interval is from    6.208 sec. to    7.208 sec.

Spectral model in the Band function:
------------------------------------------------------------
Parameters  : value       lower 90%   higher 90%
alpha       : 1.50133   ( 1.01978   2.20262 )
beta        : -2.52699    ( 8.50389   18.5039 )
Epeak [keV] : 34.2648      ( -46.9894 -46.9894 )
Norm@50keV   : 0.721372    ( -0.66524   82.9382 )
------------------------------------------------------------
#Fit statistic : Chi-Squared =          48.63 using 59 PHA bins.
# Reduced chi-squared =         0.8843 for     55 degrees of freedom
# Null hypothesis probability =   7.149237e-01

Photon flux (15-150 keV)    in 1 sec:  (    ) ph/cm2/s
Energy fluence (15-150 keV)             : 3.93935e-08 ( 0  0 ) ergs/cm2
Single BB

Spectral model blackbody:
------------------------------------------------------------
Parameters  : value    Lower 90%  Upper 90%
kT [keV]    : 9.68891  (-2.22774  3.26557)
R^2/D10^2   : 0.361044  (-0.241742   0.616136)
(R is the radius in km and D10 is the distance to the source in units of 10 kpc)
------------------------------------------------------------
#Fit statistic : Chi-Squared =          51.27 using 59 PHA bins.
# Reduced chi-squared =         0.8995 for     57 degrees of freedom
# Null hypothesis probability =   6.888619e-01

Energy  Fluence     90% Error
[keV]   [erg/cm2]   [erg/cm2]
15- 25  6.823e-09   3.383e-09
25- 50  1.621e-08   6.810e-09
50-150  7.716e-09   4.682e-09
15-150  3.075e-08   1.347e-08
Thermal bremsstrahlung (OTTB)

Spectral model: thermal bremsstrahlung
------------------------------------------------------------
Parameters  : value         Lower 90%    Upper 90%
kT [keV]    : 77.3940       (-39.6419      -77.394)
Norm        : 3.18911       (-0.928465     1.44156)
------------------------------------------------------------
#Fit statistic : Chi-Squared =          49.40 using 59 PHA bins.
# Reduced chi-squared =         0.8667 for     57 degrees of freedom
# Null hypothesis probability =   7.527024e-01

Energy  Fluence     90% Error
[keV]   [erg/cm2]   [erg/cm2]
15- 25  8.256e-09   3.786e-09
25- 50  1.348e-08   5.846e-09
50-150  1.861e-08   1.556e-08
15-150  4.035e-08   2.614e-08
Double BB
------------------------------------------------------------
Parameters  : value         Lower 90%    Upper 90%
kT1 [keV]   : 7.43647        (-7.11537      3.57628)
R1^2/D10^2  : 0.761086        (      )
kT2 [keV]   : 25.0525        (-24.6761      -24.6763)
R2^2/D10^2  : 5.60569E-03    (-0.00624548   0.350289)
------------------------------------------------------------
#Fit statistic : Chi-Squared =          48.57 using 59 PHA bins.
#Fit statistic : Chi-Squared =          48.53 using 59 PHA bins.
# Reduced chi-squared =         0.8830 for     55 degrees of freedom
# Reduced chi-squared =         0.8824 for     55 degrees of freedom
# Null hypothesis probability =   7.173240e-01
# Null hypothesis probability =   7.184623e-01

Energy  Fluence     90% Error
[keV]   [erg/cm2]   [erg/cm2]
15- 25  7.945e-09   4.854e-09
25- 50  1.444e-08   8.285e-09
50-150  1.800e-08   1.024e-08
15-150  4.038e-08   2.093e-08
Pre-slew spectrum (Pre-slew PHA with pre-slew DRM)
Power-law model

Spectral model in power-law:
------------------------------------------------------------
Parameters  : value       lower 90%   higher 90%
Photon index: 1.98122     ( -0.242065   0.261079 )
Norm@50keV  : 1.44507E-03    ( -0.000254833   0.000248075 )
------------------------------------------------------------
#Fit statistic : Chi-Squared =          44.11 using 59 PHA bins.
# Reduced chi-squared =         0.7738 for     57 degrees of freedom
# Null hypothesis probability =   8.941584e-01

Photon flux (15-150 keV)    in 29.98 sec: 0.214909 ( -0.0290895  0.0290909 ) ph/cm2/s
Energy fluence (15-150 keV)             : 3.9916e-07 ( -6.56103e-08  6.7637e-08 ) ergs/cm2
Cutoff power-law model
Spectral model in the cutoff power-law:
------------------------------------------------------------
Parameters  : value       lower 90%   higher 90%
Photon index: 0.914635     ( -1.35453   1.03623 )
Epeak [keV] : 42.5082      ( -25.1186 40.9887 )
Norm@50keV  : 5.95164E-03    ( -0.0059515   0.0308757 )
------------------------------------------------------------
#Fit statistic : Chi-Squared =          40.99 using 59 PHA bins.
# Reduced chi-squared =         0.7320 for     56 degrees of freedom
# Null hypothesis probability =   9.338111e-01

Photon flux (15-150 keV)    in 29.98 sec: 0.207656 ( -0.029694  0.029789 ) ph/cm2/s
Energy fluence (15-150 keV)             : 3.64494e-07 ( -6.66192e-08  7.3469e-08 ) ergs/cm2
Band function

Spectral model in the Band function:
------------------------------------------------------------
Parameters  : value       lower 90%   higher 90%
alpha       : -0.916512   ( -0.641247   3.48596 )
beta        : -10.0000    ( 10   1.77636e-15 )
Epeak [keV] : 42.5136      ( -24.9992 40.9369 )
Norm@50keV   : 5.93532E-03    ( -0.00593531   0.0309651 )
------------------------------------------------------------
#Fit statistic : Chi-Squared =          40.99 using 59 PHA bins.
# Reduced chi-squared =         0.7453 for     55 degrees of freedom
# Null hypothesis probability =   9.199252e-01

Photon flux (15-150 keV)    in 29.98 sec: 0.209867 ( 6.79013  -0.032415 ) ph/cm2/s
Energy fluence (15-150 keV)             : 0 ( 0  0 ) ergs/cm2
S(25-50 keV) vs. S(50-100 keV) plot

S(25-50 keV)  = 1.19e-07
S(50-100 keV) = 1.21e-07
T90 vs. Hardness ratio plot

T90                                   = 23.0159999132156 sec.
Hardness ratio (energy fluence ratio) = 1.01681
Color vs. Color plot
Count Ratio  (25-50 keV) / (15-25 keV) = 1.22497
Count Ratio (50-100 keV) / (15-25 keV) = 0.731339
Mask shadow pattern
IMX = 4.306790018847859E-01, IMY = 3.031407496949320E-01
TIME vs. PHA plot around the trigger time

Blue+Cyan dotted lines: Time interval of the scaled map
From 0.000000 to 3.072000
TIME vs. DetID plot around the trigger time

Blue+Cyan dotted lines: Time interval of the scaled map
From 0.000000 to 3.072000
100 us light curve (15-350 keV)

Blue+Cyan dotted lines: Time interval of the scaled map
From 0.000000 to 3.072000
Spacecraft aspect plot
Bright source in the pre-burst/pre-slew/post-slew images
Pre-burst image of 15-350 keV band
Time interval of the image:
-44.667400 0.304000

# RAcent  DECcent POSerr Theta    Phi  PeakCts   SNR AngSep     Name
#  [deg]    [deg]    ['] [deg]  [deg]                   [']
254.5689  35.1995    4.0  34.5  129.3   0.3698   2.9   10.2	Her X-1
288.8838  10.9817    5.4  32.4   54.0   0.2438   2.1    5.5	GRS 1915+105
299.5822  35.2001    0.5   7.2   28.4   1.6041  22.3    0.4	Cyg X-1
308.0353  40.9152    4.0   7.4  -45.5   0.2194   2.9    4.1	Cyg X-3
326.0786  38.4443   72.3  21.4  -52.3  -0.0119  -0.2    8.6	Cyg X-2
312.9026  -3.9205    2.6  48.1   16.8   0.8129   4.4 ------	UNKNOWN
344.2541  14.4666    2.8  48.2  -32.4   0.7153   4.2 ------	UNKNOWN
Pre-slew background subtracted image of 15-350 keV band
Time interval of the image:
0.304000 30.284000

# RAcent  DECcent POSerr Theta    Phi  PeakCts   SNR AngSep     Name
#  [deg]    [deg]    ['] [deg]  [deg]                   [']
254.4896  35.2062    4.9  34.5  129.4  -0.3108  -2.3    8.3	Her X-1
288.8201  11.1245    6.3  32.3   54.1  -0.2198  -1.8   10.8	GRS 1915+105
299.6142  35.2450    5.6   7.2   28.1  -0.1417  -2.0    2.9	Cyg X-1
308.3789  40.8977    0.0   7.6  -45.9  -0.0431  -0.6   12.6	Cyg X-3
326.2245  38.4898    9.7  21.5  -52.6   0.0935   1.2   10.4	Cyg X-2
328.7614  29.1706    1.3  27.8  -35.1   0.7009   8.8 ------	UNKNOWN
246.1119  81.7751    2.3  43.0 -153.1   0.5883   5.0 ------	UNKNOWN
172.8428  79.6703    2.4  54.1 -153.9   1.1896   4.9 ------	UNKNOWN
Post-slew image of 15-350 keV band
Time interval of the image:
90.132610 962.106200

# RAcent  DECcent POSerr Theta    Phi  PeakCts   SNR AngSep     Name
#  [deg]    [deg]    ['] [deg]  [deg]                   [']
299.5835  35.2019    0.3  25.4  124.8  30.5739  43.8    0.3	Cyg X-1
308.0831  40.9854    2.2  20.6  144.1   3.3146   5.4    2.3	Cyg X-3
326.1159  38.4042    3.8   9.5 -179.4   1.6974   3.0    5.6	Cyg X-2
309.6194  -8.8503    2.6  42.3   42.4   6.2042   4.5 ------	UNKNOWN
359.3267  36.3645    3.1  26.5 -100.2   2.4990   3.7 ------	UNKNOWN
  0.8967  50.8821    3.4  32.3 -127.7   2.6788   3.4 ------	UNKNOWN
 18.9773  41.3452    3.2  42.1 -107.2  10.4706   3.6 ------	UNKNOWN
Plot creation:
Sun May 31 01:34:01 EDT 2015