Click here for the BAT GCN circular template
Image
Pre-slew 15.0-350.0 keV image (Event data)

#   RAcent    DECcent   POSerr    Theta     Phi              Peak Cts       SNR   Name
    6.9875     9.3953   0.0098    22.4505   -65.7879         2.6491002     19.491 TRIG_00422783

Foreground time interval of the image:
-15.144  10.157 (delta_t =  25.301 [sec])
Background time interval of the image:
-24.043 -15.144 (delta_t =   8.899 [sec])
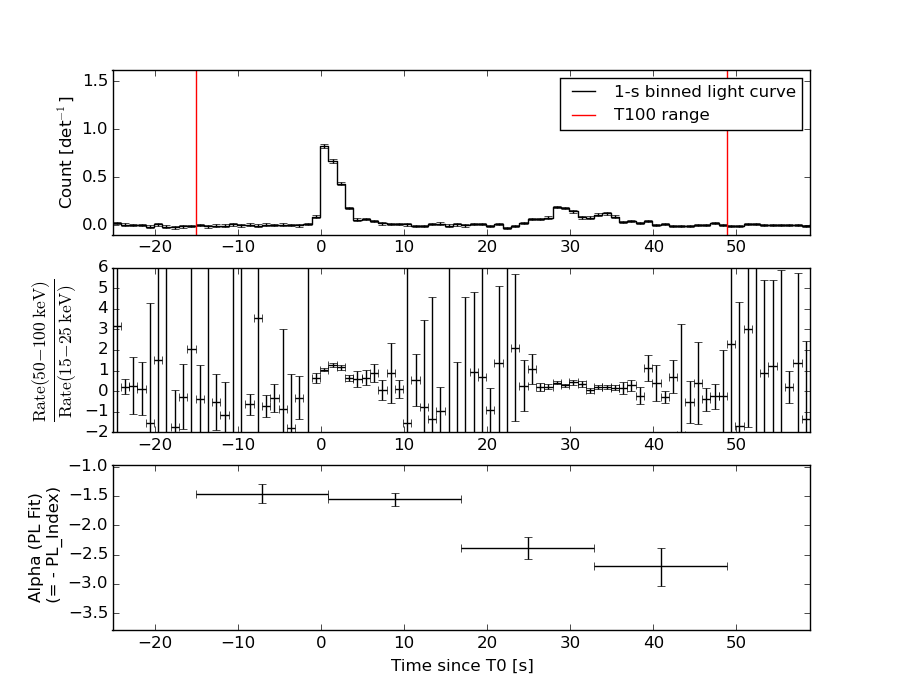
Lightcurves
Notes:
- 1) The mask-weighted light curves are using the flight position.
- 2) Multiple plots of different time binning/intervals are shown to cover all scenarios of short/long GRBs, rate/image triggers, and real/false positives.
- 3) For all the mask-weighted lightcurves, the y-axis units are counts/sec/det where a det is 0.4 x 0.4 = 0.16 sq cm.
- 4) The verticle lines correspond to following: green dotted lines are T50 interval, black dotted lines are T90 interval, blue solid line(s) is a spacecraft slew start time, and orange solid line(s) is a spacecraft slew end time.
- 5) Time of each bin is in the middle of the bin.
1 s binning
From T0-310 s to T0+310 s

From T100_start - 20 s to T100_end + 30 s

Full time interval

64 ms binning
Full time interval

From T100_start to T100_end
From T0-5 sec to T0+5 sec
16 ms binning
From T100_start-5 s to T100_start+5 s

8 ms binning
From T100_start-3 s to T100_start+3 s

2 ms binning
From T100_start-1 s to T100_start+1 s

SN=5 or 10 sec. binning (whichever binning is satisfied first)
SN=5 or 10 sec. binning (T < 200 sec)

Quad-rate summed light curves (from T0-300s to T0+1000s)
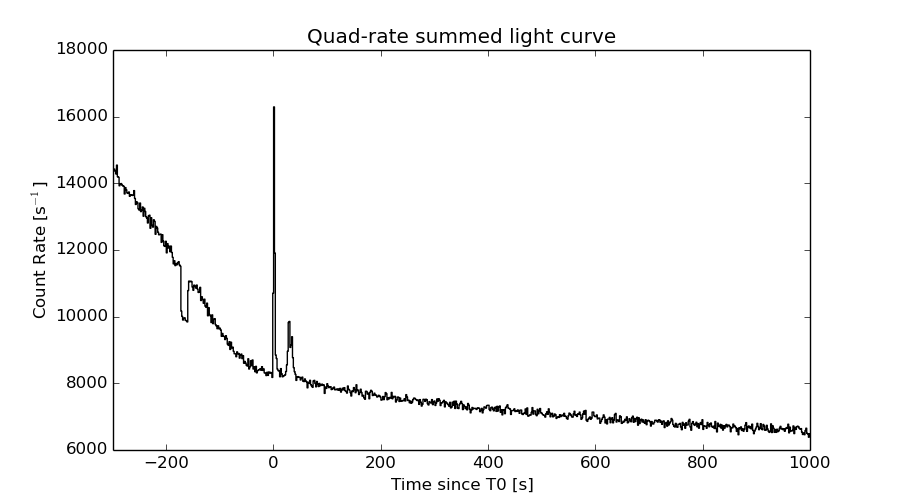
The mask-weighted light curves based on cleaned DPHs

Spectral Evolution
Spectra
Notes:
- 1) The fitting includes the systematic errors.
- 2) When the burst includes telescope slew time periods, the fitting uses an average response file made from multiple 5-s response files through out the slew time plus single time preiod for the non-slew times, and weighted by the total counts in the corresponding time period using addrmf. An average response file is needed becuase a spectral fit using the pre-slew DRM will introduce some errors in both a spectral shape and a normalization if the PHA file contains a lot of the slew/post-slew time interval.
- 3) For fits to more complicated models (e.g. a power-law over a cutoff power-law), the BAT team has decided to require a chi-square improvement of more than 6 for each extra dof.
Time averaged spectrum fit using the average DRM
Power-law model

Time interval is from  -15.144 sec. to   48.856 sec.

Spectral model in power-law:
------------------------------------------------------------
Parameters  : value       lower 90%   higher 90%
Photon index: 1.89838     ( -0.0936803   0.0952915 )
Norm@50keV  : 3.50643E-03    ( -0.0001894   0.000187585 )
------------------------------------------------------------
#Fit statistic : Chi-Squared =          42.32 using 59 PHA bins.
# Reduced chi-squared =         0.7425 for     57 degrees of freedom
# Null hypothesis probability =   9.265514e-01

Photon flux (15-150 keV)    in 64 sec: 0.502864 ( -0.0237364  0.023779 ) ph/cm2/s
Energy fluence (15-150 keV)             : 2.06314e-06 ( -1.09519e-07  1.10639e-07 ) ergs/cm2
Cutoff power-law model

Time interval is from  -15.144 sec. to   48.856 sec.
Spectral model in the cutoff power-law:
------------------------------------------------------------
Parameters  : value       lower 90%   higher 90%
Photon index: 1.61091     ( -0.385944   0.337386 )
Epeak [keV] : 60.6079      ( -16.0923 -60.6079 )
Norm@50keV  : 5.01308E-03    ( -0.00160674   0.00301805 )
------------------------------------------------------------
#Fit statistic : Chi-Squared =          40.40 using 59 PHA bins.
# Reduced chi-squared =         0.7215 for     56 degrees of freedom
# Null hypothesis probability =   9.422250e-01

Photon flux (15-150 keV)    in 64 sec: 0.492893 ( -0.026508  0.026528 ) ph/cm2/s
Energy fluence (15-150 keV)             : 1.99539e-06 ( -1.35706e-07  1.37421e-07 ) ergs/cm2
Band function

Time interval is from  -15.144 sec. to   48.856 sec.

Spectral model in the Band function:
------------------------------------------------------------
Parameters  : value       lower 90%   higher 90%
alpha       : -1.61106   ( -0.340204   0.338787 )
beta        : -10.0000    ( 10   1.77636e-15 )
Epeak [keV] : 60.6051      ( -16.1025 -60.6051 )
Norm@50keV   : 5.01114E-03    ( -0.00160566   0.00301984 )
------------------------------------------------------------
#Fit statistic : Chi-Squared =          40.40 using 59 PHA bins.
# Reduced chi-squared =         0.7346 for     55 degrees of freedom
# Null hypothesis probability =   9.296650e-01

Photon flux (15-150 keV)    in 64 sec: 0.496276 (    ) ph/cm2/s
Energy fluence (15-150 keV)             : 0 ( 0  0 ) ergs/cm2
Single BB

Spectral model blackbody:
------------------------------------------------------------
Parameters  : value    Lower 90%  Upper 90%
kT [keV]    : 11.1947  (  )
R^2/D10^2   : 0.144973  (   )
(R is the radius in km and D10 is the distance to the source in units of 10 kpc)
------------------------------------------------------------
#Fit statistic : Chi-Squared =         138.62 using 59 PHA bins.
# Reduced chi-squared =         2.4320 for     57 degrees of freedom
# Null hypothesis probability =   9.443695e-09

Energy  Fluence     90% Error
[keV]   [erg/cm2]   [erg/cm2]
15- 25  2.438e-07   2.038e-08
25- 50  7.048e-07   3.552e-08
50-150  5.056e-07   6.163e-08
15-150  1.454e-06   8.192e-08
Thermal bremsstrahlung (OTTB)

Spectral model: thermal bremsstrahlung
------------------------------------------------------------
Parameters  : value         Lower 90%    Upper 90%
kT [keV]    : 84.2566       (-13.6892      18.3319)
Norm        : 2.27734       (-0.169816     0.190732)
------------------------------------------------------------
#Fit statistic : Chi-Squared =          42.18 using 59 PHA bins.
# Reduced chi-squared =         0.7400 for     57 degrees of freedom
# Null hypothesis probability =   9.287632e-01

Energy  Fluence     90% Error
[keV]   [erg/cm2]   [erg/cm2]
15- 25  3.793e-07   2.400e-08
25- 50  6.321e-07   2.989e-08
50-150  9.233e-07   1.155e-07
15-150  1.935e-06   1.539e-07
Double BB

------------------------------------------------------------
Parameters  : value         Lower 90%    Upper 90%
kT1 [keV]   : 5.73267        (      )
R1^2/D10^2  : 1.27497        (-0.512449      0.996774)
kT2 [keV]   : 20.2289        (-2.72909      3.78275)
R2^2/D10^2  : 1.21554E-02    (-0.0058766   0.00944073)
------------------------------------------------------------
#Fit statistic : Chi-Squared =          44.73 using 59 PHA bins.
#Fit statistic : Chi-Squared =          38.44 using 59 PHA bins.
# Reduced chi-squared =         0.8133 for     55 degrees of freedom
# Reduced chi-squared =         0.6990 for     55 degrees of freedom
# Null hypothesis probability =   8.372386e-01
# Null hypothesis probability =   9.560843e-01

Energy  Fluence     90% Error
[keV]   [erg/cm2]   [erg/cm2]
15- 25  3.814e-07   1.811e-07
25- 50  5.716e-07   1.876e-07
50-150  8.349e-07   1.814e-07
15-150  1.788e-06   5.075e-07
Peak spectrum fit
Power-law model

Time interval is from    8.356 sec. to    9.356 sec.

Spectral model in power-law:
------------------------------------------------------------
Parameters  : value       lower 90%   higher 90%
Photon index: 3.37613     ( -3.37474   -3.37474 )
Norm@50keV  : 1.60668E-04    ( -0.000160982   0.00128574 )
------------------------------------------------------------
#Fit statistic : Chi-Squared =          50.29 using 59 PHA bins.
# Reduced chi-squared =         0.8823 for     57 degrees of freedom
# Null hypothesis probability =   7.228952e-01

Photon flux (15-150 keV)    in 1 sec: 5.88912E-02 ( -0.058888  0.146047 ) ph/cm2/s
Energy fluence (15-150 keV)             : 2.32941e-09 ( -2.36966e-09  1.37023e-08 ) ergs/cm2
Cutoff power-law model

Time interval is from    8.356 sec. to    9.356 sec.
Spectral model in the cutoff power-law:
------------------------------------------------------------
Parameters  : value       lower 90%   higher 90%
Photon index: 1.00000     (     )
Epeak [keV] : 50.0000      (   )
Norm@50keV  : 9.10258E-04    (     )
------------------------------------------------------------
#Fit statistic : Chi-Squared =          50.66 using 59 PHA bins.
# Reduced chi-squared =         0.9046 for     56 degrees of freedom
# Null hypothesis probability =   6.766226e-01

Photon flux (15-150 keV)    in 1 sec: 7.98853E-02 ( -0.0798853  0.125744 ) ph/cm2/s
Energy fluence (15-150 keV)             : 2.75105e-09 ( -2.75105e-09  5.03426e-09 ) ergs/cm2
Band function

Time interval is from    8.356 sec. to    9.356 sec.

Spectral model in the Band function:
------------------------------------------------------------
Parameters  : value       lower 90%   higher 90%
alpha       : -9.90592   ( 9.90592   9.90592 )
beta        : -3.37632    ( 3.37452   3.37452 )
Epeak [keV] : 77.9577      ( -77.9577 -77.9577 )
Norm@50keV   : 2.18477E-02    ( -0.0218843   0.17482 )
------------------------------------------------------------
#Fit statistic : Chi-Squared =          50.29 using 59 PHA bins.
# Reduced chi-squared =         0.9144 for     55 degrees of freedom
# Null hypothesis probability =   6.547343e-01

Photon flux (15-150 keV)    in 1 sec:  (    ) ph/cm2/s
Energy fluence (15-150 keV)             : 0 ( 0  0 ) ergs/cm2
Single BB

Spectral model blackbody:
------------------------------------------------------------
Parameters  : value    Lower 90%  Upper 90%
kT [keV]    : 4.58508  (-4.49325  -4.49325)
R^2/D10^2   : 0.965217  (-1.01229   -1.01229)
(R is the radius in km and D10 is the distance to the source in units of 10 kpc)
------------------------------------------------------------
#Fit statistic : Chi-Squared =          49.99 using 59 PHA bins.
# Reduced chi-squared =         0.8771 for     57 degrees of freedom
# Null hypothesis probability =   7.330608e-01

Energy  Fluence     90% Error
[keV]   [erg/cm2]   [erg/cm2]
15- 25  1.638e-09   1.070e-09
25- 50  8.587e-10   7.765e-10
50-150  2.254e-11   2.508e-11
15-150  2.519e-09   1.580e-09
Thermal bremsstrahlung (OTTB)

Spectral model: thermal bremsstrahlung
------------------------------------------------------------
Parameters  : value         Lower 90%    Upper 90%
kT [keV]    : 11.7903       (-11.7862      -11.7862)
Norm        : 1.65416       (-1.65607     -1.65607)
------------------------------------------------------------
#Fit statistic : Chi-Squared =          50.15 using 59 PHA bins.
# Reduced chi-squared =         0.8799 for     57 degrees of freedom
# Null hypothesis probability =   7.276387e-01

Energy  Fluence     90% Error
[keV]   [erg/cm2]   [erg/cm2]
15- 25  1.452e-09   8.790e-10
25- 50  7.688e-10   7.500e-10
50-150  8.035e-11   1.491e-10
15-150  2.301e-09   2.643e-09
Double BB

Spectral model: bbodyrad<1> + bbodyrad<2>
------------------------------------------------------------
Parameters  : value         Lower 90%    Upper 90%
kT1 [keV]   : 4.49013        (-4.49021      -4.49021)
R1^2/D10^2  : 1.08360        (-1.05174      -1.05174)
kT2 [keV]   : 1.04559        (-0.126944      -0.126944)
R2^2/D10^2  : 6.81519E-04    (-0.000162863   -0.000162863)
------------------------------------------------------------
#Fit statistic : Chi-Squared =          49.99 using 59 PHA bins.
# Reduced chi-squared =         0.9090 for     55 degrees of freedom
# Null hypothesis probability =   6.658966e-01

Energy  Fluence     90% Error
[keV]   [erg/cm2]   [erg/cm2]
15- 25  1.679e-09   5.120e-09
25- 50  8.331e-10   5.440e-10
50-150  1.957e-11   6.985e-13
15-150  2.532e-09   5.600e-09
Pre-slew spectrum (Pre-slew PHA with pre-slew DRM)
Power-law model

Spectral model in power-law:
------------------------------------------------------------
Parameters  : value       lower 90%   higher 90%
Photon index: 1.54717     ( -0.0863731   0.0868509 )
Norm@50keV  : 6.28225E-03    ( -0.000309131   0.000307903 )
------------------------------------------------------------
#Fit statistic : Chi-Squared =          51.65 using 59 PHA bins.
# Reduced chi-squared =         0.9061 for     57 degrees of freedom
# Null hypothesis probability =   6.753792e-01

Photon flux (15-150 keV)    in 25.3 sec: 0.794645 ( -0.037906  0.0379407 ) ph/cm2/s
Energy fluence (15-150 keV)             : 1.49689e-06 ( -8.08897e-08  8.1504e-08 ) ergs/cm2
Cutoff power-law model

Spectral model in the cutoff power-law:
------------------------------------------------------------
Parameters  : value       lower 90%   higher 90%
Photon index: 1.18148     ( -0.354732   0.327231 )
Epeak [keV] : 107.143      ( -31.4485 376.533 )
Norm@50keV  : 9.72478E-03    ( -0.00307079   0.00499223 )
------------------------------------------------------------
#Fit statistic : Chi-Squared =          47.95 using 59 PHA bins.
# Reduced chi-squared =         0.8563 for     56 degrees of freedom
# Null hypothesis probability =   7.692332e-01

Photon flux (15-150 keV)    in 25.3 sec: 0.778054 ( -0.040565  0.040545 ) ph/cm2/s
Energy fluence (15-150 keV)             : 1.44161e-06 ( -9.47181e-08  9.49104e-08 ) ergs/cm2
Band function

Spectral model in the Band function:
------------------------------------------------------------
Parameters  : value       lower 90%   higher 90%
alpha       : 4.84064   ( -10.8062   -4.84064 )
beta        : -1.66192    ( -0.106744   0.103155 )
Epeak [keV] : 25.9068      ( -2.88857 2.65601 )
Norm@50keV   : 426.060    ( -19.8251   940.516 )
------------------------------------------------------------
#Fit statistic : Chi-Squared =          42.20 using 59 PHA bins.
# Reduced chi-squared =         0.7672 for     55 degrees of freedom
# Null hypothesis probability =   8.972621e-01

Photon flux (15-150 keV)    in 25.3 sec: 0.777637 ( 6.22236  -0.040581 ) ph/cm2/s
Energy fluence (15-150 keV)             : 1.45769e-06 ( -1.45752e-06  -8.48739e-08 ) ergs/cm2
S(25-50 keV) vs. S(50-100 keV) plot

S(25-50 keV)  = 6.02e-07
S(50-100 keV) = 6.45e-07
T90 vs. Hardness ratio plot

T90                                   = 48 sec.
Hardness ratio (energy fluence ratio) = 1.07143
Color vs. Color plot

Count Ratio  (25-50 keV) / (15-25 keV) = 1.09515
Count Ratio (50-100 keV) / (15-25 keV) = 0.620281
Mask shadow pattern

IMX = 1.694607009765067E-01, IMY = 3.768543694834663E-01
TIME vs. PHA plot around the trigger time
TIME vs. DetID plot around the trigger time

100 us light curve (15-350 keV)

Spacecraft aspect plot

Bright source in the pre-burst/pre-slew/post-slew images
Pre-burst image of 15-350 keV band
Time interval of the image:
-24.043410 -15.144000

# RAcent  DECcent POSerr Theta    Phi  PeakCts   SNR AngSep     Name
#  [deg]    [deg]    ['] [deg]  [deg]                   [']
299.6220  35.2054    3.3  48.8  158.8   0.3996   3.6    1.6	Cyg X-1
308.0912  40.8781    4.6  45.7  170.0  -0.1821  -2.5    4.6	Cyg X-3
325.9309  38.3672   13.4  34.3 -177.4  -0.0354  -0.9   11.7	Cyg X-2
355.4819 -44.3397    2.3  53.7   18.7   0.9583   4.9 ------	UNKNOWN
343.9796  26.2054    3.0  17.8 -152.3   0.1239   3.8 ------	UNKNOWN
352.4388  20.9371    2.2  14.8 -120.2   0.1753   5.2 ------	UNKNOWN
 22.9049  26.2905    3.0  40.8  -92.4   0.5747   3.9 ------	UNKNOWN
Pre-slew background subtracted image of 15-350 keV band
Time interval of the image:
-15.144000 10.156590

# RAcent  DECcent POSerr Theta    Phi  PeakCts   SNR AngSep     Name
#  [deg]    [deg]    ['] [deg]  [deg]                   [']
299.5045  35.1171  219.1  48.8  158.7  -0.0196  -0.1    6.6	Cyg X-1
308.0897  40.9283    6.0  45.7  170.0   0.4802   1.9    1.7	Cyg X-3
325.9443  38.3532    4.9  34.2 -177.4   0.3309   2.4   10.9	Cyg X-2
312.8184  60.1672    2.3  56.9 -169.5   2.4056   4.9 ------	UNKNOWN
  6.9875   9.3952    0.6  22.5  -65.8   2.6491  19.5 ------	UNKNOWN
Post-slew image of 15-350 keV band
Time interval of the image:
54.756600 962.910600

# RAcent  DECcent POSerr Theta    Phi  PeakCts   SNR AngSep     Name
#  [deg]    [deg]    ['] [deg]  [deg]                   [']
326.3492  38.2584    5.8  46.4  154.0   3.4438   2.0    9.2	Cyg X-2
322.2311  45.6179    3.1  52.6  160.6   9.6054   3.7 ------	UNKNOWN
 41.4155 -36.2309    4.6  56.0  -14.6   5.9108   2.5 ------	UNKNOWN
 31.4200  20.7883    3.3  26.2  -99.8   2.1899   3.5 ------	UNKNOWN
Plot creation:
Sun May 31 01:31:35 EDT 2015