Click here for the BAT GCN circular template
Image
Pre-slew 15.0-350.0 keV image (Event data)

#   RAcent    DECcent   POSerr    Theta     Phi              Peak Cts       SNR   Name
    0.7282   -37.9244   0.0189    10.3333   123.4695         1.0024224     10.201 TRIG_00423184

Foreground time interval of the image:
-26.352  47.648 (delta_t =  74.000 [sec])
Background time interval of the image:
-502.352 -382.288 (delta_t = 120.064 [sec])
-239.352 -26.352 (delta_t = 213.000 [sec])
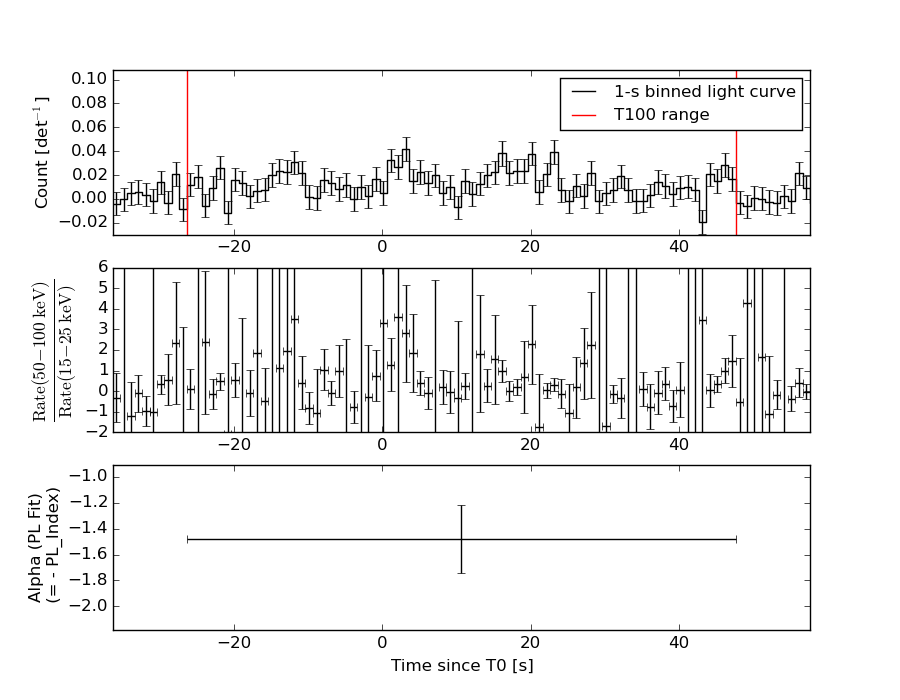
Lightcurves
Notes:
- 1) The mask-weighted light curves are using the flight position.
- 2) Multiple plots of different time binning/intervals are shown to cover all scenarios of short/long GRBs, rate/image triggers, and real/false positives.
- 3) For all the mask-weighted lightcurves, the y-axis units are counts/sec/det where a det is 0.4 x 0.4 = 0.16 sq cm.
- 4) The verticle lines correspond to following: green dotted lines are T50 interval, black dotted lines are T90 interval, blue solid line(s) is a spacecraft slew start time, and orange solid line(s) is a spacecraft slew end time.
- 5) Time of each bin is in the middle of the bin.
1 s binning
From T0-310 s to T0+310 s
From T100_start - 20 s to T100_end + 30 s
Full time interval
64 ms binning
Full time interval
From T100_start to T100_end
From T0-5 sec to T0+5 sec
16 ms binning
From T100_start-5 s to T100_start+5 s
Blue+Cyan dotted lines: Time interval of the scaled map
From 0.000000 to 26.880000
8 ms binning
From T100_start-3 s to T100_start+3 s
Blue+Cyan dotted lines: Time interval of the scaled map
From 0.000000 to 26.880000
2 ms binning
From T100_start-1 s to T100_start+1 s
Blue+Cyan dotted lines: Time interval of the scaled map
From 0.000000 to 26.880000
SN=5 or 10 sec. binning (whichever binning is satisfied first)
SN=5 or 10 sec. binning (T < 200 sec)
Quad-rate summed light curves (from T0-300s to T0+1000s)
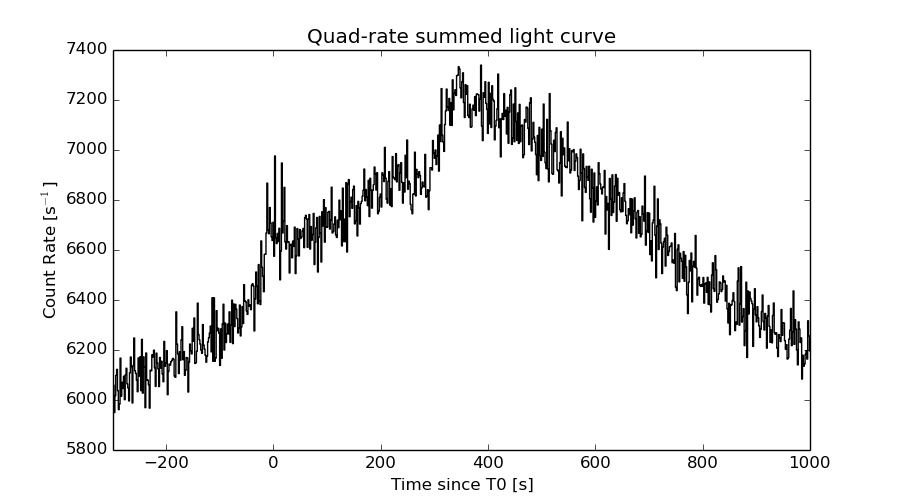
The mask-weighted light curves based on cleaned DPHs

Spectral Evolution
Spectra
Notes:
- 1) The fitting includes the systematic errors.
- 2) When the burst includes telescope slew time periods, the fitting uses an average response file made from multiple 5-s response files through out the slew time plus single time preiod for the non-slew times, and weighted by the total counts in the corresponding time period using addrmf. An average response file is needed becuase a spectral fit using the pre-slew DRM will introduce some errors in both a spectral shape and a normalization if the PHA file contains a lot of the slew/post-slew time interval.
- 3) For fits to more complicated models (e.g. a power-law over a cutoff power-law), the BAT team has decided to require a chi-square improvement of more than 6 for each extra dof.
Time averaged spectrum fit using the average DRM
Power-law model
Time interval is from  -26.352 sec. to   47.648 sec.

Spectral model in power-law:
------------------------------------------------------------
Parameters  : value       lower 90%   higher 90%
Photon index: 1.47839     ( -0.262726   0.267109 )
Norm@50keV  : 7.56398E-04    ( -0.000120059   0.000118062 )
------------------------------------------------------------
#Fit statistic : Chi-Squared =          58.16 using 59 PHA bins.
# Reduced chi-squared =          1.020 for     57 degrees of freedom
# Null hypothesis probability =   4.322053e-01

Photon flux (15-150 keV)    in 74 sec: 9.38899E-02 ( -0.0138282  0.0138324 ) ph/cm2/s
Energy fluence (15-150 keV)             : 5.32921e-07 ( -9.36477e-08  9.61512e-08 ) ergs/cm2
Cutoff power-law model
Time interval is from  -26.352 sec. to   47.648 sec.
Spectral model in the cutoff power-law:
------------------------------------------------------------
Parameters  : value       lower 90%   higher 90%
Photon index: 1.30323     (     )
Epeak [keV] : 181.979      (   )
Norm@50keV  : 9.42757E-04    (     )
------------------------------------------------------------
#Fit statistic : Chi-Squared =          58.07 using 59 PHA bins.
# Reduced chi-squared =          1.037 for     56 degrees of freedom
# Null hypothesis probability =   3.988148e-01

Photon flux (15-150 keV)    in 74 sec: 9.31712E-02 ( -0.0142211  0.0142808 ) ph/cm2/s
Energy fluence (15-150 keV)             : 5.22275e-07 ( -1.1286e-07  1.04733e-07 ) ergs/cm2
Band function

Time interval is from  -26.352 sec. to   47.648 sec.

Spectral model in the Band function:
------------------------------------------------------------
Parameters  : value       lower 90%   higher 90%
alpha       : 4.79267   ( -4.79267   -4.79267 )
beta        : -1.68502    ( -0.396834   0.336154 )
Epeak [keV] : 27.6481      ( -8.18181 5.999 )
Norm@50keV   : 32.0178    ( -4.66825   369080 )
------------------------------------------------------------
#Fit statistic : Chi-Squared =          56.42 using 59 PHA bins.
# Reduced chi-squared =          1.026 for     55 degrees of freedom
# Null hypothesis probability =   4.216003e-01

Photon flux (15-150 keV)    in 74 sec:  (    ) ph/cm2/s
Energy fluence (15-150 keV)             : 0 ( 0  0 ) ergs/cm2
Single BB
Spectral model blackbody:
------------------------------------------------------------
Parameters  : value    Lower 90%  Upper 90%
kT [keV]    : 12.9681  (-2.36986  3.1187)
R^2/D10^2   : 1.75103E-02  (-0.00925882   0.0183314)
(R is the radius in km and D10 is the distance to the source in units of 10 kpc)
------------------------------------------------------------
#Fit statistic : Chi-Squared =          68.23 using 59 PHA bins.
# Reduced chi-squared =          1.197 for     57 degrees of freedom
# Null hypothesis probability =   1.465959e-01

Energy  Fluence     90% Error
[keV]   [erg/cm2]   [erg/cm2]
15- 25  4.622e-08   1.410e-08
25- 50  1.588e-07   3.533e-08
50-150  1.685e-07   5.739e-08
15-150  3.735e-07   8.695e-08
Thermal bremsstrahlung (OTTB)
Spectral model: thermal bremsstrahlung
------------------------------------------------------------
Parameters  : value         Lower 90%    Upper 90%
kT [keV]    : 199.344       (-95.6781      -199.362)
Norm        : 0.383149       (-0.0562354     0.056277)
------------------------------------------------------------
#Fit statistic : Chi-Squared =          58.18 using 59 PHA bins.
# Reduced chi-squared =          1.021 for     57 degrees of freedom
# Null hypothesis probability =   4.317098e-01

Energy  Fluence     90% Error
[keV]   [erg/cm2]   [erg/cm2]
15- 25  7.060e-08   4.077e-08
25- 50  1.358e-07   7.707e-08
50-150  2.978e-07   1.693e-07
15-150  5.043e-07   2.863e-07
Double BB

------------------------------------------------------------
Parameters  : value         Lower 90%    Upper 90%
kT1 [keV]   : 8.07141        (-3.18158      3.86804)
R1^2/D10^2  : 7.03469E-02        (      )
kT2 [keV]   : 38.1035        (-17.2771      -38.2831)
R2^2/D10^2  : 3.48639E-04    (-0.000333267   0.00354242)
------------------------------------------------------------
#Fit statistic : Chi-Squared =          57.58 using 59 PHA bins.
#Fit statistic : Chi-Squared =          56.88 using 59 PHA bins.
# Reduced chi-squared =          1.047 for     55 degrees of freedom
# Reduced chi-squared =          1.034 for     55 degrees of freedom
# Null hypothesis probability =   3.800359e-01
# Null hypothesis probability =   4.049409e-01

Energy  Fluence     90% Error
[keV]   [erg/cm2]   [erg/cm2]
15- 25  6.746e-08   4.052e-08
25- 50  1.332e-07   7.381e-08
50-150  2.874e-07   1.730e-07
15-150  4.881e-07   2.683e-07
Peak spectrum fit
Power-law model
Time interval is from    2.648 sec. to    3.648 sec.

Spectral model in power-law:
------------------------------------------------------------
Parameters  : value       lower 90%   higher 90%
Photon index: 0.694609     ( -0.911412   0.751056 )
Norm@50keV  : 2.52370E-03    ( -0.00114544   0.00103294 )
------------------------------------------------------------
#Fit statistic : Chi-Squared =          46.80 using 59 PHA bins.
# Reduced chi-squared =         0.8210 for     57 degrees of freedom
# Null hypothesis probability =   8.304583e-01

Photon flux (15-150 keV)    in 1 sec: 0.291840 ( -0.114464  0.116349 ) ph/cm2/s
Energy fluence (15-150 keV)             : 3.08804e-08 ( -1.24764e-08  1.27076e-08 ) ergs/cm2
Cutoff power-law model

Time interval is from    2.648 sec. to    3.648 sec.
Spectral model in the cutoff power-law:
------------------------------------------------------------
Parameters  : value       lower 90%   higher 90%
Photon index: 0.691681     ( -0.922884   0.75277 )
Epeak [keV] : 9999.36      ( -9999.36 -9999.36 )
Norm@50keV  : 2.54593E-03    (     )
------------------------------------------------------------
#Fit statistic : Chi-Squared =          46.80 using 59 PHA bins.
# Reduced chi-squared =         0.8357 for     56 degrees of freedom
# Null hypothesis probability =   8.046741e-01

Photon flux (15-150 keV)    in 1 sec: 0.291923 ( -0.126519  0.114625 ) ph/cm2/s
Energy fluence (15-150 keV)             : 3.08585e-08 ( -1.23391e-08  1.26447e-08 ) ergs/cm2
Band function

Time interval is from    2.648 sec. to    3.648 sec.

Spectral model in the Band function:
------------------------------------------------------------
Parameters  : value       lower 90%   higher 90%
alpha       : -9.99999   ( 9.99999   9.99999 )
beta        : -0.694611    ( -0.751419   0.910562 )
Epeak [keV] : 17.3262      ( -17.3262 -17.3262 )
Norm@50keV   : 0.343007    ( -0.155682   0.140392 )
------------------------------------------------------------
#Fit statistic : Chi-Squared =          46.80 using 59 PHA bins.
# Reduced chi-squared =         0.8509 for     55 degrees of freedom
# Null hypothesis probability =   7.764824e-01

Photon flux (15-150 keV)    in 1 sec:  (    ) ph/cm2/s
Energy fluence (15-150 keV)             : 0 ( 0  0 ) ergs/cm2
Single BB
Spectral model blackbody:
------------------------------------------------------------
Parameters  : value    Lower 90%  Upper 90%
kT [keV]    : 29.2711  (-11.8052  43.4481)
R^2/D10^2   : 4.76650E-03  (-0.00476651   0.0170691)
(R is the radius in km and D10 is the distance to the source in units of 10 kpc)
------------------------------------------------------------
#Fit statistic : Chi-Squared =          47.27 using 59 PHA bins.
# Reduced chi-squared =         0.8294 for     57 degrees of freedom
# Null hypothesis probability =   8.173198e-01

Energy  Fluence     90% Error
[keV]   [erg/cm2]   [erg/cm2]
15- 25  6.486e-10   4.230e-10
25- 50  3.960e-09   2.433e-09
50-150  2.419e-08   1.543e-08
15-150  2.880e-08   1.885e-08
Thermal bremsstrahlung (OTTB)

Spectral model: thermal bremsstrahlung
------------------------------------------------------------
Parameters  : value         Lower 90%    Upper 90%
kT [keV]    : 199.360       (-115.726      -199.362)
Norm        : 1.15108       (-0.482037     0.482043)
------------------------------------------------------------
#Fit statistic : Chi-Squared =          50.45 using 59 PHA bins.
# Reduced chi-squared =         0.8850 for     57 degrees of freedom
# Null hypothesis probability =   7.176576e-01

Energy  Fluence     90% Error
[keV]   [erg/cm2]   [erg/cm2]
15- 25  2.866e-09   1.906e-09
25- 50  5.514e-09   3.637e-09
50-150  1.209e-08   7.925e-09
15-150  2.047e-08   1.347e-08
Double BB

------------------------------------------------------------
Parameters  : value         Lower 90%    Upper 90%
kT1 [keV]   : 1.26708        (-1.66015      3.002)
R1^2/D10^2  : 1.03051E+04        (      )
kT2 [keV]   : 31.0285        (-12.6966      55.4367)
R2^2/D10^2  : 3.98170E-03    (-0.00360698   0.00915891)
------------------------------------------------------------
#Fit statistic : Chi-Squared =          45.64 using 59 PHA bins.
#Fit statistic : Chi-Squared =          45.52 using 59 PHA bins.
# Reduced chi-squared =         0.8298 for     55 degrees of freedom
# Reduced chi-squared =         0.8277 for     55 degrees of freedom
# Null hypothesis probability =   8.116761e-01
# Null hypothesis probability =   8.151492e-01

Energy  Fluence     90% Error
[keV]   [erg/cm2]   [erg/cm2]
15- 25  1.576e-09   5.400e-10
25- 50  3.627e-09   2.221e-09
50-150  2.472e-08   1.589e-08
15-150  2.992e-08   1.826e-08
Pre-slew spectrum (Pre-slew PHA with pre-slew DRM)
Power-law model

Spectral model in power-law:
------------------------------------------------------------
Parameters  : value       lower 90%   higher 90%
Photon index: 1.47839     ( -0.262726   0.267109 )
Norm@50keV  : 7.56398E-04    ( -0.000120059   0.000118062 )
------------------------------------------------------------
#Fit statistic : Chi-Squared =          58.16 using 59 PHA bins.
# Reduced chi-squared =          1.020 for     57 degrees of freedom
# Null hypothesis probability =   4.322053e-01

Photon flux (15-150 keV)    in 74 sec: 9.38899E-02 ( -0.0138282  0.0138324 ) ph/cm2/s
Energy fluence (15-150 keV)             : 5.32921e-07 ( -9.36477e-08  9.61512e-08 ) ergs/cm2
Cutoff power-law model

Spectral model in the cutoff power-law:
------------------------------------------------------------
Parameters  : value       lower 90%   higher 90%
Photon index: 1.30323     (     )
Epeak [keV] : 181.979      (   )
Norm@50keV  : 9.42757E-04    (     )
------------------------------------------------------------
#Fit statistic : Chi-Squared =          58.07 using 59 PHA bins.
# Reduced chi-squared =          1.037 for     56 degrees of freedom
# Null hypothesis probability =   3.988148e-01

Photon flux (15-150 keV)    in 74 sec: 9.31712E-02 ( -0.0142211  0.0142808 ) ph/cm2/s
Energy fluence (15-150 keV)             : 5.22275e-07 ( -1.1286e-07  1.04733e-07 ) ergs/cm2
Band function

Spectral model in the Band function:
------------------------------------------------------------
Parameters  : value       lower 90%   higher 90%
alpha       : 4.79267   ( -4.79267   -4.79267 )
beta        : -1.68502    ( -0.396834   0.336154 )
Epeak [keV] : 27.6481      ( -8.18181 5.999 )
Norm@50keV   : 32.0178    ( -4.66825   369080 )
------------------------------------------------------------
#Fit statistic : Chi-Squared =          56.42 using 59 PHA bins.
# Reduced chi-squared =          1.026 for     55 degrees of freedom
# Null hypothesis probability =   4.216003e-01

Photon flux (15-150 keV)    in 74 sec:  (    ) ph/cm2/s
Energy fluence (15-150 keV)             : 0 ( 0  0 ) ergs/cm2
S(25-50 keV) vs. S(50-100 keV) plot
S(25-50 keV)  = 1.30e-07
S(50-100 keV) = 1.87e-07
T90 vs. Hardness ratio plot
T90                                   = 67 sec.
Hardness ratio (energy fluence ratio) = 1.43846
Color vs. Color plot
Count Ratio  (25-50 keV) / (15-25 keV) = 1.33871
Count Ratio (50-100 keV) / (15-25 keV) = 0.879929
Mask shadow pattern

IMX = -1.005538939088317E-01, IMY = -1.520964210415964E-01
TIME vs. PHA plot around the trigger time
Blue+Cyan dotted lines: Time interval of the scaled map
From 0.000000 to 26.880000
TIME vs. DetID plot around the trigger time

Blue+Cyan dotted lines: Time interval of the scaled map
From 0.000000 to 26.880000
100 us light curve (15-350 keV)
Blue+Cyan dotted lines: Time interval of the scaled map
From 0.000000 to 26.880000
Spacecraft aspect plot
Bright source in the pre-burst/pre-slew/post-slew images
Pre-burst image of 15-350 keV band
Time interval of the image:
-502.352000 -382.288300
-239.352000 -26.352000

# RAcent  DECcent POSerr Theta    Phi  PeakCts   SNR AngSep     Name
#  [deg]    [deg]    ['] [deg]  [deg]                   [']
334.6260 -64.0169    2.7  35.1   67.5   2.0803   4.2 ------	UNKNOWN
353.5620 -48.7015    2.9  18.3   85.3   1.0272   4.0 ------	UNKNOWN
340.9674   6.9398    3.0  54.1  177.0   3.3571   3.8 ------	UNKNOWN
 92.1694 -47.2967    3.7  56.1  -14.5   2.7084   3.2 ------	UNKNOWN
Pre-slew background subtracted image of 15-350 keV band
Time interval of the image:
-26.352000 47.648000

# RAcent  DECcent POSerr Theta    Phi  PeakCts   SNR AngSep     Name
#  [deg]    [deg]    ['] [deg]  [deg]                   [']
332.9348 -73.6793    2.1  41.0   54.9   1.6699   5.6 ------	UNKNOWN
  0.7282 -37.9244    1.1  10.3  123.5   1.0023  10.2 ------	UNKNOWN
  8.6081 -43.3610    2.4   6.9   72.0   0.4364   4.8 ------	UNKNOWN
 65.8278 -28.6744    2.3  43.9  -47.3   1.1334   5.0 ------	UNKNOWN
 68.4253 -24.4890    3.0  47.9  -50.9   1.5914   3.9 ------	UNKNOWN
Post-slew image of 15-350 keV band
Time interval of the image:
365.148610 962.774500

# RAcent  DECcent POSerr Theta    Phi  PeakCts   SNR AngSep     Name
#  [deg]    [deg]    ['] [deg]  [deg]                   [']
 83.6387  22.0189    0.3  28.7  -99.5  22.9499  38.0    0.4	Crab
120.4632 -25.1829    3.0  47.1  156.5   4.7194   3.9 ------	UNKNOWN
101.8817 -31.0663    3.9  54.1  177.3   5.0517   3.0 ------	UNKNOWN
 80.2306  33.8549    3.2  32.6  -76.6   2.6892   3.6 ------	UNKNOWN
 72.8997 -13.6641    2.6  54.0 -143.2  10.7516   4.4 ------	UNKNOWN
 70.5453  15.1678    3.2  42.1 -107.2   6.5753   3.6 ------	UNKNOWN
Plot creation:
Sun May 31 01:26:05 EDT 2015