Click here for the BAT GCN circular template
Image
Pre-slew 15.0-350.0 keV image (Event data)
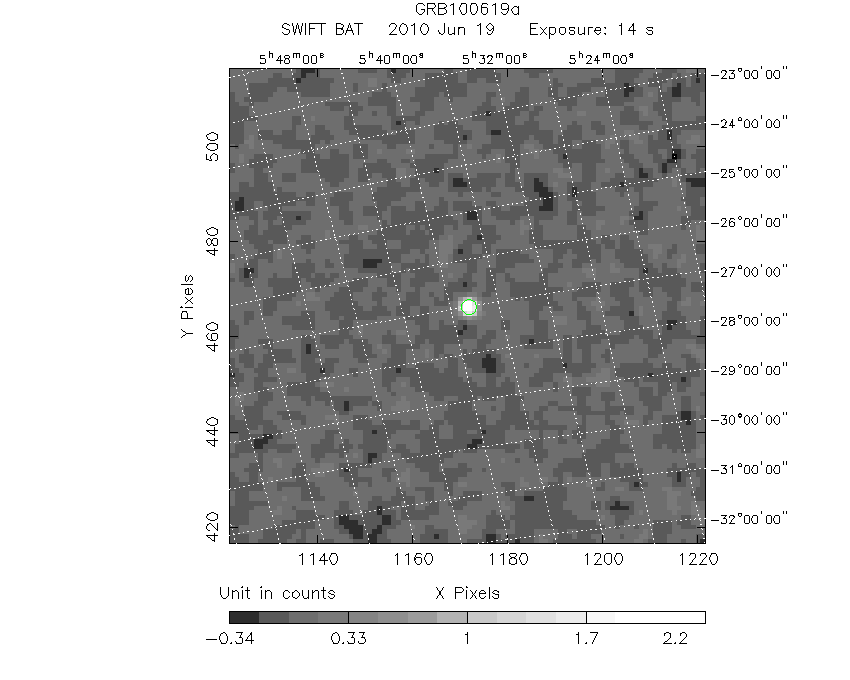
#   RAcent    DECcent   POSerr    Theta     Phi              Peak Cts       SNR   Name
   84.6177   -27.0119   0.0064    31.5605   177.9704         2.5168302     30.200 TRIG_00424998

Foreground time interval of the image:
 -2.948  10.949 (delta_t =  13.897 [sec])
Background time interval of the image:
-11.051  -2.948 (delta_t =   8.103 [sec])
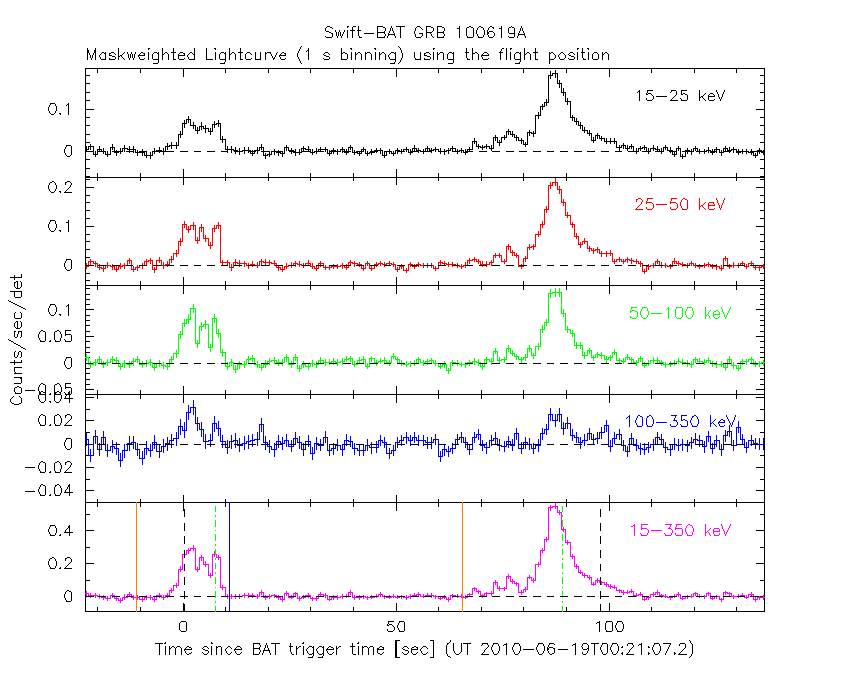
Lightcurves
Notes:
- 1) The mask-weighted light curves are using the flight position.
- 2) Multiple plots of different time binning/intervals are shown to cover all scenarios of short/long GRBs, rate/image triggers, and real/false positives.
- 3) For all the mask-weighted lightcurves, the y-axis units are counts/sec/det where a det is 0.4 x 0.4 = 0.16 sq cm.
- 4) The verticle lines correspond to following: green dotted lines are T50 interval, black dotted lines are T90 interval, blue solid line(s) is a spacecraft slew start time, and orange solid line(s) is a spacecraft slew end time.
- 5) Time of each bin is in the middle of the bin.
1 s binning
From T0-310 s to T0+310 s

From T100_start - 20 s to T100_end + 30 s
Full time interval

64 ms binning
Full time interval

From T100_start to T100_end

From T0-5 sec to T0+5 sec

16 ms binning
From T100_start-5 s to T100_start+5 s

Blue+Cyan dotted lines: Time interval of the scaled map
From 0.000000 to 0.256000
8 ms binning
From T100_start-3 s to T100_start+3 s

Blue+Cyan dotted lines: Time interval of the scaled map
From 0.000000 to 0.256000
2 ms binning
From T100_start-1 s to T100_start+1 s

Blue+Cyan dotted lines: Time interval of the scaled map
From 0.000000 to 0.256000
SN=5 or 10 sec. binning (whichever binning is satisfied first)

SN=5 or 10 sec. binning (T < 200 sec)

Quad-rate summed light curves (from T0-300s to T0+1000s)

The mask-weighted light curves based on cleaned DPHs

Spectral Evolution

Spectra
Notes:
- 1) The fitting includes the systematic errors.
- 2) When the burst includes telescope slew time periods, the fitting uses an average response file made from multiple 5-s response files through out the slew time plus single time preiod for the non-slew times, and weighted by the total counts in the corresponding time period using addrmf. An average response file is needed becuase a spectral fit using the pre-slew DRM will introduce some errors in both a spectral shape and a normalization if the PHA file contains a lot of the slew/post-slew time interval.
- 3) For fits to more complicated models (e.g. a power-law over a cutoff power-law), the BAT team has decided to require a chi-square improvement of more than 6 for each extra dof.
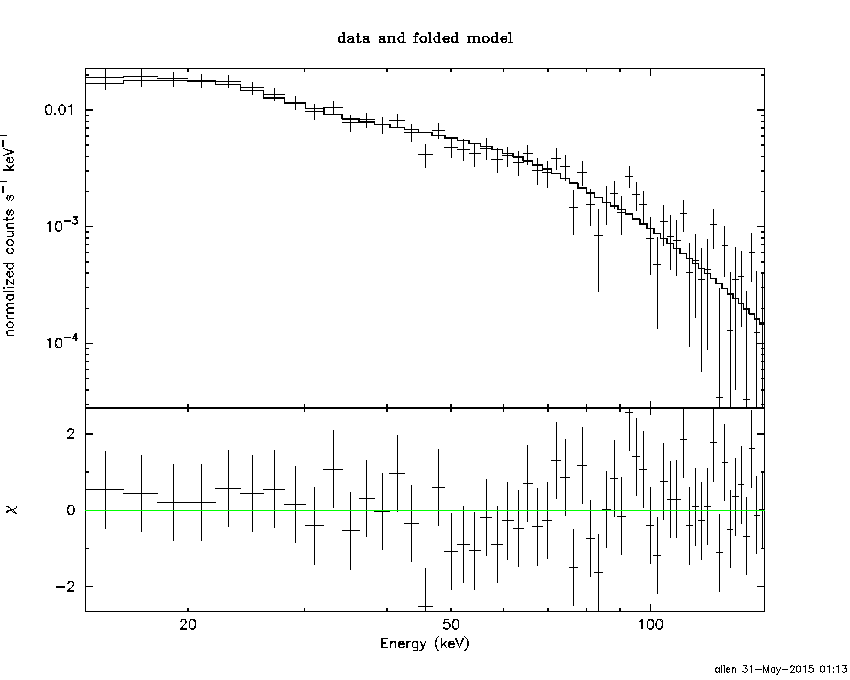
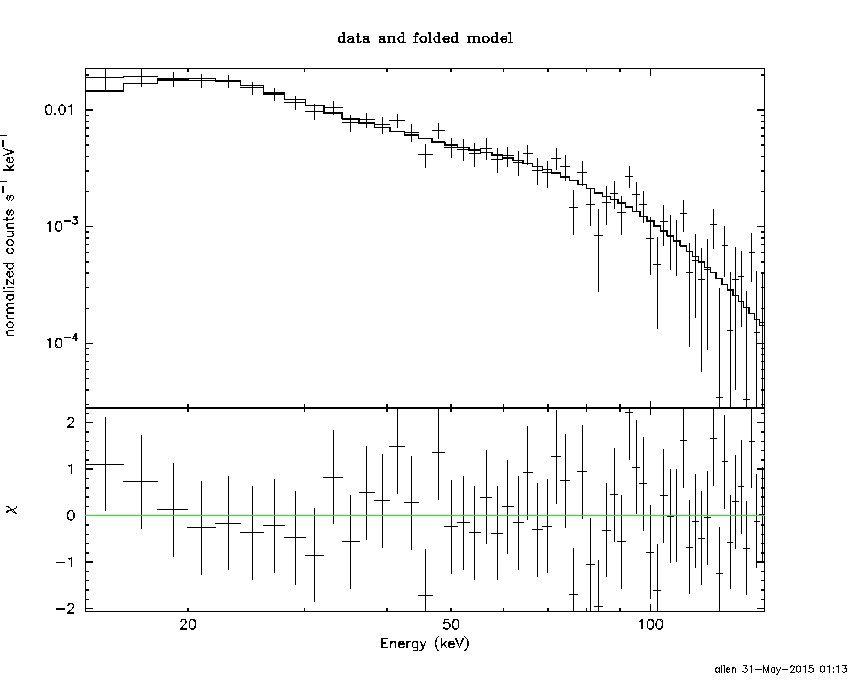
Time averaged spectrum fit using the average DRM
Power-law model

Time interval is from   -2.948 sec. to  106.536 sec.

Spectral model in power-law:
------------------------------------------------------------
Parameters  : value       lower 90%   higher 90%
Photon index: 1.78025     ( -0.0598146   0.0602214 )
Norm@50keV  : 4.36609E-03    ( -0.000133822   0.000133293 )
------------------------------------------------------------
#Fit statistic : Chi-Squared =          43.41 using 59 PHA bins.
# Reduced chi-squared =         0.7617 for     57 degrees of freedom
# Null hypothesis probability =   9.076673e-01

Photon flux (15-150 keV)    in 109.5 sec: 0.597093 ( -0.0193599  0.0194394 ) ph/cm2/s
Energy fluence (15-150 keV)             : 4.40474e-06 ( -1.38196e-07  1.38793e-07 ) ergs/cm2
Cutoff power-law model

Time interval is from   -2.948 sec. to  106.536 sec.
Spectral model in the cutoff power-law:
------------------------------------------------------------
Parameters  : value       lower 90%   higher 90%
Photon index: 1.73432     ( -0.232153   0.095325 )
Epeak [keV] : 290.011      ( -336.053 -336.07 )
Norm@50keV  : 4.59778E-03    ( -0.000320224   0.00132242 )
------------------------------------------------------------
#Fit statistic : Chi-Squared =          43.33 using 59 PHA bins.
# Reduced chi-squared =         0.7738 for     56 degrees of freedom
# Null hypothesis probability =   8.919654e-01

Photon flux (15-150 keV)    in 109.5 sec: 0.596608 ( -0.024666  0.019999 ) ph/cm2/s
Energy fluence (15-150 keV)             : 4.38602e-06 ( -1.61096e-07  1.55829e-07 ) ergs/cm2
Band function

Time interval is from   -2.948 sec. to  106.536 sec.

Spectral model in the Band function:
------------------------------------------------------------
Parameters  : value       lower 90%   higher 90%
alpha       : -1.36211   ( 1.37557   1.37557 )
beta        : -1.79926    ( -1.30795   0.0756659 )
Epeak [keV] : 46.9693      ( -49.1298 -49.1298 )
Norm@50keV   : 8.22165E-03    ( -0.0033982   0 )
------------------------------------------------------------
#Fit statistic : Chi-Squared =          43.17 using 59 PHA bins.
# Reduced chi-squared =         0.7849 for     55 degrees of freedom
# Null hypothesis probability =   8.761150e-01

Photon flux (15-150 keV)    in 109.5 sec:  (    ) ph/cm2/s
Energy fluence (15-150 keV)             : 0 ( 0  0 ) ergs/cm2
Single BB

Spectral model blackbody:
------------------------------------------------------------
Parameters  : value    Lower 90%  Upper 90%
kT [keV]    : 13.4339  (  )
R^2/D10^2   : 8.79874E-02  (   )
(R is the radius in km and D10 is the distance to the source in units of 10 kpc)
------------------------------------------------------------
#Fit statistic : Chi-Squared =         319.76 using 59 PHA bins.
# Reduced chi-squared =         5.6098 for     57 degrees of freedom
# Null hypothesis probability =   3.109093e-38

Energy  Fluence     90% Error
[keV]   [erg/cm2]   [erg/cm2]
15- 25  3.684e-07   2.146e-08
25- 50  1.314e-06   5.092e-08
50-150  1.527e-06   9.965e-08
15-150  3.209e-06   1.040e-07
Thermal bremsstrahlung (OTTB)

Spectral model: thermal bremsstrahlung
------------------------------------------------------------
Parameters  : value         Lower 90%    Upper 90%
kT [keV]    : 127.578       (-20.5753      17.7897)
Norm        : 2.41581       (-0.0927196     0.138597)
------------------------------------------------------------
#Fit statistic : Chi-Squared =          53.70 using 59 PHA bins.
# Reduced chi-squared =         0.9421 for     57 degrees of freedom
# Null hypothesis probability =   5.996312e-01

Energy  Fluence     90% Error
[keV]   [erg/cm2]   [erg/cm2]
15- 25  6.870e-07   4.358e-08
25- 50  1.242e-06   6.132e-08
50-150  2.283e-06   5.382e-07
15-150  4.212e-06   5.639e-07
Double BB

Spectral model: bbodyrad<1> + bbodyrad<2>
------------------------------------------------------------
Parameters  : value         Lower 90%    Upper 90%
kT1 [keV]   : 6.65272        (-0.653872      0.689785)
R1^2/D10^2  : 0.840411        (-0.253081      0.403326)
kT2 [keV]   : 25.0074        (-2.59554      3.40093)
R2^2/D10^2  : 7.15654E-03    (-0.00266888   0.00367469)
------------------------------------------------------------
#Fit statistic : Chi-Squared =          51.95 using 59 PHA bins.
# Reduced chi-squared =         0.9445 for     55 degrees of freedom
# Null hypothesis probability =   5.920869e-01

Energy  Fluence     90% Error
[keV]   [erg/cm2]   [erg/cm2]
15- 25  7.038e-07   7.304e-08
25- 50  1.249e-06   7.446e-08
50-150  2.345e-06   2.458e-07
15-150  4.298e-06   3.526e-07
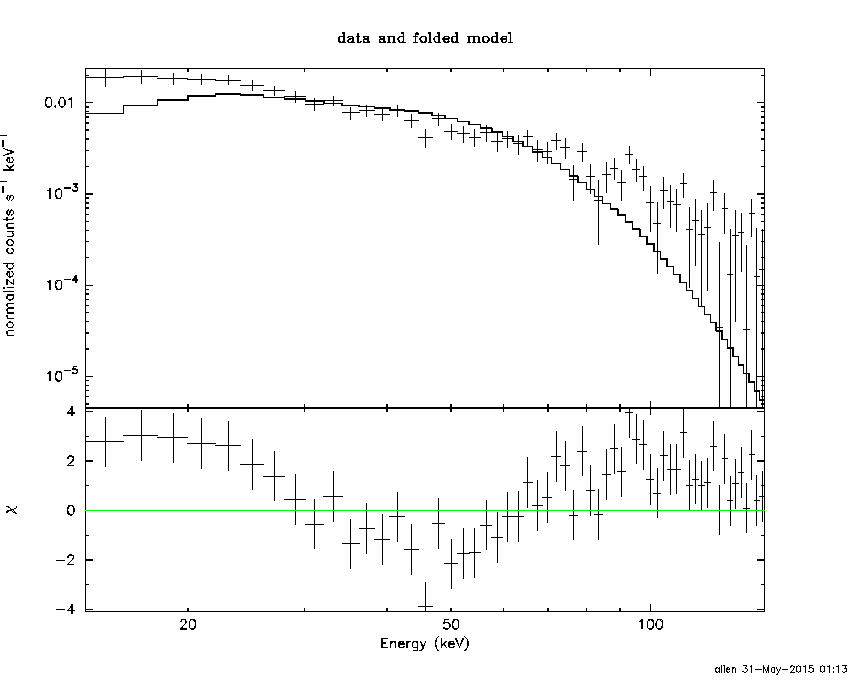
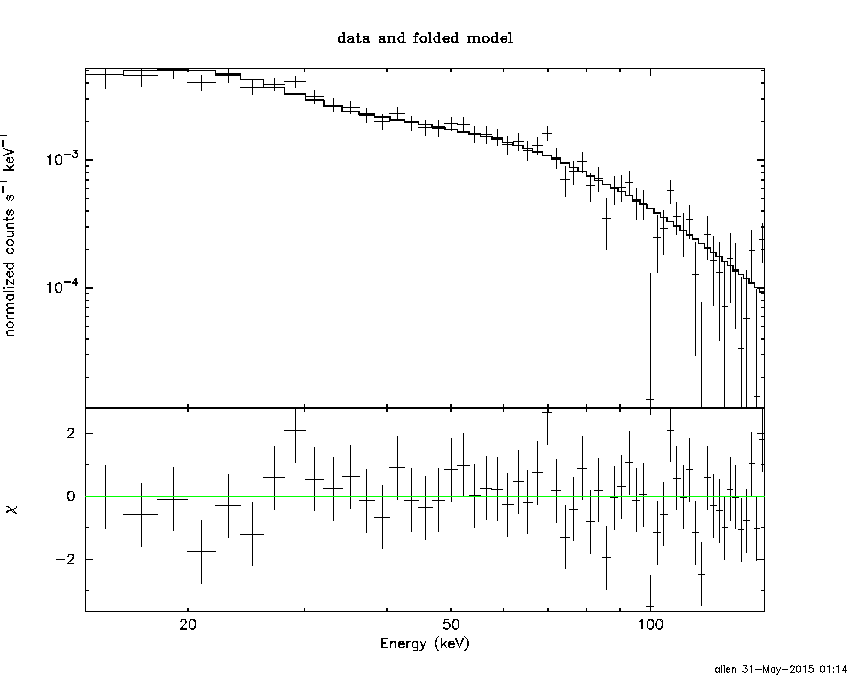
Peak spectrum fit
Power-law model

Time interval is from   87.088 sec. to   88.088 sec.

Spectral model in power-law:
------------------------------------------------------------
Parameters  : value       lower 90%   higher 90%
Photon index: 1.71435     ( -0.0865982   0.0877074 )
Norm@50keV  : 3.39026E-02    ( -0.00168576   0.00167608 )
------------------------------------------------------------
#Fit statistic : Chi-Squared =          46.72 using 59 PHA bins.
# Reduced chi-squared =         0.8196 for     57 degrees of freedom
# Null hypothesis probability =   8.326569e-01

Photon flux (15-150 keV)    in 1 sec: 4.52545 ( -0.218132  0.218613 ) ph/cm2/s
Energy fluence (15-150 keV)             : 3.13556e-07 ( -1.631e-08  1.63886e-08 ) ergs/cm2
Cutoff power-law model

Time interval is from   87.088 sec. to   88.088 sec.
Spectral model in the cutoff power-law:
------------------------------------------------------------
Parameters  : value       lower 90%   higher 90%
Photon index: 1.70180     ( -0.317854   0.339675 )
Epeak [keV] : 996.870      ( -908.258 -997.648 )
Norm@50keV  : 3.44828E-02    ( -0.00614478   0.015051 )
------------------------------------------------------------
#Fit statistic : Chi-Squared =          46.71 using 59 PHA bins.
# Reduced chi-squared =         0.8342 for     56 degrees of freedom
# Null hypothesis probability =   8.070937e-01

Photon flux (15-150 keV)    in 1 sec: 4.52020 ( -0.21476  0.221 ) ph/cm2/s
Energy fluence (15-150 keV)             : 3.14019e-07 ( -1.8679e-08  1.5867e-08 ) ergs/cm2
Band function

Time interval is from   87.088 sec. to   88.088 sec.

Spectral model in the Band function:
------------------------------------------------------------
Parameters  : value       lower 90%   higher 90%
alpha       : -1.16981   ( 1.16213   1.16213 )
beta        : -1.74960    ( 1.74959   0.113035 )
Epeak [keV] : 46.3041      ( -45.4655 -45.4655 )
Norm@50keV   : 7.84546E-02    ( -0.0493269   0 )
------------------------------------------------------------
#Fit statistic : Chi-Squared =          46.19 using 59 PHA bins.
# Reduced chi-squared =         0.8398 for     55 degrees of freedom
# Null hypothesis probability =   7.952881e-01

Photon flux (15-150 keV)    in 1 sec:  (    ) ph/cm2/s
Energy fluence (15-150 keV)             : 0 ( 0  0 ) ergs/cm2
Single BB
Spectral model blackbody:
------------------------------------------------------------
Parameters  : value    Lower 90%  Upper 90%
kT [keV]    : 12.9259  (  )
R^2/D10^2   : 0.802340  (   )
(R is the radius in km and D10 is the distance to the source in units of 10 kpc)
------------------------------------------------------------
#Fit statistic : Chi-Squared =         185.38 using 59 PHA bins.
# Reduced chi-squared =         3.2522 for     57 degrees of freedom
# Null hypothesis probability =   1.701210e-15

Energy  Fluence     90% Error
[keV]   [erg/cm2]   [erg/cm2]
15- 25  2.843e-08   2.455e-09
25- 50  9.732e-08   5.250e-09
50-150  1.025e-07   1.079e-08
15-150  2.282e-07   1.325e-08
Thermal bremsstrahlung (OTTB)
Spectral model: thermal bremsstrahlung
------------------------------------------------------------
Parameters  : value         Lower 90%    Upper 90%
kT [keV]    : 139.283       (      )
Norm        : 18.5910       (-1.04534     1.29046)
------------------------------------------------------------
#Fit statistic : Chi-Squared =          51.31 using 59 PHA bins.
# Reduced chi-squared =         0.9002 for     57 degrees of freedom
# Null hypothesis probability =   6.874983e-01

Energy  Fluence     90% Error
[keV]   [erg/cm2]   [erg/cm2]
15- 25  4.734e-08   3.365e-09
25- 50  8.719e-08   7.130e-09
50-150  1.690e-07   4.913e-08
15-150  3.035e-07   5.305e-08
Double BB
Spectral model: bbodyrad<1> + bbodyrad<2>
------------------------------------------------------------
Parameters  : value         Lower 90%    Upper 90%
kT1 [keV]   : 6.75020        (-0.834354      0.894181)
R1^2/D10^2  : 6.26731        (-2.22475      3.90335)
kT2 [keV]   : 27.2593        (-4.03063      5.94552)
R2^2/D10^2  : 4.25338E-02    (-0.0209989   0.0337525)
------------------------------------------------------------
#Fit statistic : Chi-Squared =          47.13 using 59 PHA bins.
# Reduced chi-squared =         0.8569 for     55 degrees of freedom
# Null hypothesis probability =   7.658585e-01

Energy  Fluence     90% Error
[keV]   [erg/cm2]   [erg/cm2]
15- 25  4.934e-08   7.450e-09
25- 50  8.721e-08   9.685e-09
50-150  1.759e-07   3.040e-08
15-150  3.124e-07   4.365e-08
Pre-slew spectrum (Pre-slew PHA with pre-slew DRM)
Power-law model
Spectral model in power-law:
------------------------------------------------------------
Parameters  : value       lower 90%   higher 90%
Photon index: 1.54740     ( -0.0698039   0.070066 )
Norm@50keV  : 1.14917E-02    ( -0.000444111   0.000443669 )
------------------------------------------------------------
#Fit statistic : Chi-Squared =          65.63 using 59 PHA bins.
# Reduced chi-squared =          1.151 for     57 degrees of freedom
# Null hypothesis probability =   2.025261e-01

Photon flux (15-150 keV)    in 13.9 sec: 1.45369 ( -0.0589041  0.0590339 ) ph/cm2/s
Energy fluence (15-150 keV)             : 1.50433e-06 ( -6.22709e-08  6.24517e-08 ) ergs/cm2
Cutoff power-law model

Spectral model in the cutoff power-law:
------------------------------------------------------------
Parameters  : value       lower 90%   higher 90%
Photon index: 1.19572     ( -0.298981   0.280269 )
Epeak [keV] : 119.177      ( -32.5084 229.786 )
Norm@50keV  : 1.69931E-02    ( -0.00445246   0.00652043 )
------------------------------------------------------------
#Fit statistic : Chi-Squared =          60.98 using 59 PHA bins.
# Reduced chi-squared =          1.089 for     56 degrees of freedom
# Null hypothesis probability =   3.014606e-01

Photon flux (15-150 keV)    in 13.9 sec: 1.42220 ( -0.06357  0.06374 ) ph/cm2/s
Energy fluence (15-150 keV)             : 1.46721e-06 ( -6.97363e-08  6.93749e-08 ) ergs/cm2
Band function

Spectral model in the Band function:
------------------------------------------------------------
Parameters  : value       lower 90%   higher 90%
alpha       : -1.13995   ( -0.324584   2.15767 )
beta        : -1.85604    ( 1.85608   0.296597 )
Epeak [keV] : 106.135      ( -72.5468 203.943 )
Norm@50keV   : 1.82613E-02    ( -0.00530351   0.608329 )
------------------------------------------------------------
#Fit statistic : Chi-Squared =          60.77 using 59 PHA bins.
# Reduced chi-squared =          1.105 for     55 degrees of freedom
# Null hypothesis probability =   2.759883e-01

Photon flux (15-150 keV)    in 13.9 sec:  (    ) ph/cm2/s
Energy fluence (15-150 keV)             : 0 ( 0  0 ) ergs/cm2
S(25-50 keV) vs. S(50-100 keV) plot

S(25-50 keV)  = 1.23e-06
S(50-100 keV) = 1.43e-06
T90 vs. Hardness ratio plot

T90                                   = 97.6999999880791 sec.
Hardness ratio (energy fluence ratio) = 1.1626
Color vs. Color plot

Count Ratio  (25-50 keV) / (15-25 keV) = 1.13006
Count Ratio (50-100 keV) / (15-25 keV) = 0.713994
Mask shadow pattern
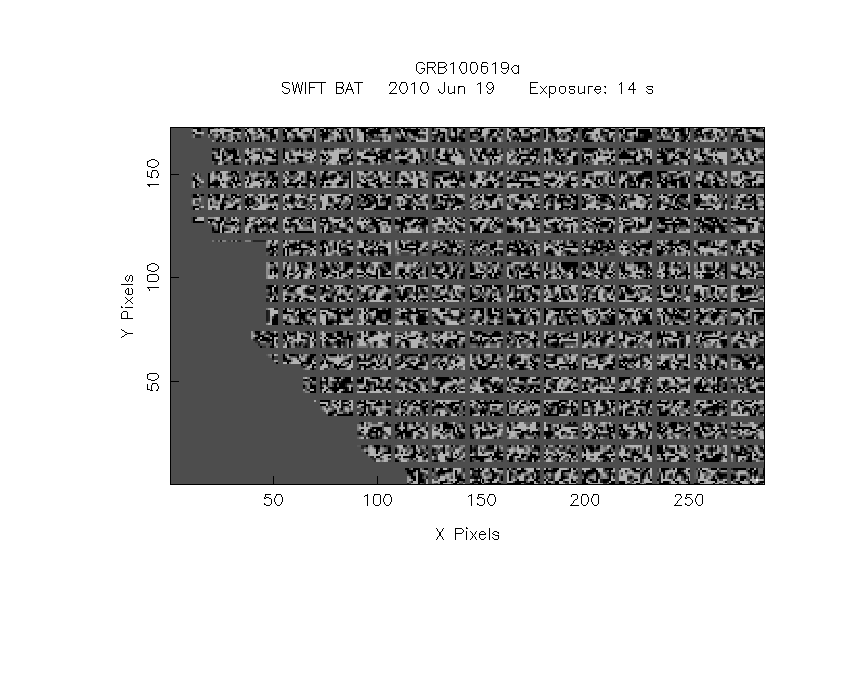
IMX = -6.138684640147498E-01, IMY = -2.175451350063735E-02
TIME vs. PHA plot around the trigger time

Blue+Cyan dotted lines: Time interval of the scaled map
From 0.000000 to 0.256000
TIME vs. DetID plot around the trigger time

Blue+Cyan dotted lines: Time interval of the scaled map
From 0.000000 to 0.256000
100 us light curve (15-350 keV)

Blue+Cyan dotted lines: Time interval of the scaled map
From 0.000000 to 0.256000
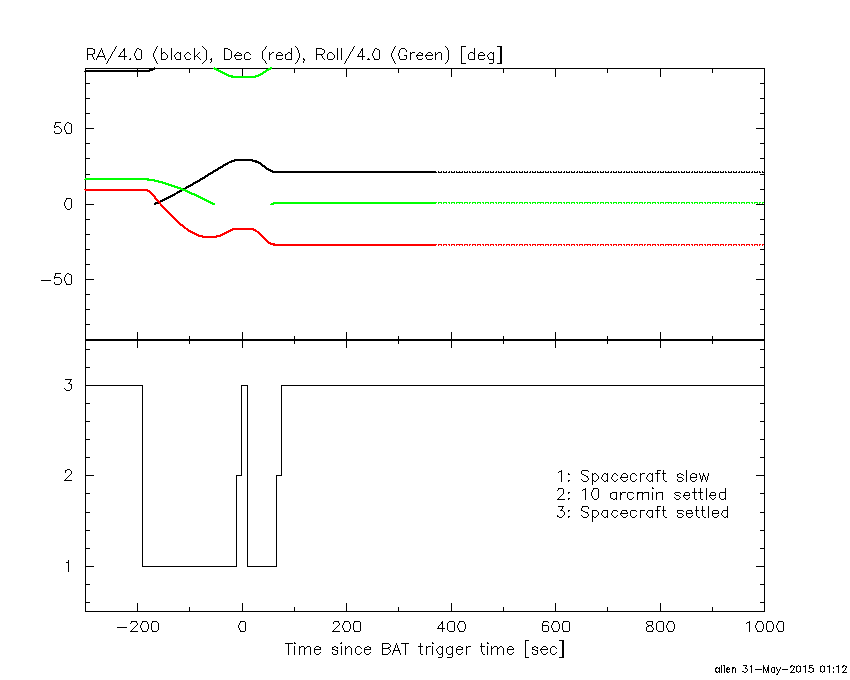
Spacecraft aspect plot
Bright source in the pre-burst/pre-slew/post-slew images
Pre-burst image of 15-350 keV band
Time interval of the image:
-11.051400 -2.948000

# RAcent  DECcent POSerr Theta    Phi  PeakCts   SNR AngSep     Name
#  [deg]    [deg]    ['] [deg]  [deg]                   [']
135.6770 -40.5569    8.6  29.5   83.3   0.0673   1.3    6.8	Vela X-1
 81.8756 -57.6726    2.3  48.9  137.5   0.7317   5.1 ------	UNKNOWN
161.1026 -32.6147    2.4  43.4   54.3   0.6483   4.8 ------	UNKNOWN
152.6768  20.1203    2.0  50.7  -20.7   0.4084   5.6 ------	UNKNOWN
 79.2753  -5.5602    2.9  38.1 -144.4   0.1655   3.9 ------	UNKNOWN
Pre-slew background subtracted image of 15-350 keV band
Time interval of the image:
-2.948000 10.948590

# RAcent  DECcent POSerr Theta    Phi  PeakCts   SNR AngSep     Name
#  [deg]    [deg]    ['] [deg]  [deg]                   [']
135.5892 -40.5432    5.8  29.5   83.4   0.2353   2.0    2.9	Vela X-1
 59.9041 -42.7913    2.3  54.8  162.2   1.9801   5.1 ------	UNKNOWN
158.6146 -12.8933    2.5  40.7   24.8   0.6508   4.6 ------	UNKNOWN
 91.8397 -38.3786    2.2  31.1  153.1   0.4817   5.1 ------	UNKNOWN
 55.7131 -30.3470    2.0  57.1  177.5   2.3629   5.8 ------	UNKNOWN
 84.6177 -27.0119    0.4  31.6  178.0   2.5168  30.2 ------	UNKNOWN
Post-slew image of 15-350 keV band
Time interval of the image:
65.548600 962.918100

# RAcent  DECcent POSerr Theta    Phi  PeakCts   SNR AngSep     Name
#  [deg]    [deg]    ['] [deg]  [deg]                   [']
135.5251 -40.5526    1.3  43.8   28.4  10.5149   9.1    0.2	Vela X-1
 27.5524 -15.2249    4.7  54.1  177.1   5.2862   2.5 ------	UNKNOWN
 55.7579 -26.1100    2.9  25.8  172.2   2.0768   4.0 ------	UNKNOWN
 84.6149 -27.0037    1.0   0.0 -152.6   6.0982  11.6 ------	UNKNOWN
133.5455   3.6573    4.8  56.3  -28.4   7.9200   2.4 ------	UNKNOWN
Plot creation:
Sun May 31 01:15:00 EDT 2015