Special notes of this burst
Image
Pre-slew 15.0-350.0 keV image (Event data)

#   RAcent    DECcent   POSerr    Theta     Phi              Peak Cts       SNR   Name
   15.7953   -39.0919   0.0068     2.0795   -17.4411         0.3202201     28.341 TRIG_00425647

Foreground time interval of the image:
 -0.068   0.328 (delta_t =   0.396 [sec])
Background time interval of the image:
-239.304  -0.068 (delta_t = 239.236 [sec])
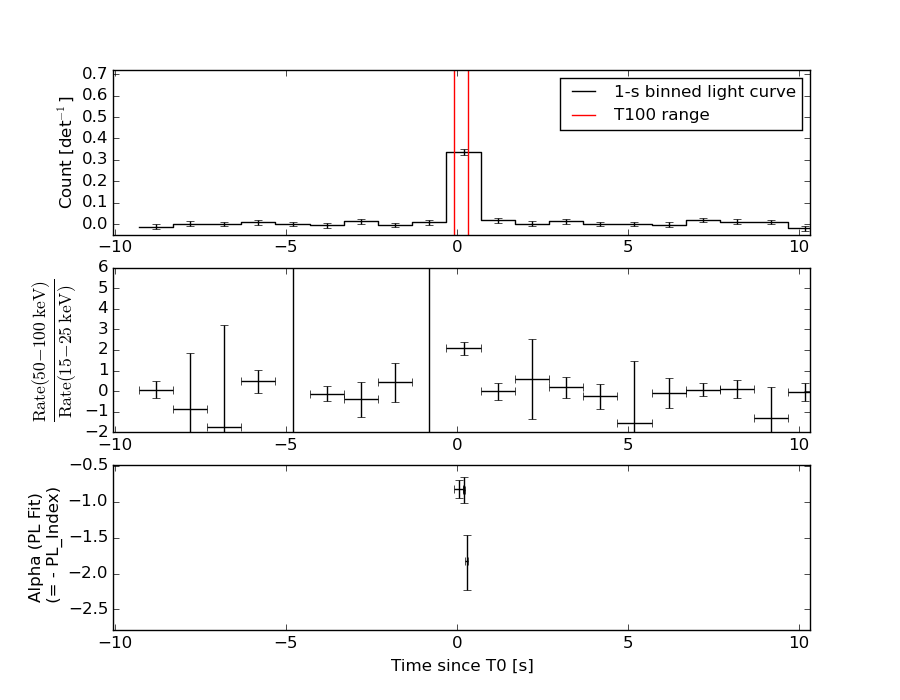
Lightcurves
Notes:
- 1) The mask-weighted light curves are using the flight position.
- 2) Multiple plots of different time binning/intervals are shown to cover all scenarios of short/long GRBs, rate/image triggers, and real/false positives.
- 3) For all the mask-weighted lightcurves, the y-axis units are counts/sec/det where a det is 0.4 x 0.4 = 0.16 sq cm.
- 4) The verticle lines correspond to following: green dotted lines are T50 interval, black dotted lines are T90 interval, blue solid line(s) is a spacecraft slew start time, and orange solid line(s) is a spacecraft slew end time.
- 5) Time of each bin is in the middle of the bin.
1 s binning
From T0-310 s to T0+310 s

From T100_start - 20 s to T100_end + 30 s

Full time interval

64 ms binning
Full time interval

From T100_start to T100_end

From T0-5 sec to T0+5 sec

16 ms binning
From T100_start-5 s to T100_start+5 s

Blue+Cyan dotted lines: Time interval of the scaled map
From 0.000000 to 0.256000
8 ms binning
From T100_start-3 s to T100_start+3 s

Blue+Cyan dotted lines: Time interval of the scaled map
From 0.000000 to 0.256000
2 ms binning
From T100_start-1 s to T100_start+1 s

Blue+Cyan dotted lines: Time interval of the scaled map
From 0.000000 to 0.256000
SN=5 or 10 sec. binning (whichever binning is satisfied first)

SN=5 or 10 sec. binning (T < 200 sec)

Quad-rate summed light curves (from T0-300s to T0+1000s)

The mask-weighted light curves based on cleaned DPHs

Spectral Evolution
Spectra
Notes:
- 1) The fitting includes the systematic errors.
- 2) When the burst includes telescope slew time periods, the fitting uses an average response file made from multiple 5-s response files through out the slew time plus single time preiod for the non-slew times, and weighted by the total counts in the corresponding time period using addrmf. An average response file is needed becuase a spectral fit using the pre-slew DRM will introduce some errors in both a spectral shape and a normalization if the PHA file contains a lot of the slew/post-slew time interval.
- 3) For fits to more complicated models (e.g. a power-law over a cutoff power-law), the BAT team has decided to require a chi-square improvement of more than 6 for each extra dof.
Time averaged spectrum fit using the average DRM
Power-law model

Time interval is from   -0.068 sec. to    0.328 sec.

Spectral model in power-law:
------------------------------------------------------------
Parameters  : value       lower 90%   higher 90%
Photon index: 0.889202     ( -0.103162   0.101956 )
Norm@50keV  : 5.23686E-02    ( -0.00299319   0.00298501 )
------------------------------------------------------------
#Fit statistic : Chi-Squared =          73.71 using 59 PHA bins.
# Reduced chi-squared =          1.293 for     57 degrees of freedom
# Null hypothesis probability =   6.745055e-02

Photon flux (15-150 keV)    in 0.396 sec: 6.01032 ( -0.34311  0.343334 ) ph/cm2/s
Energy fluence (15-150 keV)             : 2.33719e-07 ( -1.49761e-08  1.50479e-08 ) ergs/cm2
Cutoff power-law model

Time interval is from   -0.068 sec. to    0.328 sec.
Spectral model in the cutoff power-law:
------------------------------------------------------------
Parameters  : value       lower 90%   higher 90%
Photon index: 0.724476     ( -0.427077   0.211145 )
Epeak [keV] : 446.618      ( -446.622 -446.622 )
Norm@50keV  : 6.19738E-02    ( -0.0119018   0.0326322 )
------------------------------------------------------------
#Fit statistic : Chi-Squared =          73.21 using 59 PHA bins.
# Reduced chi-squared =          1.307 for     56 degrees of freedom
# Null hypothesis probability =   6.105317e-02

Photon flux (15-150 keV)    in 0.396 sec: 5.96909 ( -0.35712  0.35642 ) ph/cm2/s
Energy fluence (15-150 keV)             : 2.31741e-07 ( -1.60637e-08  1.58772e-08 ) ergs/cm2
Band function

Time interval is from   -0.068 sec. to    0.328 sec.

Spectral model in the Band function:
------------------------------------------------------------
Parameters  : value       lower 90%   higher 90%
alpha       : -0.909498   ( 0.909324   0.909324 )
beta        : -0.889204    ( -0.101931   0.103257 )
Epeak [keV] : 13.6521      ( -13.6545 -13.6545 )
Norm@50keV   : 7.75303E-02    ( -0.0278294   1.53553e+06 )
------------------------------------------------------------
#Fit statistic : Chi-Squared =          73.71 using 59 PHA bins.
# Reduced chi-squared =          1.340 for     55 degrees of freedom
# Null hypothesis probability =   4.684163e-02

Photon flux (15-150 keV)    in 0.396 sec:  (    ) ph/cm2/s
Energy fluence (15-150 keV)             : 0 ( 0  0 ) ergs/cm2
Single BB

Spectral model blackbody:
------------------------------------------------------------
Parameters  : value    Lower 90%  Upper 90%
kT [keV]    : 22.8161  (  )
R^2/D10^2   : 0.195747  (   )
(R is the radius in km and D10 is the distance to the source in units of 10 kpc)
------------------------------------------------------------
#Fit statistic : Chi-Squared =         117.65 using 59 PHA bins.
# Reduced chi-squared =         2.0640 for     57 degrees of freedom
# Null hypothesis probability =   4.170331e-06

Energy  Fluence     90% Error
[keV]   [erg/cm2]   [erg/cm2]
15- 25  7.341e-09   8.336e-10
25- 50  3.965e-08   3.269e-09
50-150  1.542e-07   1.477e-08
15-150  2.012e-07   1.439e-08
Thermal bremsstrahlung (OTTB)

Spectral model: thermal bremsstrahlung
------------------------------------------------------------
Parameters  : value         Lower 90%    Upper 90%
kT [keV]    : 199.362       (      )
Norm        : 23.2936       (     )
------------------------------------------------------------
#Fit statistic : Chi-Squared =         179.78 using 59 PHA bins.
# Reduced chi-squared =         3.1540 for     57 degrees of freedom
# Null hypothesis probability =   1.219036e-14

Energy  Fluence     90% Error
[keV]   [erg/cm2]   [erg/cm2]
15- 25  2.297e-08   1.552e-09
25- 50  4.419e-08   3.901e-09
50-150  9.691e-08   2.293e-08
15-150  1.641e-07   3.010e-08
Double BB

Spectral model: bbodyrad<1> + bbodyrad<2>
------------------------------------------------------------
Parameters  : value         Lower 90%    Upper 90%
kT1 [keV]   : 11.2877        (-2.73455      3.05639)
R1^2/D10^2  : 1.00204        (-0.434637      1.04005)
kT2 [keV]   : 50.9472        (-16.0838      92.5588)
R2^2/D10^2  : 1.54736E-02    (-0.0129726   0.0205248)
------------------------------------------------------------
#Fit statistic : Chi-Squared =          72.90 using 59 PHA bins.
# Reduced chi-squared =          1.326 for     55 degrees of freedom
# Null hypothesis probability =   5.341573e-02

Energy  Fluence     90% Error
[keV]   [erg/cm2]   [erg/cm2]
15- 25  1.232e-08   3.253e-09
25- 50  4.343e-08   1.082e-08
50-150  1.773e-07   7.801e-08
15-150  2.331e-07   8.522e-08
Peak spectrum fit
Power-law model

Time interval is from   -0.368 sec. to    0.632 sec.

Spectral model in power-law:
------------------------------------------------------------
Parameters  : value       lower 90%   higher 90%
Photon index: 0.922313     ( -0.120325   0.11804 )
Norm@50keV  : 2.23604E-02    ( -0.00147295   0.00146815 )
------------------------------------------------------------
#Fit statistic : Chi-Squared =          80.54 using 59 PHA bins.
# Reduced chi-squared =          1.413 for     57 degrees of freedom
# Null hypothesis probability =   2.175967e-02

Photon flux (15-150 keV)    in 1 sec: 2.56725 ( -0.169953  0.170261 ) ph/cm2/s
Energy fluence (15-150 keV)             : 2.48799e-07 ( -1.7671e-08  1.7771e-08 ) ergs/cm2
Cutoff power-law model

Time interval is from   -0.368 sec. to    0.632 sec.
Spectral model in the cutoff power-law:
------------------------------------------------------------
Parameters  : value       lower 90%   higher 90%
Photon index: 0.735549     ( -0.486473   0.241187 )
Epeak [keV] : 391.392      ( -391.397 -391.397 )
Norm@50keV  : 2.70214E-02    ( -0.00581057   0.0164712 )
------------------------------------------------------------
#Fit statistic : Chi-Squared =          80.03 using 59 PHA bins.
# Reduced chi-squared =          1.429 for     56 degrees of freedom
# Null hypothesis probability =   1.923312e-02

Photon flux (15-150 keV)    in 1 sec: 2.54422 ( -0.17824  0.17826 ) ph/cm2/s
Energy fluence (15-150 keV)             : 2.46237e-07 ( -1.9144e-08  1.8884e-08 ) ergs/cm2
Band function

Time interval is from   -0.368 sec. to    0.632 sec.

Spectral model in the Band function:
------------------------------------------------------------
Parameters  : value       lower 90%   higher 90%
alpha       : 4.99998   ( -4.99998   -4.99998 )
beta        : -1.04149    ( -0.185053   0.145335 )
Epeak [keV] : 34.6462      ( -34.6462 5.87458 )
Norm@50keV   : 220.245    ( -14.1137   3.41026e+06 )
------------------------------------------------------------
#Fit statistic : Chi-Squared =          78.69 using 59 PHA bins.
# Reduced chi-squared =          1.431 for     55 degrees of freedom
# Null hypothesis probability =   1.975444e-02

Photon flux (15-150 keV)    in 1 sec:  (    ) ph/cm2/s
Energy fluence (15-150 keV)             : 0 ( 0  0 ) ergs/cm2
Single BB

Spectral model blackbody:
------------------------------------------------------------
Parameters  : value    Lower 90%  Upper 90%
kT [keV]    : 22.8651  (  )
R^2/D10^2   : 8.15622E-02  (   )
(R is the radius in km and D10 is the distance to the source in units of 10 kpc)
------------------------------------------------------------
#Fit statistic : Chi-Squared =         115.48 using 59 PHA bins.
# Reduced chi-squared =         2.0260 for     57 degrees of freedom
# Null hypothesis probability =   7.501045e-06

Energy  Fluence     90% Error
[keV]   [erg/cm2]   [erg/cm2]
15- 25  7.750e-09   1.087e-09
25- 50  4.191e-08   4.320e-09
50-150  1.637e-07   1.850e-08
15-150  2.133e-07   1.940e-08
Thermal bremsstrahlung (OTTB)

Spectral model: thermal bremsstrahlung
------------------------------------------------------------
Parameters  : value         Lower 90%    Upper 90%
kT [keV]    : 199.363       (      )
Norm        : 10.3370       (     )
------------------------------------------------------------
#Fit statistic : Chi-Squared =         154.93 using 59 PHA bins.
# Reduced chi-squared =         2.7181 for     57 degrees of freedom
# Null hypothesis probability =   5.433722e-11

Energy  Fluence     90% Error
[keV]   [erg/cm2]   [erg/cm2]
15- 25  2.574e-08   2.030e-09
25- 50  4.951e-08   6.805e-09
50-150  1.086e-07   3.325e-08
15-150  1.838e-07   4.510e-08
Double BB

Spectral model: bbodyrad<1> + bbodyrad<2>
------------------------------------------------------------
Parameters  : value         Lower 90%    Upper 90%
kT1 [keV]   : 10.7608        (-2.2878      2.79678)
R1^2/D10^2  : 0.509808        (-0.229819      0.473508)
kT2 [keV]   : 49.1139        (-14.6402      62.4056)
R2^2/D10^2  : 7.11892E-03    (-0.0055398   0.0101759)
------------------------------------------------------------
#Fit statistic : Chi-Squared =          76.18 using 59 PHA bins.
# Reduced chi-squared =          1.385 for     55 degrees of freedom
# Null hypothesis probability =   3.085996e-02

Energy  Fluence     90% Error
[keV]   [erg/cm2]   [erg/cm2]
15- 25  1.418e-08   4.964e-09
25- 50  4.742e-08   1.618e-08
50-150  1.860e-07   8.397e-08
15-150  2.476e-07   1.002e-07
Pre-slew spectrum (Pre-slew PHA with pre-slew DRM)
Power-law model

Spectral model in power-law:
------------------------------------------------------------
Parameters  : value       lower 90%   higher 90%
Photon index: 0.889202     ( -0.103162   0.101956 )
Norm@50keV  : 5.23686E-02    ( -0.00299319   0.00298501 )
------------------------------------------------------------
#Fit statistic : Chi-Squared =          73.71 using 59 PHA bins.
# Reduced chi-squared =          1.293 for     57 degrees of freedom
# Null hypothesis probability =   6.745055e-02

Photon flux (15-150 keV)    in 0.396 sec: 6.01032 ( -0.34311  0.343334 ) ph/cm2/s
Energy fluence (15-150 keV)             : 2.33719e-07 ( -1.49761e-08  1.50479e-08 ) ergs/cm2
Cutoff power-law model
Spectral model in the cutoff power-law:
------------------------------------------------------------
Parameters  : value       lower 90%   higher 90%
Photon index: 0.724476     ( -0.427077   0.211145 )
Epeak [keV] : 446.618      ( -446.622 -446.622 )
Norm@50keV  : 6.19738E-02    ( -0.0119018   0.0326322 )
------------------------------------------------------------
#Fit statistic : Chi-Squared =          73.21 using 59 PHA bins.
# Reduced chi-squared =          1.307 for     56 degrees of freedom
# Null hypothesis probability =   6.105317e-02

Photon flux (15-150 keV)    in 0.396 sec: 5.96909 ( -0.35712  0.35642 ) ph/cm2/s
Energy fluence (15-150 keV)             : 2.31741e-07 ( -1.60637e-08  1.58772e-08 ) ergs/cm2
Band function
Spectral model in the Band function:
------------------------------------------------------------
Parameters  : value       lower 90%   higher 90%
alpha       : -0.909498   ( 0.909324   0.909324 )
beta        : -0.889204    ( -0.101931   0.103257 )
Epeak [keV] : 13.6521      ( -13.6545 -13.6545 )
Norm@50keV   : 7.75303E-02    ( -0.0278294   1.53553e+06 )
------------------------------------------------------------
#Fit statistic : Chi-Squared =          73.71 using 59 PHA bins.
# Reduced chi-squared =          1.340 for     55 degrees of freedom
# Null hypothesis probability =   4.684163e-02

Photon flux (15-150 keV)    in 0.396 sec:  (    ) ph/cm2/s
Energy fluence (15-150 keV)             : 0 ( 0  0 ) ergs/cm2
S(25-50 keV) vs. S(50-100 keV) plot

S(25-50 keV)  = 4.01e-08
S(50-100 keV) = 8.67e-08
T90 vs. Hardness ratio plot

T90                                   = 0.331999957561493 sec.
Hardness ratio (energy fluence ratio) = 2.16209
Color vs. Color plot

Count Ratio  (25-50 keV) / (15-25 keV) = 1.91926
Count Ratio (50-100 keV) / (15-25 keV) = 2.10783
Mask shadow pattern

IMX = 3.464113287164557E-02, IMY = 1.088317170812843E-02
TIME vs. PHA plot around the trigger time

Blue+Cyan dotted lines: Time interval of the scaled map
From 0.000000 to 0.256000
TIME vs. DetID plot around the trigger time

Blue+Cyan dotted lines: Time interval of the scaled map
From 0.000000 to 0.256000
100 us light curve (15-350 keV)

Blue+Cyan dotted lines: Time interval of the scaled map
From 0.000000 to 0.256000
Spacecraft aspect plot
Bright source in the pre-burst/pre-slew/post-slew images
Pre-burst image of 15-350 keV band
Time interval of the image:
-239.304000 -0.068000

# RAcent  DECcent POSerr Theta    Phi  PeakCts   SNR AngSep     Name
#  [deg]    [deg]    ['] [deg]  [deg]                   [']
 17.5768 -35.6480    2.4   3.7  -92.6   1.0123   4.8 ------	UNKNOWN
Pre-slew background subtracted image of 15-350 keV band
Time interval of the image:
-0.068000 0.328000

# RAcent  DECcent POSerr Theta    Phi  PeakCts   SNR AngSep     Name
#  [deg]    [deg]    ['] [deg]  [deg]                   [']
 15.7953 -39.0919    0.4   2.1  -17.4   0.3202  28.3 ------	UNKNOWN
 45.6624  -8.7600    2.2  40.8  -96.4   0.2425   5.3 ------	UNKNOWN
Post-slew image of 15-350 keV band
Time interval of the image:
32.596600 722.966000

# RAcent  DECcent POSerr Theta    Phi  PeakCts   SNR AngSep     Name
#  [deg]    [deg]    ['] [deg]  [deg]                   [']
331.8588 -33.3268    3.2  35.6  110.7   2.7331   3.6 ------	UNKNOWN
346.1289 -71.5044    2.0  35.7   40.9   3.0860   5.7 ------	UNKNOWN
  5.4003  19.1346    3.7  59.0 -166.2   6.9233   3.1 ------	UNKNOWN
 24.1353  15.6601    5.0  55.3 -144.9   4.7895   2.3 ------	UNKNOWN
Plot creation:
Sun May 31 01:10:35 EDT 2015