Click here for the BAT GCN circular template
Image
Pre-slew 15.0-350.0 keV image (Event data)
#   RAcent    DECcent   POSerr    Theta     Phi              Peak Cts       SNR   Name
  166.4659   -26.6663   0.0081    30.6737  -157.7026         1.2077689     23.685 TRIG_00429954

Foreground time interval of the image:
 -6.560  15.069 (delta_t =  21.629 [sec])
Background time interval of the image:
-239.432  -6.560 (delta_t = 232.872 [sec])
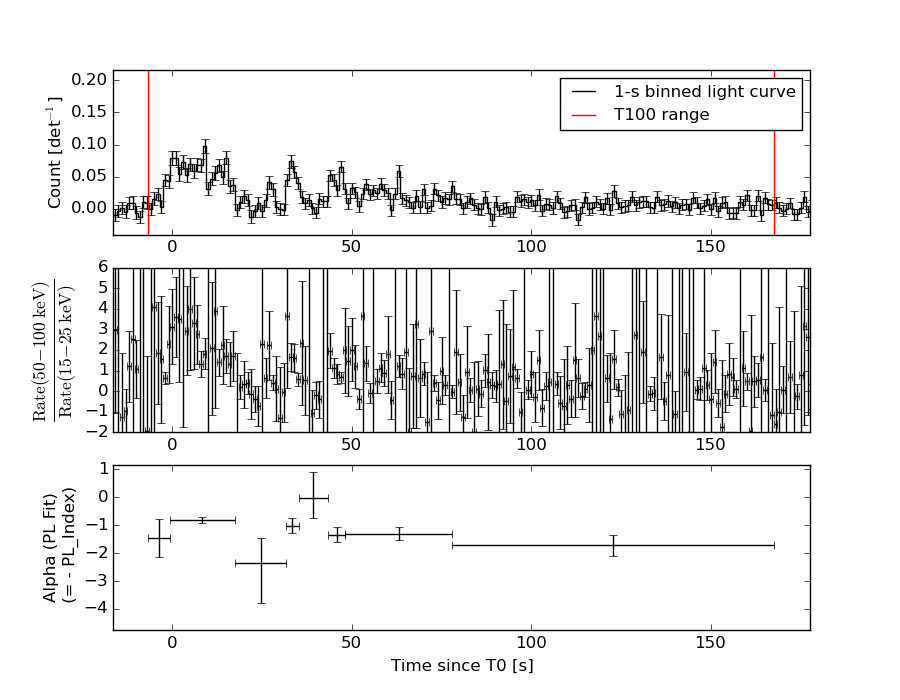
Lightcurves
Notes:
- 1) The mask-weighted light curves are using the flight position.
- 2) Multiple plots of different time binning/intervals are shown to cover all scenarios of short/long GRBs, rate/image triggers, and real/false positives.
- 3) For all the mask-weighted lightcurves, the y-axis units are counts/sec/det where a det is 0.4 x 0.4 = 0.16 sq cm.
- 4) The verticle lines correspond to following: green dotted lines are T50 interval, black dotted lines are T90 interval, blue solid line(s) is a spacecraft slew start time, and orange solid line(s) is a spacecraft slew end time.
- 5) Time of each bin is in the middle of the bin.
1 s binning
From T0-310 s to T0+310 s

From T100_start - 20 s to T100_end + 30 s

Full time interval

64 ms binning
Full time interval
From T100_start to T100_end
From T0-5 sec to T0+5 sec
16 ms binning
From T100_start-5 s to T100_start+5 s
Blue+Cyan dotted lines: Time interval of the scaled map
From 0.000000 to 1.024000
8 ms binning
From T100_start-3 s to T100_start+3 s

Blue+Cyan dotted lines: Time interval of the scaled map
From 0.000000 to 1.024000
2 ms binning
From T100_start-1 s to T100_start+1 s

Blue+Cyan dotted lines: Time interval of the scaled map
From 0.000000 to 1.024000
SN=5 or 10 sec. binning (whichever binning is satisfied first)

SN=5 or 10 sec. binning (T < 200 sec)

Quad-rate summed light curves (from T0-300s to T0+1000s)
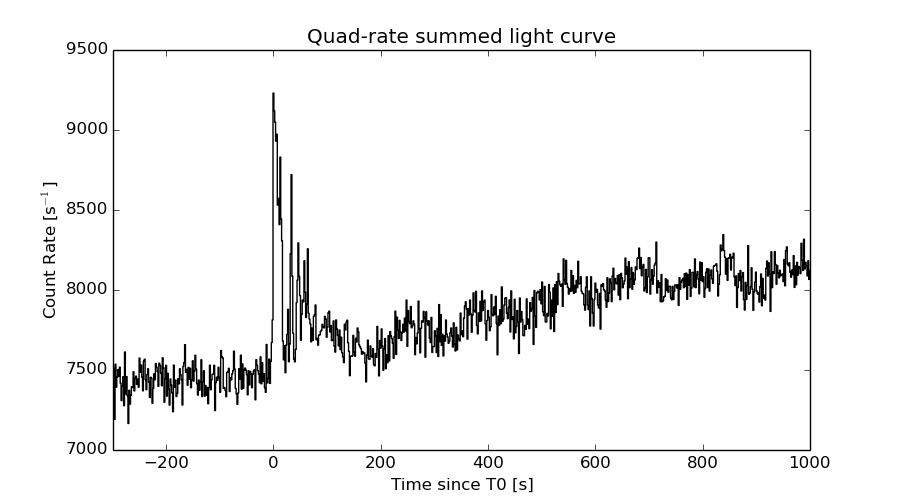
The mask-weighted light curves based on cleaned DPHs

Spectral Evolution
Spectra
Notes:
- 1) The fitting includes the systematic errors.
- 2) When the burst includes telescope slew time periods, the fitting uses an average response file made from multiple 5-s response files through out the slew time plus single time preiod for the non-slew times, and weighted by the total counts in the corresponding time period using addrmf. An average response file is needed becuase a spectral fit using the pre-slew DRM will introduce some errors in both a spectral shape and a normalization if the PHA file contains a lot of the slew/post-slew time interval.
- 3) For fits to more complicated models (e.g. a power-law over a cutoff power-law), the BAT team has decided to require a chi-square improvement of more than 6 for each extra dof.
Time averaged spectrum fit using the average DRM
Power-law model

Time interval is from   -6.560 sec. to  167.624 sec.

Spectral model in power-law:
------------------------------------------------------------
Parameters  : value       lower 90%   higher 90%
Photon index: 1.18923     ( -0.11918   0.11758 )
Norm@50keV  : 1.16479E-03    ( -7.26351e-05   7.25763e-05 )
------------------------------------------------------------
#Fit statistic : Chi-Squared =          50.59 using 59 PHA bins.
# Reduced chi-squared =         0.8875 for     57 degrees of freedom
# Null hypothesis probability =   7.127821e-01

Photon flux (15-150 keV)    in 174.2 sec: 0.136519 ( -0.00892432  0.00896272 ) ph/cm2/s
Energy fluence (15-150 keV)             : 2.06488e-06 ( -1.41379e-07  1.4199e-07 ) ergs/cm2
Cutoff power-law model

Time interval is from   -6.560 sec. to  167.624 sec.
Spectral model in the cutoff power-law:
------------------------------------------------------------
Parameters  : value       lower 90%   higher 90%
Photon index: 1.19076     ( -0.142103   0.113074 )
Epeak [keV] : 9999.36      ( -9999.36 -9999.36 )
Norm@50keV  : 1.17057E-03    ( -7.26966e-05   0.000252653 )
------------------------------------------------------------
#Fit statistic : Chi-Squared =          50.64 using 59 PHA bins.
# Reduced chi-squared =         0.9043 for     56 degrees of freedom
# Null hypothesis probability =   6.771391e-01

Photon flux (15-150 keV)    in 174.2 sec: 0.136719 ( -0.009122  0.008729 ) ph/cm2/s
Energy fluence (15-150 keV)             : 2.05859e-06 ( -1.34657e-07  1.48087e-07 ) ergs/cm2
Band function

Time interval is from   -6.560 sec. to  167.624 sec.

Spectral model in the Band function:
------------------------------------------------------------
Parameters  : value       lower 90%   higher 90%
alpha       : -0.944235   ( 0.9445   0.9445 )
beta        : -1.18898    ( 1.18923   0.119249 )
Epeak [keV] : 51.3257      ( -51.1149 -51.1149 )
Norm@50keV   : 2.11561E-03    ( -0.00102225   0 )
------------------------------------------------------------
#Fit statistic : Chi-Squared =          50.59 using 59 PHA bins.
# Reduced chi-squared =         0.9198 for     55 degrees of freedom
# Null hypothesis probability =   6.436933e-01

Photon flux (15-150 keV)    in 174.2 sec:  (    ) ph/cm2/s
Energy fluence (15-150 keV)             : 0 ( 0  0 ) ergs/cm2
Single BB
Spectral model blackbody:
------------------------------------------------------------
Parameters  : value    Lower 90%  Upper 90%
kT [keV]    : 20.8570  (  )
R^2/D10^2   : 5.29493E-03  (   )
(R is the radius in km and D10 is the distance to the source in units of 10 kpc)
------------------------------------------------------------
#Fit statistic : Chi-Squared =         125.76 using 59 PHA bins.
# Reduced chi-squared =         2.2063 for     57 degrees of freedom
# Null hypothesis probability =   4.299341e-07

Energy  Fluence     90% Error
[keV]   [erg/cm2]   [erg/cm2]
15- 25  7.603e-08   9.738e-09
25- 50  3.891e-07   3.632e-08
50-150  1.261e-06   1.358e-07
15-150  1.726e-06   1.553e-07
Thermal bremsstrahlung (OTTB)

Spectral model: thermal bremsstrahlung
------------------------------------------------------------
Parameters  : value         Lower 90%    Upper 90%
kT [keV]    : 200.000       (      )
Norm        : 0.570033       (-0.036254     0.0362469)
------------------------------------------------------------
#Fit statistic : Chi-Squared =          81.74 using 59 PHA bins.
# Reduced chi-squared =          1.434 for     57 degrees of freedom
# Null hypothesis probability =   1.752197e-02

Energy  Fluence     90% Error
[keV]   [erg/cm2]   [erg/cm2]
15- 25  2.472e-07   2.151e-08
25- 50  4.755e-07   4.616e-08
50-150  1.043e-06   3.090e-07
15-150  1.766e-06   3.561e-07
Double BB

Spectral model: bbodyrad<1> + bbodyrad<2>
------------------------------------------------------------
Parameters  : value         Lower 90%    Upper 90%
kT1 [keV]   : 7.09380        (-1.31649      1.56863)
R1^2/D10^2  : 0.124523        (-0.0616943      0.138557)
kT2 [keV]   : 36.1925        (-6.57175      11.6332)
R2^2/D10^2  : 8.33155E-04    (-0.000452392   0.000708267)
------------------------------------------------------------
#Fit statistic : Chi-Squared =          48.23 using 59 PHA bins.
# Reduced chi-squared =         0.8769 for     55 degrees of freedom
# Null hypothesis probability =   7.290581e-01

Energy  Fluence     90% Error
[keV]   [erg/cm2]   [erg/cm2]
15- 25  2.041e-07   5.619e-08
25- 50  4.238e-07   9.137e-08
50-150  1.505e-06   3.978e-07
15-150  2.132e-06   4.963e-07
Peak spectrum fit
Power-law model

Time interval is from    8.584 sec. to    9.584 sec.

Spectral model in power-law:
------------------------------------------------------------
Parameters  : value       lower 90%   higher 90%
Photon index: 1.08600     ( -0.36562   0.344173 )
Norm@50keV  : 6.01794E-03    ( -0.00114706   0.00114223 )
------------------------------------------------------------
#Fit statistic : Chi-Squared =          68.98 using 59 PHA bins.
# Reduced chi-squared =          1.210 for     57 degrees of freedom
# Null hypothesis probability =   1.328472e-01

Photon flux (15-150 keV)    in 1 sec: 0.697141 ( -0.136782  0.137204 ) ph/cm2/s
Energy fluence (15-150 keV)             : 6.32029e-08 ( -1.30837e-08  1.3213e-08 ) ergs/cm2
Cutoff power-law model

Time interval is from    8.584 sec. to    9.584 sec.
Spectral model in the cutoff power-law:
------------------------------------------------------------
Parameters  : value       lower 90%   higher 90%
Photon index: 2.31872     (     )
Epeak [keV] : 106.189      (   )
Norm@50keV  : 9.14616E-04    (     )
------------------------------------------------------------
#Fit statistic : Chi-Squared =          68.58 using 59 PHA bins.
# Reduced chi-squared =          1.225 for     56 degrees of freedom
# Null hypothesis probability =   1.206349e-01

Photon flux (15-150 keV)    in 1 sec: 0.698784 ( -0.138615  0.135443 ) ph/cm2/s
Energy fluence (15-150 keV)             : 6.32724e-08 ( -1.3131e-08  1.2954e-08 ) ergs/cm2
Band function

Time interval is from    8.584 sec. to    9.584 sec.

Spectral model in the Band function:
------------------------------------------------------------
Parameters  : value       lower 90%   higher 90%
alpha       : -0.894031   ( 0.894031   0.894031 )
beta        : -1.08600    ( 1.086   0.365616 )
Epeak [keV] : 48.6766      ( -48.6766 -48.6766 )
Norm@50keV   : 1.02577E-02    ( -0.00537608   0 )
------------------------------------------------------------
#Fit statistic : Chi-Squared =          68.98 using 59 PHA bins.
# Reduced chi-squared =          1.254 for     55 degrees of freedom
# Null hypothesis probability =   9.742533e-02

Photon flux (15-150 keV)    in 1 sec:  (    ) ph/cm2/s
Energy fluence (15-150 keV)             : 0 ( 0  0 ) ergs/cm2
Single BB

Spectral model blackbody:
------------------------------------------------------------
Parameters  : value    Lower 90%  Upper 90%
kT [keV]    : 19.8944  (-4.9631  8.11718)
R^2/D10^2   : 3.26820E-02  (-0.0214665   0.0509076)
(R is the radius in km and D10 is the distance to the source in units of 10 kpc)
------------------------------------------------------------
#Fit statistic : Chi-Squared =          77.13 using 59 PHA bins.
# Reduced chi-squared =          1.353 for     57 degrees of freedom
# Null hypothesis probability =   3.908739e-02

Energy  Fluence     90% Error
[keV]   [erg/cm2]   [erg/cm2]
15- 25  2.499e-09   1.069e-09
25- 50  1.240e-08   4.714e-09
50-150  3.636e-08   1.470e-08
15-150  5.127e-08   1.773e-08
Thermal bremsstrahlung (OTTB)

Spectral model: thermal bremsstrahlung
------------------------------------------------------------
Parameters  : value         Lower 90%    Upper 90%
kT [keV]    : 200.000       (      )
Norm        : 2.87289       (-0.562214     0.562171)
------------------------------------------------------------
#Fit statistic : Chi-Squared =          74.38 using 59 PHA bins.
# Reduced chi-squared =          1.305 for     57 degrees of freedom
# Null hypothesis probability =   6.084990e-02

Energy  Fluence     90% Error
[keV]   [erg/cm2]   [erg/cm2]
15- 25  7.157e-09   4.207e-09
25- 50  1.377e-08   7.995e-09
50-150  3.020e-08   1.755e-08
15-150  5.112e-08   2.959e-08
Double BB
R1^2/D10^2  : 0.155477        (      )
kT2 [keV]   : 200.000        (      )
R2^2/D10^2  : 1.35931E-04    (-6.27671e-05   0.000693784)
------------------------------------------------------------
#Fit statistic : Chi-Squared =          67.85 using 59 PHA bins.
#Fit statistic : Chi-Squared =          67.65 using 59 PHA bins.
#Fit statistic : Chi-Squared =          67.61 using 59 PHA bins.
# Reduced chi-squared =          1.234 for     55 degrees of freedom
# Reduced chi-squared =          1.230 for     55 degrees of freedom
# Reduced chi-squared =          1.229 for     55 degrees of freedom
# Null hypothesis probability =   1.143727e-01
# Null hypothesis probability =   1.176112e-01
# Null hypothesis probability =   1.183009e-01

Energy  Fluence     90% Error
[keV]   [erg/cm2]   [erg/cm2]
15- 25  4.570e-09   2.693e-09
25- 50  1.390e-08   7.745e-09
50-150  4.640e-08   3.460e-08
15-150  6.487e-08   3.414e-08
Pre-slew spectrum (Pre-slew PHA with pre-slew DRM)
Power-law model

Spectral model in power-law:
------------------------------------------------------------
Parameters  : value       lower 90%   higher 90%
Photon index: 0.811155     ( -0.135594   0.130428 )
Norm@50keV  : 3.43942E-03    ( -0.000257594   0.000253595 )
------------------------------------------------------------
#Fit statistic : Chi-Squared =          58.53 using 59 PHA bins.
# Reduced chi-squared =          1.027 for     57 degrees of freedom
# Null hypothesis probability =   4.190318e-01

Photon flux (15-150 keV)    in 21.63 sec: 0.395155 ( -0.0286069  0.0287156 ) ph/cm2/s
Energy fluence (15-150 keV)             : 8.65323e-07 ( -6.06226e-08  6.08365e-08 ) ergs/cm2
Cutoff power-law model

Spectral model in the cutoff power-law:
------------------------------------------------------------
Parameters  : value       lower 90%   higher 90%
Photon index: 0.803891     (     )
Epeak [keV] : 1.00000E+04      (   )
Norm@50keV  : 3.46362E-03    ( -0.00025829   0.000230463 )
------------------------------------------------------------
#Fit statistic : Chi-Squared =          58.60 using 59 PHA bins.
# Reduced chi-squared =          1.046 for     56 degrees of freedom
# Null hypothesis probability =   3.804005e-01

Photon flux (15-150 keV)    in 21.63 sec: 0.394977 ( -0.028249  0.028728 ) ph/cm2/s
Energy fluence (15-150 keV)             : 8.64839e-07 ( -6.00319e-08  6.16282e-08 ) ergs/cm2
Band function
Spectral model in the Band function:
------------------------------------------------------------
Parameters  : value       lower 90%   higher 90%
alpha       : -0.813759   ( 0.81376   0.81376 )
beta        : -0.811160    ( -0.13047   0.135585 )
Epeak [keV] : 16.1072      ( -16.1073 -16.1073 )
Norm@50keV   : 4.93849E-03    ( -0.00133407   85433.2 )
------------------------------------------------------------
#Fit statistic : Chi-Squared =          58.53 using 59 PHA bins.
# Reduced chi-squared =          1.064 for     55 degrees of freedom
# Null hypothesis probability =   3.471967e-01

Photon flux (15-150 keV)    in 21.63 sec:  (    ) ph/cm2/s
Energy fluence (15-150 keV)             : 0 ( 0  0 ) ergs/cm2
S(25-50 keV) vs. S(50-100 keV) plot
S(25-50 keV)  = 4.31e-07
S(50-100 keV) = 7.56e-07
T90 vs. Hardness ratio plot
T90                                   = 123.239999949932 sec.
Hardness ratio (energy fluence ratio) = 1.75406
Color vs. Color plot

Count Ratio  (25-50 keV) / (15-25 keV) = 1.59228
Count Ratio (50-100 keV) / (15-25 keV) = 1.45513
Mask shadow pattern

IMX = -5.487857649298175E-01, IMY = 2.250439268988485E-01
TIME vs. PHA plot around the trigger time
Blue+Cyan dotted lines: Time interval of the scaled map
From 0.000000 to 1.024000
TIME vs. DetID plot around the trigger time
Blue+Cyan dotted lines: Time interval of the scaled map
From 0.000000 to 1.024000
100 us light curve (15-350 keV)
Blue+Cyan dotted lines: Time interval of the scaled map
From 0.000000 to 1.024000
Spacecraft aspect plot

Bright source in the pre-burst/pre-slew/post-slew images
Pre-burst image of 15-350 keV band
Time interval of the image:
-239.432000 -6.560000

# RAcent  DECcent POSerr Theta    Phi  PeakCts   SNR AngSep     Name
#  [deg]    [deg]    ['] [deg]  [deg]                   [']
170.2234 -60.6652    7.2  52.7  161.5   1.1976   1.6    3.7	Cen X-3
179.1281 -52.7142    2.3  43.5  160.3   1.6560   5.0 ------	UNKNOWN
Pre-slew background subtracted image of 15-350 keV band
Time interval of the image:
-6.560000 15.068600

# RAcent  DECcent POSerr Theta    Phi  PeakCts   SNR AngSep     Name
#  [deg]    [deg]    ['] [deg]  [deg]                   [']
170.2939 -60.6283   21.7  52.7  161.5  -0.1094  -0.5    0.7	Cen X-3
197.6781  14.0442    3.0  25.3  -26.0   0.1721   3.8 ------	UNKNOWN
166.4659 -26.6663    0.5  30.7 -157.7   1.2076  23.7 ------	UNKNOWN
146.3944 -41.7236    1.8  51.9 -168.3   0.7186   6.2 ------	UNKNOWN
Post-slew image of 15-350 keV band
Time interval of the image:
65.868600 962.622100

# RAcent  DECcent POSerr Theta    Phi  PeakCts   SNR AngSep     Name
#  [deg]    [deg]    ['] [deg]  [deg]                   [']
135.5286 -40.5485    0.8  29.1 -170.4   6.6662  14.4    0.4	Vela X-1
170.3159 -60.6230    9.1  34.0  132.6   1.0083   1.3    0.0	Cen X-3
186.3116 -62.8224    2.5  38.4  121.5   5.2607   4.6   10.0	GX 301-2
213.1164  -4.0924    2.1  49.9   27.3   8.4262   5.4 ------	UNKNOWN
188.8784   2.5624    2.8  36.3   -4.2   2.5649   4.2 ------	UNKNOWN
187.9018  24.8440    3.3  55.5  -20.4   6.2941   3.5 ------	UNKNOWN
116.8102 -14.0232    2.7  48.0 -129.0   9.8604   4.2 ------	UNKNOWN
Plot creation:
Sun May 31 00:49:05 EDT 2015