Special notes of this burst
Image
Pre-slew 15.0-350.0 keV image (Event data)
#   RAcent    DECcent   POSerr    Theta     Phi              Peak Cts       SNR   Name
   88.7537   -15.2589   0.0022    29.3945  -177.0203         7.5304324     86.810 TRIG_00430151

Foreground time interval of the image:
-15.571  13.229 (delta_t =  28.800 [sec])
Background time interval of the image:
Lightcurves
Notes:
- 1) The mask-weighted light curves are using the flight position.
- 2) Multiple plots of different time binning/intervals are shown to cover all scenarios of short/long GRBs, rate/image triggers, and real/false positives.
- 3) For all the mask-weighted lightcurves, the y-axis units are counts/sec/det where a det is 0.4 x 0.4 = 0.16 sq cm.
- 4) The verticle lines correspond to following: green dotted lines are T50 interval, black dotted lines are T90 interval, blue solid line(s) is a spacecraft slew start time, and orange solid line(s) is a spacecraft slew end time.
- 5) Time of each bin is in the middle of the bin.
1 s binning
From T0-310 s to T0+310 s
From T100_start - 20 s to T100_end + 30 s

Full time interval

64 ms binning
Full time interval

From T100_start to T100_end

From T0-5 sec to T0+5 sec

16 ms binning
From T100_start-5 s to T100_start+5 s

Blue+Cyan dotted lines: Time interval of the scaled map
From 0.000000 to 1.024000
8 ms binning
From T100_start-3 s to T100_start+3 s
Blue+Cyan dotted lines: Time interval of the scaled map
From 0.000000 to 1.024000
2 ms binning
From T100_start-1 s to T100_start+1 s

Blue+Cyan dotted lines: Time interval of the scaled map
From 0.000000 to 1.024000
SN=5 or 10 sec. binning (whichever binning is satisfied first)

SN=5 or 10 sec. binning (T < 200 sec)
Quad-rate summed light curves (from T0-300s to T0+1000s)
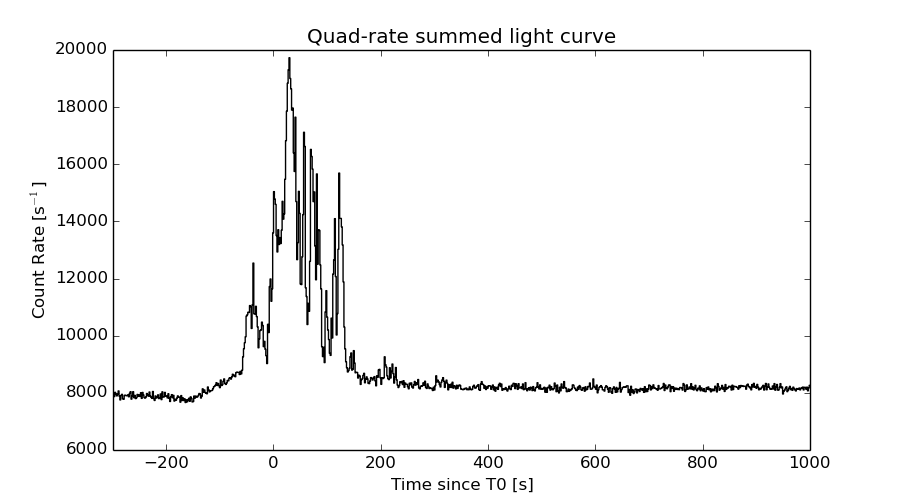
The mask-weighted light curves based on cleaned DPHs

Spectral Evolution

Spectra
Notes:
- 1) The fitting includes the systematic errors.
- 2) When the burst includes telescope slew time periods, the fitting uses an average response file made from multiple 5-s response files through out the slew time plus single time preiod for the non-slew times, and weighted by the total counts in the corresponding time period using addrmf. An average response file is needed becuase a spectral fit using the pre-slew DRM will introduce some errors in both a spectral shape and a normalization if the PHA file contains a lot of the slew/post-slew time interval.
- 3) For fits to more complicated models (e.g. a power-law over a cutoff power-law), the BAT team has decided to require a chi-square improvement of more than 6 for each extra dof.
Time averaged spectrum fit using the average DRM
Power-law model
Time interval is from  -79.008 sec. to  333.552 sec.

Spectral model in power-law:
------------------------------------------------------------
Parameters  : value       lower 90%   higher 90%
Photon index: 1.12258     ( -0.0233831   0.0232794 )
Norm@50keV  : 8.70306E-03    ( -0.000118695   0.000118231 )
------------------------------------------------------------
#Fit statistic : Chi-Squared =          23.19 using 59 PHA bins.
# Reduced chi-squared =         0.4068 for     57 degrees of freedom
# Null hypothesis probability =   9.999803e-01

Photon flux (15-150 keV)    in 412.6 sec: 1.01182 ( -0.0151347  0.0151999 ) ph/cm2/s
Energy fluence (15-150 keV)             : 3.72774e-05 ( -4.42794e-07  4.42716e-07 ) ergs/cm2
Cutoff power-law model

Time interval is from  -79.008 sec. to  333.552 sec.
Spectral model in the cutoff power-law:
------------------------------------------------------------
Parameters  : value       lower 90%   higher 90%
Photon index: 1.11737     ( -0.0242613   0.0228154 )
Epeak [keV] : 9999.36      ( -10000 -10000 )
Norm@50keV  : 8.74773E-03    ( -0.000119986   0.000103902 )
------------------------------------------------------------
#Fit statistic : Chi-Squared =          23.33 using 59 PHA bins.
# Reduced chi-squared =         0.4166 for     56 degrees of freedom
# Null hypothesis probability =   9.999653e-01

Photon flux (15-150 keV)    in 412.6 sec: 1.01118 (    ) ph/cm2/s
Energy fluence (15-150 keV)             : 3.72899e-05 ( -4.42348e-07  4.42967e-07 ) ergs/cm2
Band function
Time interval is from  -79.008 sec. to  333.552 sec.

Spectral model in the Band function:
------------------------------------------------------------
Parameters  : value       lower 90%   higher 90%
alpha       : -0.794267   ( 0.787793   5.77675 )
beta        : -1.12279    ( 1.123   0.0236623 )
Epeak [keV] : 74.2714      ( -80.512 -80.512 )
Norm@50keV   : 1.62730E-02    ( -0.00755356   353647 )
------------------------------------------------------------
#Fit statistic : Chi-Squared =          23.18 using 59 PHA bins.
# Reduced chi-squared =         0.4214 for     55 degrees of freedom
# Null hypothesis probability =   9.999510e-01

Photon flux (15-150 keV)    in 412.6 sec:  (    ) ph/cm2/s
Energy fluence (15-150 keV)             : 0 ( 0  0 ) ergs/cm2
Single BB

Spectral model blackbody:
------------------------------------------------------------
Parameters  : value    Lower 90%  Upper 90%
kT [keV]    : 25.2101  (  )
R^2/D10^2   : 2.21301E-02  (   )
(R is the radius in km and D10 is the distance to the source in units of 10 kpc)
------------------------------------------------------------
#Fit statistic : Chi-Squared =        1224.38 using 59 PHA bins.
# Reduced chi-squared =        21.4803 for     57 degrees of freedom
# Null hypothesis probability =  1.073881e-218

Energy  Fluence     90% Error
[keV]   [erg/cm2]   [erg/cm2]
15- 25  1.004e-06   2.826e-08
25- 50  5.718e-06   1.238e-07
50-150  2.691e-05   3.878e-07
15-150  3.364e-05   4.291e-07
Thermal bremsstrahlung (OTTB)

Spectral model: thermal bremsstrahlung
------------------------------------------------------------
Parameters  : value         Lower 90%    Upper 90%
kT [keV]    : 199.363       (      )
Norm        : 4.64585       (     )
------------------------------------------------------------
#Fit statistic : Chi-Squared =        1334.94 using 59 PHA bins.
# Reduced chi-squared =        23.4200 for     57 degrees of freedom
# Null hypothesis probability =  1.129890e-241

Energy  Fluence     90% Error
[keV]   [erg/cm2]   [erg/cm2]
15- 25  4.773e-06   7.014e-08
25- 50  9.182e-06   1.382e-07
50-150  2.014e-05   2.847e-07
15-150  3.409e-05   4.724e-07
Double BB

Spectral model: bbodyrad<1> + bbodyrad<2>
------------------------------------------------------------
Parameters  : value         Lower 90%    Upper 90%
kT1 [keV]   : 8.93874        (-0.494184      0.519936)
R1^2/D10^2  : 0.365511        (-0.0619203      0.0775786)
kT2 [keV]   : 38.4510        (-1.77306      2.07117)
R2^2/D10^2  : 5.05444E-03    (-0.000771221   0.000828854)
------------------------------------------------------------
#Fit statistic : Chi-Squared =          37.11 using 59 PHA bins.
# Reduced chi-squared =         0.6747 for     55 degrees of freedom
# Null hypothesis probability =   9.693381e-01

Energy  Fluence     90% Error
[keV]   [erg/cm2]   [erg/cm2]
15- 25  2.747e-06   1.432e-07
25- 50  7.674e-06   1.795e-07
50-150  2.692e-05   5.261e-07
15-150  3.735e-05   6.498e-07
Peak spectrum fit
Power-law model

Time interval is from   28.264 sec. to   29.264 sec.

Spectral model in power-law:
------------------------------------------------------------
Parameters  : value       lower 90%   higher 90%
Photon index: 0.700784     ( -0.0775793   0.0762993 )
Norm@50keV  : 4.32418E-02    ( -0.00188355   0.00187153 )
------------------------------------------------------------
#Fit statistic : Chi-Squared =          70.64 using 59 PHA bins.
# Reduced chi-squared =          1.239 for     57 degrees of freedom
# Null hypothesis probability =   1.057685e-01

Photon flux (15-150 keV)    in 1 sec: 4.99804 ( -0.207366  0.207676 ) ph/cm2/s
Energy fluence (15-150 keV)             : 5.27638e-07 ( -2.32889e-08  2.3369e-08 ) ergs/cm2
Cutoff power-law model

Time interval is from   28.264 sec. to   29.264 sec.
Spectral model in the cutoff power-law:
------------------------------------------------------------
Parameters  : value       lower 90%   higher 90%
Photon index: 0.694253     ( -0.079762   0.0754366 )
Epeak [keV] : 9999.36      ( -9999.36 -9999.36 )
Norm@50keV  : 4.35902E-02    ( -0.00178251   0.00844076 )
------------------------------------------------------------
#Fit statistic : Chi-Squared =          70.71 using 59 PHA bins.
# Reduced chi-squared =          1.263 for     56 degrees of freedom
# Null hypothesis probability =   8.917755e-02

Photon flux (15-150 keV)    in 1 sec: 4.99668 (    ) ph/cm2/s
Energy fluence (15-150 keV)             : 5.27778e-07 ( -2.3174e-08  2.3131e-08 ) ergs/cm2
Band function

Time interval is from   28.264 sec. to   29.264 sec.

Spectral model in the Band function:
------------------------------------------------------------
Parameters  : value       lower 90%   higher 90%
alpha       : -1.00167   ( 1.00167   1.00167 )
beta        : -0.700784    ( -0.0762604   0.0776502 )
Epeak [keV] : 19.2703      ( -19.2703 -19.2703 )
Norm@50keV   : 5.57726E-02    ( -0.0142272   814455 )
------------------------------------------------------------
#Fit statistic : Chi-Squared =          70.64 using 59 PHA bins.
# Reduced chi-squared =          1.284 for     55 degrees of freedom
# Null hypothesis probability =   7.608269e-02

Photon flux (15-150 keV)    in 1 sec:  (    ) ph/cm2/s
Energy fluence (15-150 keV)             : 0 ( 0  0 ) ergs/cm2
Single BB

Spectral model blackbody:
------------------------------------------------------------
Parameters  : value    Lower 90%  Upper 90%
kT [keV]    : 28.8825  (  )
R^2/D10^2   : 8.49383E-02  (   )
(R is the radius in km and D10 is the distance to the source in units of 10 kpc)
------------------------------------------------------------
#Fit statistic : Chi-Squared =         160.57 using 59 PHA bins.
# Reduced chi-squared =         2.8170 for     57 degrees of freedom
# Null hypothesis probability =   8.504424e-12

Energy  Fluence     90% Error
[keV]   [erg/cm2]   [erg/cm2]
15- 25  1.134e-08   9.850e-10
25- 50  6.886e-08   4.640e-09
50-150  4.114e-07   2.460e-08
15-150  4.917e-07   2.420e-08
Thermal bremsstrahlung (OTTB)
Spectral model: thermal bremsstrahlung
------------------------------------------------------------
Parameters  : value         Lower 90%    Upper 90%
kT [keV]    : 199.363       (      )
Norm        : 18.9913       (     )
------------------------------------------------------------
#Fit statistic : Chi-Squared =         399.23 using 59 PHA bins.
# Reduced chi-squared =         7.0041 for     57 degrees of freedom
# Null hypothesis probability =   7.387864e-53

Energy  Fluence     90% Error
[keV]   [erg/cm2]   [erg/cm2]
15- 25  4.729e-08   2.195e-09
25- 50  9.097e-08   4.465e-09
50-150  1.995e-07   1.080e-08
15-150  3.378e-07   1.860e-08
Double BB

Spectral model: bbodyrad<1> + bbodyrad<2>
------------------------------------------------------------
Parameters  : value         Lower 90%    Upper 90%
kT1 [keV]   : 7.86586        (-1.46155      1.91345)
R1^2/D10^2  : 1.93478        (-0.938372      1.93017)
kT2 [keV]   : 42.2882        (-5.52114      9.11881)
R2^2/D10^2  : 2.70219E-02    (-0.0109564   0.0129051)
------------------------------------------------------------
#Fit statistic : Chi-Squared =          70.61 using 59 PHA bins.
# Reduced chi-squared =          1.284 for     55 degrees of freedom
# Null hypothesis probability =   7.649329e-02

Energy  Fluence     90% Error
[keV]   [erg/cm2]   [erg/cm2]
15- 25  2.736e-08   6.410e-09
25- 50  7.781e-08   1.211e-08
50-150  4.330e-07   4.905e-08
15-150  5.382e-07   4.925e-08
Pre-slew spectrum (Pre-slew PHA with pre-slew DRM)
Power-law model

Spectral model in power-law:
------------------------------------------------------------
Parameters  : value       lower 90%   higher 90%
Photon index: 0.970547     ( -0.0352324   0.0350234 )
Norm@50keV  : 1.74991E-02    ( -0.000345262   0.000343779 )
------------------------------------------------------------
#Fit statistic : Chi-Squared =          41.04 using 59 PHA bins.
# Reduced chi-squared =         0.7200 for     57 degrees of freedom
# Null hypothesis probability =   9.450389e-01

Photon flux (15-150 keV)    in 28.8 sec: 2.01191 ( -0.0406863  0.0408355 ) ph/cm2/s
Energy fluence (15-150 keV)             : 5.50771e-06 ( -1.03795e-07  1.0384e-07 ) ergs/cm2
Cutoff power-law model
Spectral model in the cutoff power-law:
------------------------------------------------------------
Parameters  : value       lower 90%   higher 90%
Photon index: 0.884615     ( -0.141496   0.0522346 )
Epeak [keV] : 831.915      ( -831.918 -831.918 )
Norm@50keV  : 1.89091E-02    ( -0.000608201   0.00250205 )
------------------------------------------------------------
#Fit statistic : Chi-Squared =          39.92 using 59 PHA bins.
# Reduced chi-squared =         0.7128 for     56 degrees of freedom
# Null hypothesis probability =   9.485832e-01

Photon flux (15-150 keV)    in 28.8 sec: 2.00105 ( -0.04387  0.0428 ) ph/cm2/s
Energy fluence (15-150 keV)             : 5.4966e-06 ( -1.06704e-07  1.06272e-07 ) ergs/cm2
Band function

Spectral model in the Band function:
------------------------------------------------------------
Parameters  : value       lower 90%   higher 90%
alpha       : -0.791485   ( 0.791484   0.791484 )
beta        : -0.970544    ( -0.0350188   0.0352394 )
Epeak [keV] : 51.3768      (   )
Norm@50keV   : 2.93193E-02    (     )
------------------------------------------------------------
#Fit statistic : Chi-Squared =          41.04 using 59 PHA bins.
# Reduced chi-squared =         0.7462 for     55 degrees of freedom
# Null hypothesis probability =   9.190609e-01

Photon flux (15-150 keV)    in 28.8 sec:  (    ) ph/cm2/s
Energy fluence (15-150 keV)             : 0 ( 0  0 ) ergs/cm2
S(25-50 keV) vs. S(50-100 keV) plot
S(25-50 keV)  = 7.47e-06
S(50-100 keV) = 1.37e-05
T90 vs. Hardness ratio plot

T90                                   = 193.383999943733 sec.
Hardness ratio (energy fluence ratio) = 1.834
Color vs. Color plot
Count Ratio  (25-50 keV) / (15-25 keV) = 1.61142
Count Ratio (50-100 keV) / (15-25 keV) = 1.60577
Mask shadow pattern

IMX = -5.625835373988104E-01, IMY = 2.928403708244022E-02
TIME vs. PHA plot around the trigger time

Blue+Cyan dotted lines: Time interval of the scaled map
From 0.000000 to 1.024000
TIME vs. DetID plot around the trigger time
Blue+Cyan dotted lines: Time interval of the scaled map
From 0.000000 to 1.024000
100 us light curve (15-350 keV)

Blue+Cyan dotted lines: Time interval of the scaled map
From 0.000000 to 1.024000
Spacecraft aspect plot

Bright source in the pre-burst/pre-slew/post-slew images
Pre-burst image of 15-350 keV band
Time interval of the image:
Pre-slew background subtracted image of 15-350 keV band
Time interval of the image:
-15.571410 13.228580

# RAcent  DECcent POSerr Theta    Phi  PeakCts   SNR AngSep     Name
#  [deg]    [deg]    ['] [deg]  [deg]                   [']
135.5846 -40.4930    2.6  18.5   12.1   0.3539   4.5    4.5	Vela X-1
170.5645 -60.5169    3.9  46.1   32.4   0.6861   3.0    9.7	Cen X-3
 82.9128 -65.8669    2.6  40.0   86.6   1.4257   4.4 ------	UNKNOWN
 79.6909 -20.7412    1.9  33.9  165.5   0.6062   6.0 ------	UNKNOWN
 88.7537 -15.2589    0.1  29.4 -177.0   7.5305  86.8 ------	UNKNOWN
 80.7420  -6.9068    2.6  40.8 -174.5   0.5051   4.5 ------	UNKNOWN
Post-slew image of 15-350 keV band
Time interval of the image:
65.828600 962.828500

# RAcent  DECcent POSerr Theta    Phi  PeakCts   SNR AngSep     Name
#  [deg]    [deg]    ['] [deg]  [deg]                   [']
 83.6278  22.0192    0.2  37.6 -146.8  35.0718  48.3    0.4	Crab
135.5223 -40.5409    1.7  47.7   -7.5   7.0920   6.8    0.9	Vela X-1
 93.3659 -61.1223    3.2  46.0   37.9   6.8725   3.6 ------	UNKNOWN
112.7525 -56.1962    2.8  44.8   22.3   4.3962   4.2 ------	UNKNOWN
 74.6165  -3.5001    2.5  18.2  169.8   2.2619   4.7 ------	UNKNOWN
 88.7610 -15.2598    0.3   0.0  -76.7  22.3001  41.8 ------	UNKNOWN
 84.7224  26.3547    1.7  41.8 -144.4   5.9298   6.7 ------	UNKNOWN
Plot creation:
Sun May 31 00:43:11 EDT 2015