Special notes of this burst
Image
Pre-slew 15.0-350.0 keV image (Event data)

#   RAcent    DECcent   POSerr    Theta     Phi              Peak Cts       SNR   Name
    2.4796    47.7542   0.0070    29.1766    -7.2931         1.3623987     27.667 TRIG_00430603

Foreground time interval of the image:
 -3.292  15.693 (delta_t =  18.985 [sec])
Background time interval of the image:
-169.107  -3.292 (delta_t = 165.815 [sec])
Lightcurves
Notes:
- 1) The mask-weighted light curves are using the flight position.
- 2) Multiple plots of different time binning/intervals are shown to cover all scenarios of short/long GRBs, rate/image triggers, and real/false positives.
- 3) For all the mask-weighted lightcurves, the y-axis units are counts/sec/det where a det is 0.4 x 0.4 = 0.16 sq cm.
- 4) The verticle lines correspond to following: green dotted lines are T50 interval, black dotted lines are T90 interval, blue solid line(s) is a spacecraft slew start time, and orange solid line(s) is a spacecraft slew end time.
- 5) Time of each bin is in the middle of the bin.
1 s binning
From T0-310 s to T0+310 s

From T100_start - 20 s to T100_end + 30 s

Full time interval
64 ms binning
Full time interval
From T100_start to T100_end

From T0-5 sec to T0+5 sec

16 ms binning
From T100_start-5 s to T100_start+5 s

Blue+Cyan dotted lines: Time interval of the scaled map
From 0.000000 to 1.024000
8 ms binning
From T100_start-3 s to T100_start+3 s

Blue+Cyan dotted lines: Time interval of the scaled map
From 0.000000 to 1.024000
2 ms binning
From T100_start-1 s to T100_start+1 s

Blue+Cyan dotted lines: Time interval of the scaled map
From 0.000000 to 1.024000
SN=5 or 10 sec. binning (whichever binning is satisfied first)
SN=5 or 10 sec. binning (T < 200 sec)

Quad-rate summed light curves (from T0-300s to T0+1000s)
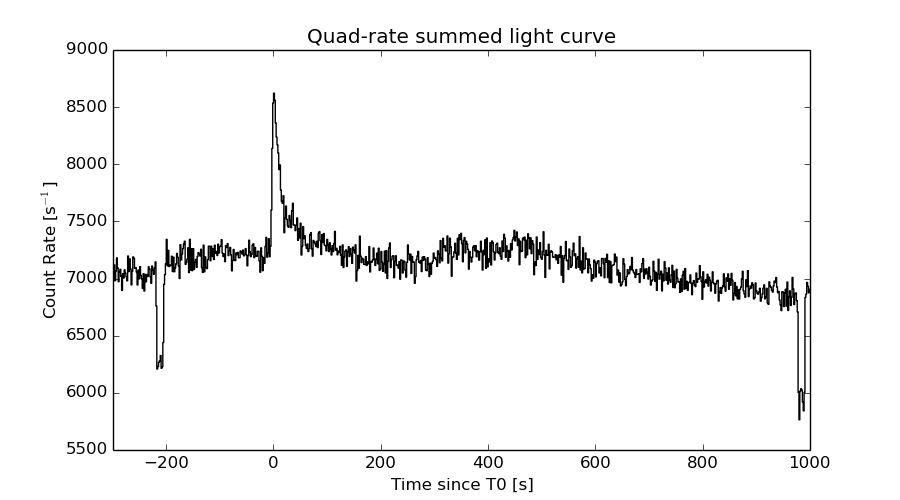
The mask-weighted light curves based on cleaned DPHs

Spectral Evolution

Spectra
Notes:
- 1) The fitting includes the systematic errors.
- 2) When the burst includes telescope slew time periods, the fitting uses an average response file made from multiple 5-s response files through out the slew time plus single time preiod for the non-slew times, and weighted by the total counts in the corresponding time period using addrmf. An average response file is needed becuase a spectral fit using the pre-slew DRM will introduce some errors in both a spectral shape and a normalization if the PHA file contains a lot of the slew/post-slew time interval.
- 3) For fits to more complicated models (e.g. a power-law over a cutoff power-law), the BAT team has decided to require a chi-square improvement of more than 6 for each extra dof.
Time averaged spectrum fit using the average DRM
Power-law model
Time interval is from   -3.292 sec. to  531.780 sec.

Spectral model in power-law:
------------------------------------------------------------
Parameters  : value       lower 90%   higher 90%
Photon index: 1.81514     ( -0.101491   0.103218 )
Norm@50keV  : 7.04408E-04    ( -4.33699e-05   4.29775e-05 )
------------------------------------------------------------
#Fit statistic : Chi-Squared =          64.11 using 59 PHA bins.
# Reduced chi-squared =          1.125 for     57 degrees of freedom
# Null hypothesis probability =   2.414245e-01

Photon flux (15-150 keV)    in 535.1 sec: 9.76416E-02 ( -0.00539995  0.00540577 ) ph/cm2/s
Energy fluence (15-150 keV)             : 3.46815e-06 ( -2.16287e-07  2.18611e-07 ) ergs/cm2
Cutoff power-law model

Time interval is from   -3.292 sec. to  531.780 sec.
Spectral model in the cutoff power-law:
------------------------------------------------------------
Parameters  : value       lower 90%   higher 90%
Photon index: 1.39919     ( -0.454729   0.403883 )
Epeak [keV] : 64.6484      ( -14.898 373.965 )
Norm@50keV  : 1.18818E-03    ( -0.000467261   0.000902126 )
------------------------------------------------------------
#Fit statistic : Chi-Squared =          61.08 using 59 PHA bins.
# Reduced chi-squared =          1.091 for     56 degrees of freedom
# Null hypothesis probability =   2.985141e-01

Photon flux (15-150 keV)    in 535.1 sec: 9.54433E-02 ( -0.0057982  0.0057927 ) ph/cm2/s
Energy fluence (15-150 keV)             : 3.31756e-06 ( -2.59679e-07  2.62274e-07 ) ergs/cm2
Band function
Time interval is from   -3.292 sec. to  531.780 sec.

Spectral model in the Band function:
------------------------------------------------------------
Parameters  : value       lower 90%   higher 90%
alpha       : 7.08161E-02   ( -1.07366   0.525757 )
beta        : -1.98955    ( 1.98719   0.173489 )
Epeak [keV] : 34.0804      ( -13.0171 35.2128 )
Norm@50keV   : 1.25765E-02    ( -0.0124551   42.447 )
------------------------------------------------------------
#Fit statistic : Chi-Squared =          58.69 using 59 PHA bins.
# Reduced chi-squared =          1.067 for     55 degrees of freedom
# Null hypothesis probability =   3.418064e-01

Photon flux (15-150 keV)    in 535.1 sec:  (    ) ph/cm2/s
Energy fluence (15-150 keV)             : 3.34927e-06 ( 0  0 ) ergs/cm2
Single BB

Spectral model blackbody:
------------------------------------------------------------
Parameters  : value    Lower 90%  Upper 90%
kT [keV]    : 11.4030  (  )
R^2/D10^2   : 2.74055E-02  (   )
(R is the radius in km and D10 is the distance to the source in units of 10 kpc)
------------------------------------------------------------
#Fit statistic : Chi-Squared =         125.58 using 59 PHA bins.
# Reduced chi-squared =         2.2032 for     57 degrees of freedom
# Null hypothesis probability =   4.520720e-07

Energy  Fluence     90% Error
[keV]   [erg/cm2]   [erg/cm2]
15- 25  4.009e-07   3.847e-08
25- 50  1.186e-06   7.384e-08
50-150  8.951e-07   1.183e-07
15-150  2.482e-06   1.541e-07
Thermal bremsstrahlung (OTTB)

Spectral model: thermal bremsstrahlung
------------------------------------------------------------
Parameters  : value         Lower 90%    Upper 90%
kT [keV]    : 96.4446       (-18.317      26.2051)
Norm        : 0.431938       (-0.0342174     0.0385469)
------------------------------------------------------------
#Fit statistic : Chi-Squared =          61.12 using 59 PHA bins.
# Reduced chi-squared =          1.072 for     57 degrees of freedom
# Null hypothesis probability =   3.301816e-01

Energy  Fluence     90% Error
[keV]   [erg/cm2]   [erg/cm2]
15- 25  6.040e-07   5.744e-08
25- 50  1.037e-06   6.261e-08
50-150  1.645e-06   5.140e-07
15-150  3.286e-06   5.370e-07
Double BB

Spectral model: bbodyrad<1> + bbodyrad<2>
------------------------------------------------------------
Parameters  : value         Lower 90%    Upper 90%
kT1 [keV]   : 6.62592        (-1.17929      1.27223)
R1^2/D10^2  : 0.142258        (-0.0557113      0.114064)
kT2 [keV]   : 22.3145        (-4.60218      8.45231)
R2^2/D10^2  : 1.56235E-03    (-0.000958929   0.00200766)
------------------------------------------------------------
#Fit statistic : Chi-Squared =          60.96 using 59 PHA bins.
# Reduced chi-squared =          1.108 for     55 degrees of freedom
# Null hypothesis probability =   2.703043e-01

Energy  Fluence     90% Error
[keV]   [erg/cm2]   [erg/cm2]
15- 25  5.818e-07   1.733e-07
25- 50  1.029e-06   2.354e-07
50-150  1.603e-06   8.057e-07
15-150  3.213e-06   9.792e-07
Peak spectrum fit
Power-law model

Time interval is from   -0.076 sec. to    0.924 sec.

Spectral model in power-law:
------------------------------------------------------------
Parameters  : value       lower 90%   higher 90%
Photon index: 0.985213     ( -0.233873   0.223695 )
Norm@50keV  : 8.12828E-03    ( -0.00115956   0.001152 )
------------------------------------------------------------
#Fit statistic : Chi-Squared =          66.74 using 59 PHA bins.
# Reduced chi-squared =          1.171 for     57 degrees of freedom
# Null hypothesis probability =   1.770288e-01

Photon flux (15-150 keV)    in 1 sec: 0.935252 ( -0.135254  0.135664 ) ph/cm2/s
Energy fluence (15-150 keV)             : 8.83738e-08 ( -1.2892e-08  1.29278e-08 ) ergs/cm2
Cutoff power-law model

Time interval is from   -0.076 sec. to    0.924 sec.
Spectral model in the cutoff power-law:
------------------------------------------------------------
Parameters  : value       lower 90%   higher 90%
Photon index: -0.304721     ( -1.41757   1.05711 )
Epeak [keV] : 104.048      ( -27.1875 183.132 )
Norm@50keV  : 2.96051E-02    ( -0.0296051   0.0805384 )
------------------------------------------------------------
#Fit statistic : Chi-Squared =          62.20 using 59 PHA bins.
# Reduced chi-squared =          1.111 for     56 degrees of freedom
# Null hypothesis probability =   2.651047e-01

Photon flux (15-150 keV)    in 1 sec: 0.892942 ( -0.139957  0.140498 ) ph/cm2/s
Energy fluence (15-150 keV)             : 8.40841e-08 ( -1.38154e-08  1.37533e-08 ) ergs/cm2
Band function

Time interval is from   -0.076 sec. to    0.924 sec.

Spectral model in the Band function:
------------------------------------------------------------
Parameters  : value       lower 90%   higher 90%
alpha       : 0.305126   ( -1.00176   1.13706 )
beta        : -10.0000    ( 10   0 )
Epeak [keV] : 104.023      ( -20.6836 183.386 )
Norm@50keV   : 2.96187E-02    ( -0.0296187   0.0805762 )
------------------------------------------------------------
#Fit statistic : Chi-Squared =          62.20 using 59 PHA bins.
# Reduced chi-squared =          1.131 for     55 degrees of freedom
# Null hypothesis probability =   2.353726e-01

Photon flux (15-150 keV)    in 1 sec: 0.903850 (    ) ph/cm2/s
Energy fluence (15-150 keV)             : 0 ( 0  0 ) ergs/cm2
Single BB

Spectral model blackbody:
------------------------------------------------------------
Parameters  : value    Lower 90%  Upper 90%
kT [keV]    : 21.7846  (-3.25307  4.14091)
R^2/D10^2   : 3.60733E-02  (-0.015464   0.0248859)
(R is the radius in km and D10 is the distance to the source in units of 10 kpc)
------------------------------------------------------------
#Fit statistic : Chi-Squared =          63.98 using 59 PHA bins.
# Reduced chi-squared =          1.122 for     57 degrees of freedom
# Null hypothesis probability =   2.448486e-01

Energy  Fluence     90% Error
[keV]   [erg/cm2]   [erg/cm2]
15- 25  3.182e-09   8.640e-10
25- 50  1.673e-08   3.850e-09
50-150  5.930e-08   1.408e-08
15-150  7.921e-08   1.568e-08
Thermal bremsstrahlung (OTTB)

Spectral model: thermal bremsstrahlung
------------------------------------------------------------
Parameters  : value         Lower 90%    Upper 90%
kT [keV]    : 200.000       (      )
Norm        : 3.85685       (-0.564484     0.564445)
------------------------------------------------------------
#Fit statistic : Chi-Squared =          82.25 using 59 PHA bins.
# Reduced chi-squared =          1.443 for     57 degrees of freedom
# Null hypothesis probability =   1.595376e-02

Energy  Fluence     90% Error
[keV]   [erg/cm2]   [erg/cm2]
15- 25  9.607e-09   5.495e-09
25- 50  1.848e-08   1.022e-08
50-150  4.053e-08   2.286e-08
15-150  6.861e-08   3.851e-08
Double BB

Spectral model: bbodyrad<1> + bbodyrad<2>
------------------------------------------------------------
Parameters  : value         Lower 90%    Upper 90%
kT1 [keV]   : 10.9895        (-11.1046      14.3665)
R1^2/D10^2  : 0.110138        (-0.101931      -0.101931)
kT2 [keV]   : 28.2384        (-29.4908      -29.4908)
R2^2/D10^2  : 1.26782E-02    (-0.0104812   0.0379862)
------------------------------------------------------------
#Fit statistic : Chi-Squared =          62.12 using 59 PHA bins.
# Reduced chi-squared =          1.130 for     55 degrees of freedom
# Null hypothesis probability =   2.373262e-01

Energy  Fluence     90% Error
[keV]   [erg/cm2]   [erg/cm2]
15- 25  4.419e-09   2.662e-09
25- 50  1.771e-08   1.018e-08
50-150  6.208e-08   3.407e-08
15-150  8.421e-08   4.275e-08
Pre-slew spectrum (Pre-slew PHA with pre-slew DRM)
Power-law model

Spectral model in power-law:
------------------------------------------------------------
Parameters  : value       lower 90%   higher 90%
Photon index: 1.16391     ( -0.0923623   0.091223 )
Norm@50keV  : 4.72926E-03    ( -0.000263175   0.000263032 )
------------------------------------------------------------
#Fit statistic : Chi-Squared =          79.12 using 59 PHA bins.
# Reduced chi-squared =          1.388 for     57 degrees of freedom
# Null hypothesis probability =   2.791850e-02

Photon flux (15-150 keV)    in 18.98 sec: 0.552464 ( -0.0320036  0.0320661 ) ph/cm2/s
Energy fluence (15-150 keV)             : 9.20219e-07 ( -5.44069e-08  5.45487e-08 ) ergs/cm2
Cutoff power-law model

Spectral model in the cutoff power-law:
------------------------------------------------------------
Parameters  : value       lower 90%   higher 90%
Photon index: 2.61483E-02     ( -0.484268   0.434201 )
Epeak [keV] : 96.4443      ( -13.6452 25.8368 )
Norm@50keV  : 1.55880E-02    ( -0.00554517   0.00966251 )
------------------------------------------------------------
#Fit statistic : Chi-Squared =          55.66 using 59 PHA bins.
# Reduced chi-squared =         0.9939 for     56 degrees of freedom
# Null hypothesis probability =   4.877792e-01

Photon flux (15-150 keV)    in 18.98 sec: 0.526173 ( -0.033455  0.033484 ) ph/cm2/s
Energy fluence (15-150 keV)             : 8.68777e-07 ( -5.85457e-08  5.86159e-08 ) ergs/cm2
Band function

Spectral model in the Band function:
------------------------------------------------------------
Parameters  : value       lower 90%   higher 90%
alpha       : -2.59641E-02   ( -0.369463   0.485047 )
beta        : -10.0000    ( 10   3.55271e-15 )
Epeak [keV] : 96.4249      ( -9.33095 25.8534 )
Norm@50keV   : 1.55920E-02    ( -0.00554583   0.00967218 )
------------------------------------------------------------
#Fit statistic : Chi-Squared =          55.66 using 59 PHA bins.
# Reduced chi-squared =          1.012 for     55 degrees of freedom
# Null hypothesis probability =   4.498675e-01

Photon flux (15-150 keV)    in 18.98 sec: 0.530358 (    ) ph/cm2/s
Energy fluence (15-150 keV)             : 8.68521e-07 ( 0  0 ) ergs/cm2
S(25-50 keV) vs. S(50-100 keV) plot

S(25-50 keV)  = 9.82e-07
S(50-100 keV) = 1.12e-06
T90 vs. Hardness ratio plot

T90                                   = 487.339999973774 sec.
Hardness ratio (energy fluence ratio) = 1.14053
Color vs. Color plot
Count Ratio  (25-50 keV) / (15-25 keV) = 1.2162
Count Ratio (50-100 keV) / (15-25 keV) = 0.742452
Mask shadow pattern

IMX = 5.538270890846754E-01, IMY = 7.087916796494229E-02
TIME vs. PHA plot around the trigger time
Blue+Cyan dotted lines: Time interval of the scaled map
From 0.000000 to 1.024000
TIME vs. DetID plot around the trigger time
Blue+Cyan dotted lines: Time interval of the scaled map
From 0.000000 to 1.024000
100 us light curve (15-350 keV)

Blue+Cyan dotted lines: Time interval of the scaled map
From 0.000000 to 1.024000
Spacecraft aspect plot
Bright source in the pre-burst/pre-slew/post-slew images
Pre-burst image of 15-350 keV band
Time interval of the image:
-169.107380 -3.292000

# RAcent  DECcent POSerr Theta    Phi  PeakCts   SNR AngSep     Name
#  [deg]    [deg]    ['] [deg]  [deg]                   [']
254.6646  35.3877    0.0  46.4 -172.8   0.8432   3.4   10.5	Her X-1
299.5937  35.1942    1.5  20.9  135.7   1.1223   7.6    0.5	Cyg X-1
308.1228  40.9147    1.8  12.6  124.4   0.8139   6.4    2.3	Cyg X-3
326.2042  38.3035    4.2  15.2   63.7   0.3468   2.7    1.9	Cyg X-2
320.2826  24.9312    2.7  27.2   85.9   0.7971   4.3 ------	UNKNOWN
310.1552  49.8206    2.3   4.8  157.7   0.6622   5.1 ------	UNKNOWN
 29.5319  33.7078    2.2  53.8   -7.7   2.0997   5.2 ------	UNKNOWN
  1.3153  64.2938    2.6  25.7  -42.9   0.6314   4.5 ------	UNKNOWN
225.5724  56.7755    3.5  49.3 -133.6   2.0748   3.4 ------	UNKNOWN
Pre-slew background subtracted image of 15-350 keV band
Time interval of the image:
-3.292000 15.692610

# RAcent  DECcent POSerr Theta    Phi  PeakCts   SNR AngSep     Name
#  [deg]    [deg]    ['] [deg]  [deg]                   [']
254.4431  35.3179   10.0  46.5 -172.8   0.0915   1.2    1.6	Her X-1
299.7138  35.3715   21.4  20.7  135.7   0.0269   0.5   11.9	Cyg X-1
307.9266  40.8893    8.7  12.7  125.0   0.0565   1.3    9.2	Cyg X-3
326.0015  38.4782    0.0  15.0   64.0  -0.0264  -0.6   12.3	Cyg X-2
  2.4796  47.7542    0.4  29.2   -7.3   1.3625  27.7 ------	UNKNOWN
 14.6587  47.9415    2.5  36.4  -14.5   0.2646   4.6 ------	UNKNOWN
240.3458  37.8724    2.4  53.3 -160.5   0.6074   4.9 ------	UNKNOWN
Post-slew image of 15-350 keV band
Time interval of the image:
68.692580 962.862000

# RAcent  DECcent POSerr Theta    Phi  PeakCts   SNR AngSep     Name
#  [deg]    [deg]    ['] [deg]  [deg]                   [']
299.6183  35.3229    5.8  47.3  141.0   3.5650   2.0    7.4	Cyg X-1
308.0887  40.9851    2.9  38.6  142.8   3.6833   3.9    2.2	Cyg X-3
326.1622  38.1994    4.0  27.9  125.6   1.6862   2.9    7.3	Cyg X-2
 20.2566  -2.9750    3.1  53.1   19.7   7.1540   3.8 ------	UNKNOWN
  2.4526  47.7501    1.0   0.0 -165.9   4.6493  11.3 ------	UNKNOWN
 36.8820  -0.8340    3.3  57.0   -0.2   7.2683   3.5 ------	UNKNOWN
 32.1470  13.3000    3.1  42.4   -3.5   2.4713   3.7 ------	UNKNOWN
249.2513  61.0945    3.0  58.7 -169.2  10.6421   3.8 ------	UNKNOWN
 47.0953  17.2145    2.8  47.5  -23.5   3.4666   4.0 ------	UNKNOWN
234.7349  66.9036    3.8  58.7 -159.2  12.8138   3.0 ------	UNKNOWN
143.3939  83.9614    2.9  47.1 -132.7   6.4749   4.0 ------	UNKNOWN
 63.2494  33.4410    4.5  47.0  -53.3   5.6711   2.6 ------	UNKNOWN
Plot creation:
Sun May 31 00:17:44 EDT 2015