Click here for the BAT GCN circular template
Image
Pre-slew 15.0-350.0 keV image (Event data)
#   RAcent    DECcent   POSerr    Theta     Phi              Peak Cts       SNR   Name
  299.8453    52.6179   0.0175    39.1413   157.1786         0.8059237     10.947 TRIG_00430957

Foreground time interval of the image:
 -1.352  17.108 (delta_t =  18.460 [sec])
Background time interval of the image:
-239.320  -1.352 (delta_t = 237.968 [sec])
Lightcurves
Notes:
- 1) The mask-weighted light curves are using the flight position.
- 2) Multiple plots of different time binning/intervals are shown to cover all scenarios of short/long GRBs, rate/image triggers, and real/false positives.
- 3) For all the mask-weighted lightcurves, the y-axis units are counts/sec/det where a det is 0.4 x 0.4 = 0.16 sq cm.
- 4) The verticle lines correspond to following: green dotted lines are T50 interval, black dotted lines are T90 interval, blue solid line(s) is a spacecraft slew start time, and orange solid line(s) is a spacecraft slew end time.
- 5) Time of each bin is in the middle of the bin.
1 s binning
From T0-310 s to T0+310 s

From T100_start - 20 s to T100_end + 30 s

Full time interval

64 ms binning
Full time interval
From T100_start to T100_end

From T0-5 sec to T0+5 sec
16 ms binning
From T100_start-5 s to T100_start+5 s
Blue+Cyan dotted lines: Time interval of the scaled map
From 0.000000 to 8.192000
8 ms binning
From T100_start-3 s to T100_start+3 s
Blue+Cyan dotted lines: Time interval of the scaled map
From 0.000000 to 8.192000
2 ms binning
From T100_start-1 s to T100_start+1 s
Blue+Cyan dotted lines: Time interval of the scaled map
From 0.000000 to 8.192000
SN=5 or 10 sec. binning (whichever binning is satisfied first)

SN=5 or 10 sec. binning (T < 200 sec)

Quad-rate summed light curves (from T0-300s to T0+1000s)
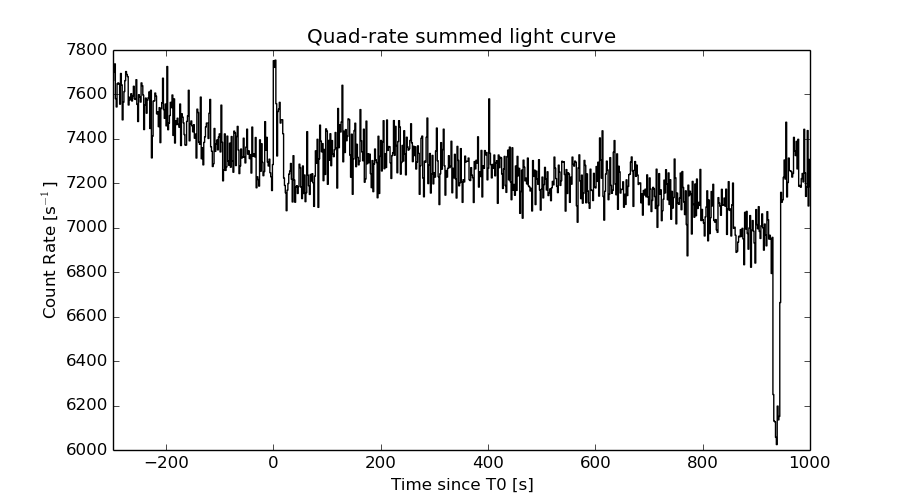
The mask-weighted light curves based on cleaned DPHs

Spectral Evolution

Spectra
Notes:
- 1) The fitting includes the systematic errors.
- 2) When the burst includes telescope slew time periods, the fitting uses an average response file made from multiple 5-s response files through out the slew time plus single time preiod for the non-slew times, and weighted by the total counts in the corresponding time period using addrmf. An average response file is needed becuase a spectral fit using the pre-slew DRM will introduce some errors in both a spectral shape and a normalization if the PHA file contains a lot of the slew/post-slew time interval.
- 3) For fits to more complicated models (e.g. a power-law over a cutoff power-law), the BAT team has decided to require a chi-square improvement of more than 6 for each extra dof.
Time averaged spectrum fit using the average DRM
Power-law model

Time interval is from   -1.352 sec. to   17.108 sec.

Spectral model in power-law:
------------------------------------------------------------
Parameters  : value       lower 90%   higher 90%
Photon index: 1.75566     ( -0.227195   0.238053 )
Norm@50keV  : 2.97551E-03    ( -0.000432597   0.000423918 )
------------------------------------------------------------
#Fit statistic : Chi-Squared =          65.39 using 59 PHA bins.
# Reduced chi-squared =          1.147 for     57 degrees of freedom
# Null hypothesis probability =   2.083670e-01

Photon flux (15-150 keV)    in 18.46 sec: 0.403181 ( -0.0530318  0.0531035 ) ph/cm2/s
Energy fluence (15-150 keV)             : 5.06679e-07 ( -7.51564e-08  7.6305e-08 ) ergs/cm2
Cutoff power-law model

Time interval is from   -1.352 sec. to   17.108 sec.
Spectral model in the cutoff power-law:
------------------------------------------------------------
Parameters  : value       lower 90%   higher 90%
Photon index: 1.17178     ( -1.07525   0.931142 )
Epeak [keV] : 68.2514      ( -39.0763 -68.2514 )
Norm@50keV  : 6.00305E-03    ( -0.00600307   0.0151835 )
------------------------------------------------------------
#Fit statistic : Chi-Squared =          64.17 using 59 PHA bins.
# Reduced chi-squared =          1.146 for     56 degrees of freedom
# Null hypothesis probability =   2.120036e-01

Photon flux (15-150 keV)    in 18.46 sec: 0.393337 ( -0.055388  0.055121 ) ph/cm2/s
Energy fluence (15-150 keV)             : 4.87224e-07 ( -7.9786e-08  8.19052e-08 ) ergs/cm2
Band function

Time interval is from   -1.352 sec. to   17.108 sec.

Spectral model in the Band function:
------------------------------------------------------------
Parameters  : value       lower 90%   higher 90%
alpha       : -1.17177   ( -0.546673   1.31313 )
beta        : -10.0000    ( 10   3.55271e-15 )
Epeak [keV] : 68.2305      ( -22.7428 -68.2305 )
Norm@50keV   : 6.00289E-03    ( -0.00329438   0.015185 )
------------------------------------------------------------
#Fit statistic : Chi-Squared =          64.17 using 59 PHA bins.
# Reduced chi-squared =          1.167 for     55 degrees of freedom
# Null hypothesis probability =   1.860418e-01

Photon flux (15-150 keV)    in 18.46 sec: 0.393402 ( 6.6066  -0.05546 ) ph/cm2/s
Energy fluence (15-150 keV)             : 4.85149e-07 ( 0  0 ) ergs/cm2
Single BB

Spectral model blackbody:
------------------------------------------------------------
Parameters  : value    Lower 90%  Upper 90%
kT [keV]    : 13.3965  (-2.02506  2.33718)
R^2/D10^2   : 6.56192E-02  (-0.0290745   0.0534682)
(R is the radius in km and D10 is the distance to the source in units of 10 kpc)
------------------------------------------------------------
#Fit statistic : Chi-Squared =          76.21 using 59 PHA bins.
# Reduced chi-squared =          1.337 for     57 degrees of freedom
# Null hypothesis probability =   4.550446e-02

Energy  Fluence     90% Error
[keV]   [erg/cm2]   [erg/cm2]
15- 25  4.607e-08   1.260e-08
25- 50  1.638e-07   3.159e-08
50-150  1.891e-07   5.179e-08
15-150  3.989e-07   6.950e-08
Thermal bremsstrahlung (OTTB)

Spectral model: thermal bremsstrahlung
------------------------------------------------------------
Parameters  : value         Lower 90%    Upper 90%
kT [keV]    : 120.983       (-46.8418      -117.98)
Norm        : 1.69729       (-0.247042     0.357295)
------------------------------------------------------------
#Fit statistic : Chi-Squared =          64.30 using 59 PHA bins.
# Reduced chi-squared =          1.128 for     57 degrees of freedom
# Null hypothesis probability =   2.363031e-01

Energy  Fluence     90% Error
[keV]   [erg/cm2]   [erg/cm2]
15- 25  8.158e-08   1.499e-08
25- 50  1.462e-07   3.216e-08
50-150  2.619e-07   1.634e-07
15-150  4.896e-07   1.922e-07
Double BB
Spectral model: bbodyrad<1> + bbodyrad<2>
------------------------------------------------------------
Parameters  : value         Lower 90%    Upper 90%
kT1 [keV]   : 4.47527        (-2.43323      2.78444)
R1^2/D10^2  : 2.23205        (-1.88947      184.402)
kT2 [keV]   : 17.8568        (-3.84516      6.52569)
R2^2/D10^2  : 1.97671E-02    (-0.0141834   0.0322275)
------------------------------------------------------------
#Fit statistic : Chi-Squared =          62.92 using 59 PHA bins.
# Reduced chi-squared =          1.144 for     55 degrees of freedom
# Null hypothesis probability =   2.164230e-01

Energy  Fluence     90% Error
[keV]   [erg/cm2]   [erg/cm2]
15- 25  8.629e-08   4.572e-08
25- 50  1.383e-07   6.013e-08
50-150  2.487e-07   1.204e-07
15-150  4.733e-07   1.960e-07
Peak spectrum fit
Power-law model

Time interval is from    1.972 sec. to    2.972 sec.

Spectral model in power-law:
------------------------------------------------------------
Parameters  : value       lower 90%   higher 90%
Photon index: 1.64664     ( -0.536728   0.578973 )
Norm@50keV  : 5.38221E-03    ( -0.00185399   0.00178454 )
------------------------------------------------------------
#Fit statistic : Chi-Squared =          56.94 using 59 PHA bins.
# Reduced chi-squared =         0.9990 for     57 degrees of freedom
# Null hypothesis probability =   4.772673e-01

Photon flux (15-150 keV)    in 1 sec: 0.702009 ( -0.222465  0.223094 ) ph/cm2/s
Energy fluence (15-150 keV)             : 5.00736e-08 ( -1.75521e-08  1.81638e-08 ) ergs/cm2
Cutoff power-law model
Time interval is from    1.972 sec. to    2.972 sec.
Spectral model in the cutoff power-law:
------------------------------------------------------------
Parameters  : value       lower 90%   higher 90%
Photon index: 0.638310     ( -7.45591   1.58505 )
Epeak [keV] : 61.9807      ( -61.7724 -61.7724 )
Norm@50keV  : 1.88218E-02    ( -0.0191322   164.474 )
------------------------------------------------------------
#Fit statistic : Chi-Squared =          56.54 using 59 PHA bins.
# Reduced chi-squared =          1.010 for     56 degrees of freedom
# Null hypothesis probability =   4.545530e-01

Photon flux (15-150 keV)    in 1 sec: 0.675401 ( -0.260206  0.23496 ) ph/cm2/s
Energy fluence (15-150 keV)             : 4.59299e-08 ( -1.97968e-08  2.09423e-08 ) ergs/cm2
Band function

Time interval is from    1.972 sec. to    2.972 sec.

Spectral model in the Band function:
------------------------------------------------------------
Parameters  : value       lower 90%   higher 90%
alpha       : -3.34246E-02   ( 0.984441   0.984441 )
beta        : -2.48697    ( 2.035   2.27323 )
Epeak [keV] : 53.1387      ( -52.9339 217.602 )
Norm@50keV   : 4.11134E-02    ( -0.0460119   990704 )
------------------------------------------------------------
#Fit statistic : Chi-Squared =          56.24 using 59 PHA bins.
# Reduced chi-squared =          1.023 for     55 degrees of freedom
# Null hypothesis probability =   4.280916e-01

Photon flux (15-150 keV)    in 1 sec:  (    ) ph/cm2/s
Energy fluence (15-150 keV)             : 4.62148e-08 ( 0  0 ) ergs/cm2
Single BB
Spectral model blackbody:
------------------------------------------------------------
Parameters  : value    Lower 90%  Upper 90%
kT [keV]    : 12.4490  (-3.37345  5.31776)
R^2/D10^2   : 0.156695  (-0.156694   0.340815)
(R is the radius in km and D10 is the distance to the source in units of 10 kpc)
------------------------------------------------------------
#Fit statistic : Chi-Squared =          57.04 using 59 PHA bins.
# Reduced chi-squared =          1.001 for     57 degrees of freedom
# Null hypothesis probability =   4.735597e-01

Energy  Fluence     90% Error
[keV]   [erg/cm2]   [erg/cm2]
15- 25  5.148e-09   3.262e-09
25- 50  1.690e-08   1.059e-08
50-150  1.613e-08   1.147e-08
15-150  3.818e-08   2.481e-08
Thermal bremsstrahlung (OTTB)
Spectral model: thermal bremsstrahlung
------------------------------------------------------------
Parameters  : value         Lower 90%    Upper 90%
kT [keV]    : 158.142       (      )
Norm        : 2.89365       (-0.932232     1.59653)
------------------------------------------------------------
#Fit statistic : Chi-Squared =          56.69 using 59 PHA bins.
# Reduced chi-squared =         0.9945 for     57 degrees of freedom
# Null hypothesis probability =   4.866990e-01

Energy  Fluence     90% Error
[keV]   [erg/cm2]   [erg/cm2]
15- 25  7.200e-09   4.515e-09
25- 50  1.369e-08   8.225e-09
50-150  2.907e-08   1.777e-08
15-150  4.996e-08   3.012e-08
Double BB

Spectral model: bbodyrad<1> + bbodyrad<2>
------------------------------------------------------------
Parameters  : value         Lower 90%    Upper 90%
kT1 [keV]   : 1.41727        (-1.40976      14.5593)
R1^2/D10^2  : 6118.08        (-6749.77      -6749.77)
kT2 [keV]   : 13.2151        (-3.73205      -13.2073)
R2^2/D10^2  : 0.121486    (-0.122013   0.157963)
------------------------------------------------------------
#Fit statistic : Chi-Squared =          55.89 using 59 PHA bins.
# Reduced chi-squared =          1.016 for     55 degrees of freedom
# Null hypothesis probability =   4.411727e-01

Energy  Fluence     90% Error
[keV]   [erg/cm2]   [erg/cm2]
15- 25  6.151e-09   2.959e-09
25- 50  1.577e-08   9.595e-09
50-150  1.757e-08   1.263e-08
15-150  3.950e-08   2.445e-08
Pre-slew spectrum (Pre-slew PHA with pre-slew DRM)
Power-law model

Spectral model in power-law:
------------------------------------------------------------
Parameters  : value       lower 90%   higher 90%
Photon index: 1.75566     ( -0.227195   0.238053 )
Norm@50keV  : 2.97551E-03    ( -0.000432597   0.000423918 )
------------------------------------------------------------
#Fit statistic : Chi-Squared =          65.39 using 59 PHA bins.
# Reduced chi-squared =          1.147 for     57 degrees of freedom
# Null hypothesis probability =   2.083670e-01

Photon flux (15-150 keV)    in 18.46 sec: 0.403181 ( -0.0530318  0.0531035 ) ph/cm2/s
Energy fluence (15-150 keV)             : 5.06679e-07 ( -7.51564e-08  7.6305e-08 ) ergs/cm2
Cutoff power-law model

Spectral model in the cutoff power-law:
------------------------------------------------------------
Parameters  : value       lower 90%   higher 90%
Photon index: 1.17178     ( -1.07525   0.931142 )
Epeak [keV] : 68.2514      ( -39.0763 -68.2514 )
Norm@50keV  : 6.00305E-03    ( -0.00600307   0.0151835 )
------------------------------------------------------------
#Fit statistic : Chi-Squared =          64.17 using 59 PHA bins.
# Reduced chi-squared =          1.146 for     56 degrees of freedom
# Null hypothesis probability =   2.120036e-01

Photon flux (15-150 keV)    in 18.46 sec: 0.393337 ( -0.055388  0.055121 ) ph/cm2/s
Energy fluence (15-150 keV)             : 4.87224e-07 ( -7.9786e-08  8.19052e-08 ) ergs/cm2
Band function
Spectral model in the Band function:
------------------------------------------------------------
Parameters  : value       lower 90%   higher 90%
alpha       : -1.17177   ( -0.546673   1.31313 )
beta        : -10.0000    ( 10   0 )
Epeak [keV] : 68.2305      ( -22.7428 -68.2305 )
Norm@50keV   : 6.00289E-03    ( -0.00329438   0.015185 )
------------------------------------------------------------
#Fit statistic : Chi-Squared =          64.17 using 59 PHA bins.
# Reduced chi-squared =          1.167 for     55 degrees of freedom
# Null hypothesis probability =   1.860418e-01

Photon flux (15-150 keV)    in 18.46 sec: 0.393402 ( 6.6066  -0.05546 ) ph/cm2/s
Energy fluence (15-150 keV)             : 4.85149e-07 ( 0  0 ) ergs/cm2
S(25-50 keV) vs. S(50-100 keV) plot
S(25-50 keV)  = 1.40e-07
S(50-100 keV) = 1.66e-07
T90 vs. Hardness ratio plot
T90                                   = 16.7359999418259 sec.
Hardness ratio (energy fluence ratio) = 1.18571
Color vs. Color plot
Count Ratio  (25-50 keV) / (15-25 keV) = 1.22204
Count Ratio (50-100 keV) / (15-25 keV) = 0.914082
Mask shadow pattern

IMX = -7.501646146142072E-01, IMY = -3.156705144955707E-01
TIME vs. PHA plot around the trigger time

Blue+Cyan dotted lines: Time interval of the scaled map
From 0.000000 to 8.192000
TIME vs. DetID plot around the trigger time

Blue+Cyan dotted lines: Time interval of the scaled map
From 0.000000 to 8.192000
100 us light curve (15-350 keV)
Blue+Cyan dotted lines: Time interval of the scaled map
From 0.000000 to 8.192000
Spacecraft aspect plot

Bright source in the pre-burst/pre-slew/post-slew images
Pre-burst image of 15-350 keV band
Time interval of the image:
-239.320000 -1.352000

# RAcent  DECcent POSerr Theta    Phi  PeakCts   SNR AngSep     Name
#  [deg]    [deg]    ['] [deg]  [deg]                   [']
299.5836  35.1243    3.2  47.4  134.6   2.8771   3.6    4.6	Cyg X-1
308.1067  40.9422    2.0  38.7  136.5   2.3339   5.8    0.6	Cyg X-3
326.1852  38.3466    5.0  27.8  119.7   0.5701   2.3    1.6	Cyg X-2
309.9982  39.1626    2.1  38.3  132.9   2.2709   5.6 ------	UNKNOWN
 35.8944   4.7886    2.9  51.6   -8.6   1.6163   4.0 ------	UNKNOWN
241.7174  75.4717    2.4  51.0 -160.3   2.0232   4.9 ------	UNKNOWN
 59.7947  29.7415    4.5  47.0  -53.1   2.2284   2.6 ------	UNKNOWN
 72.9681  59.8265    3.2  41.2  -98.1   3.3280   3.6 ------	UNKNOWN
Pre-slew background subtracted image of 15-350 keV band
Time interval of the image:
-1.352000 17.108000

# RAcent  DECcent POSerr Theta    Phi  PeakCts   SNR AngSep     Name
#  [deg]    [deg]    ['] [deg]  [deg]                   [']
299.4336  35.2095    3.9  47.5  134.8  -0.6162  -2.9    7.7	Cyg X-1
308.2649  40.8064    9.1  38.6  136.2  -0.1172  -1.3   11.2	Cyg X-3
326.0069  38.3022    8.8  28.0  119.8  -0.0780  -1.3    7.8	Cyg X-2
299.8453  52.6178    1.0  39.1  157.2   0.8059  10.9 ------	UNKNOWN
 44.3607   1.0611    2.6  59.0  -15.2   1.0119   4.3 ------	UNKNOWN
Post-slew image of 15-350 keV band
Time interval of the image:
110.380600 918.180620

# RAcent  DECcent POSerr Theta    Phi  PeakCts   SNR AngSep     Name
#  [deg]    [deg]    ['] [deg]  [deg]                   [']
254.5679  35.4634    8.8  36.0 -174.4  -0.6460  -1.3    9.0	Her X-1
299.6006  35.2018    0.5  17.4  106.4   9.3784  21.4    0.5	Cyg X-1
308.0989  40.9552    0.6  12.9   76.8   7.3066  18.8    0.5	Cyg X-3
326.2452  38.1803    9.6  23.3   43.5   0.5354   1.2    9.2	Cyg X-2
260.7195  50.7251    3.0  24.1 -153.1   1.6860   3.8 ------	UNKNOWN
 27.1016  48.5249    2.2  52.1  -17.3   5.4324   5.2 ------	UNKNOWN
 55.8109  72.9186    4.0  47.0  -53.2   7.4189   2.9 ------	UNKNOWN
Plot creation:
Sun May 31 00:15:42 EDT 2015