Special notes of this burst
Image
Pre-slew 15.0-350.0 keV image (Event data)

#   RAcent    DECcent   POSerr    Theta     Phi              Peak Cts       SNR   Name
   55.2995    67.6649   0.0148    32.9709  -110.1038         0.6500968     13.038 TRIG_00431128

Foreground time interval of the image:
 -6.080   3.136 (delta_t =   9.216 [sec])
Background time interval of the image:
-239.680  -6.080 (delta_t = 233.600 [sec])
Lightcurves
Notes:
- 1) The mask-weighted light curves are using the flight position.
- 2) Multiple plots of different time binning/intervals are shown to cover all scenarios of short/long GRBs, rate/image triggers, and real/false positives.
- 3) For all the mask-weighted lightcurves, the y-axis units are counts/sec/det where a det is 0.4 x 0.4 = 0.16 sq cm.
- 4) The verticle lines correspond to following: green dotted lines are T50 interval, black dotted lines are T90 interval, blue solid line(s) is a spacecraft slew start time, and orange solid line(s) is a spacecraft slew end time.
- 5) Time of each bin is in the middle of the bin.
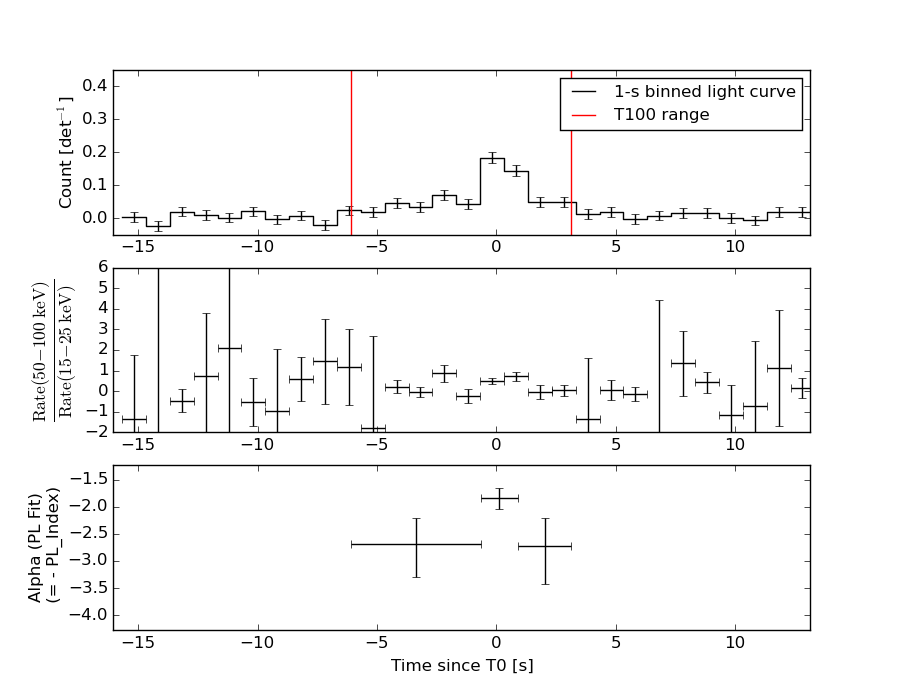
1 s binning
From T0-310 s to T0+310 s

From T100_start - 20 s to T100_end + 30 s

Full time interval

64 ms binning
Full time interval

From T100_start to T100_end

From T0-5 sec to T0+5 sec

16 ms binning
From T100_start-5 s to T100_start+5 s

Blue+Cyan dotted lines: Time interval of the scaled map
From 0.000000 to 1.024000
8 ms binning
From T100_start-3 s to T100_start+3 s

Blue+Cyan dotted lines: Time interval of the scaled map
From 0.000000 to 1.024000
2 ms binning
From T100_start-1 s to T100_start+1 s

Blue+Cyan dotted lines: Time interval of the scaled map
From 0.000000 to 1.024000
SN=5 or 10 sec. binning (whichever binning is satisfied first)

SN=5 or 10 sec. binning (T < 200 sec)

Quad-rate summed light curves (from T0-300s to T0+1000s)

The mask-weighted light curves based on cleaned DPHs

Spectral Evolution
Spectra
Notes:
- 1) The fitting includes the systematic errors.
- 2) When the burst includes telescope slew time periods, the fitting uses an average response file made from multiple 5-s response files through out the slew time plus single time preiod for the non-slew times, and weighted by the total counts in the corresponding time period using addrmf. An average response file is needed becuase a spectral fit using the pre-slew DRM will introduce some errors in both a spectral shape and a normalization if the PHA file contains a lot of the slew/post-slew time interval.
- 3) For fits to more complicated models (e.g. a power-law over a cutoff power-law), the BAT team has decided to require a chi-square improvement of more than 6 for each extra dof.
Time averaged spectrum fit using the average DRM
Power-law model

Time interval is from   -6.080 sec. to    3.136 sec.

Spectral model in power-law:
------------------------------------------------------------
Parameters  : value       lower 90%   higher 90%
Photon index: 2.32094     ( -0.224106   0.243463 )
Norm@50keV  : 3.79747E-03    ( -0.000648869   0.000636276 )
------------------------------------------------------------
#Fit statistic : Chi-Squared =          49.10 using 59 PHA bins.
# Reduced chi-squared =         0.8615 for     57 degrees of freedom
# Null hypothesis probability =   7.622584e-01

Photon flux (15-150 keV)    in 9.216 sec: 0.671458 ( -0.0742514  0.0742526 ) ph/cm2/s
Energy fluence (15-150 keV)             : 3.3576e-07 ( -4.57455e-08  4.71879e-08 ) ergs/cm2
Cutoff power-law model

Time interval is from   -6.080 sec. to    3.136 sec.
Spectral model in the cutoff power-law:
------------------------------------------------------------
Parameters  : value       lower 90%   higher 90%
Photon index: 1.58739     (     )
Epeak [keV] : 20.3693      (   )
Norm@50keV  : 1.09848E-02    ( -0.0108887   0.122526 )
------------------------------------------------------------
#Fit statistic : Chi-Squared =          47.95 using 59 PHA bins.
# Reduced chi-squared =         0.8563 for     56 degrees of freedom
# Null hypothesis probability =   7.692493e-01

Photon flux (15-150 keV)    in 9.216 sec: 0.655124 ( -0.078692  0.078516 ) ph/cm2/s
Energy fluence (15-150 keV)             : 3.09257e-07 ( -5.48251e-08  6.22909e-08 ) ergs/cm2
Band function

Time interval is from   -6.080 sec. to    3.136 sec.

Spectral model in the Band function:
------------------------------------------------------------
Parameters  : value       lower 90%   higher 90%
alpha       : -0.970309   ( 0.81885   0.81885 )
beta        : -2.73464    ( 2.79009   0.550737 )
Epeak [keV] : 24.6113      ( -25.4544 7.43161 )
Norm@50keV   : 2.97927E-02    ( -0.0427724   2299.69 )
------------------------------------------------------------
#Fit statistic : Chi-Squared =          46.76 using 59 PHA bins.
# Reduced chi-squared =         0.8502 for     55 degrees of freedom
# Null hypothesis probability =   7.776114e-01

Photon flux (15-150 keV)    in 9.216 sec:  (    ) ph/cm2/s
Energy fluence (15-150 keV)             : 0 ( 0  0 ) ergs/cm2
Single BB

Spectral model blackbody:
------------------------------------------------------------
Parameters  : value    Lower 90%  Upper 90%
kT [keV]    : 7.75697  (-0.876953  0.986013)
R^2/D10^2   : 0.832092  (-0.321724   0.528818)
(R is the radius in km and D10 is the distance to the source in units of 10 kpc)
------------------------------------------------------------
#Fit statistic : Chi-Squared =          55.54 using 59 PHA bins.
# Reduced chi-squared =         0.9744 for     57 degrees of freedom
# Null hypothesis probability =   5.299443e-01

Energy  Fluence     90% Error
[keV]   [erg/cm2]   [erg/cm2]
15- 25  8.147e-08   1.325e-08
25- 50  1.351e-07   2.212e-08
50-150  3.201e-08   1.253e-08
15-150  2.485e-07   3.677e-08
Thermal bremsstrahlung (OTTB)

Spectral model: thermal bremsstrahlung
------------------------------------------------------------
Parameters  : value         Lower 90%    Upper 90%
kT [keV]    : 38.3726       (-9.64603      14.5539)
Norm        : 4.45606       (-0.921139     1.22208)
------------------------------------------------------------
#Fit statistic : Chi-Squared =          48.02 using 59 PHA bins.
# Reduced chi-squared =         0.8425 for     57 degrees of freedom
# Null hypothesis probability =   7.956813e-01

Energy  Fluence     90% Error
[keV]   [erg/cm2]   [erg/cm2]
15- 25  9.295e-08   1.303e-08
25- 50  1.201e-07   1.668e-08
50-150  8.871e-08   3.183e-08
15-150  3.017e-07   4.649e-08
Double BB

Spectral model: bbodyrad<1> + bbodyrad<2>
------------------------------------------------------------
Parameters  : value         Lower 90%    Upper 90%
kT1 [keV]   : 6.73359        (-1.59193      1.16077)
R1^2/D10^2  : 1.33947        (-0.609286      0.833629)
kT2 [keV]   : 33.1377        (-20.0112      -33.1348)
R2^2/D10^2  : 1.49428E-03    (-0.00144485   0.0221046)
------------------------------------------------------------
#Fit statistic : Chi-Squared =          46.76 using 59 PHA bins.
# Reduced chi-squared =         0.8502 for     55 degrees of freedom
# Null hypothesis probability =   7.775290e-01

Energy  Fluence     90% Error
[keV]   [erg/cm2]   [erg/cm2]
15- 25  8.844e-08   2.414e-08
25- 50  1.236e-07   3.617e-08
50-150  1.213e-07   6.408e-08
15-150  3.333e-07   1.052e-07
Peak spectrum fit
Power-law model

Time interval is from   -0.340 sec. to    0.660 sec.

Spectral model in power-law:
------------------------------------------------------------
Parameters  : value       lower 90%   higher 90%
Photon index: 1.62671     ( -0.205778   0.211092 )
Norm@50keV  : 1.40772E-02    ( -0.00187235   0.00185385 )
------------------------------------------------------------
#Fit statistic : Chi-Squared =          57.32 using 59 PHA bins.
# Reduced chi-squared =          1.006 for     57 degrees of freedom
# Null hypothesis probability =   4.631439e-01

Photon flux (15-150 keV)    in 1 sec: 1.82427 ( -0.233919  0.234233 ) ph/cm2/s
Energy fluence (15-150 keV)             : 1.31245e-07 ( -1.83973e-08  1.85784e-08 ) ergs/cm2
Cutoff power-law model

Time interval is from   -0.340 sec. to    0.660 sec.
Spectral model in the cutoff power-law:
------------------------------------------------------------
Parameters  : value       lower 90%   higher 90%
Photon index: 0.864920     ( -1.00529   0.818519 )
Epeak [keV] : 72.8581      ( -20.1085 -72.8581 )
Norm@50keV  : 3.49781E-02    ( -0.0214037   0.0783594 )
------------------------------------------------------------
#Fit statistic : Chi-Squared =          54.82 using 59 PHA bins.
# Reduced chi-squared =         0.9790 for     56 degrees of freedom
# Null hypothesis probability =   5.194040e-01

Photon flux (15-150 keV)    in 1 sec: 1.78171 ( -0.23931  0.23912 ) ph/cm2/s
Energy fluence (15-150 keV)             : 1.25639e-07 ( -1.9395e-08  1.9637e-08 ) ergs/cm2
Band function

Time interval is from   -0.340 sec. to    0.660 sec.
XSPEC12>exit
 XSPEC: quit


Spectral model in the Band function:
------------------------------------------------------------
Parameters  : value       lower 90%   higher 90%
alpha       :    (     )
beta        :     (     )
Epeak [keV] :       (   )
Norm@50keV   :     (     )
------------------------------------------------------------

Photon flux (15-150 keV)    in 1 sec: 1.78838 ( 5.21162  -0.24451 ) ph/cm2/s
Energy fluence (15-150 keV)             : 1.26044e-07 ( 0  0 ) ergs/cm2
Single BB

Spectral model blackbody:
------------------------------------------------------------
Parameters  : value    Lower 90%  Upper 90%
kT [keV]    : 13.8776  (-1.99531  2.35764)
R^2/D10^2   : 0.274705  (-0.119143   0.20592)
(R is the radius in km and D10 is the distance to the source in units of 10 kpc)
------------------------------------------------------------
#Fit statistic : Chi-Squared =          65.92 using 59 PHA bins.
# Reduced chi-squared =          1.157 for     57 degrees of freedom
# Null hypothesis probability =   1.955639e-01

Energy  Fluence     90% Error
[keV]   [erg/cm2]   [erg/cm2]
15- 25  1.118e-08   2.697e-09
25- 50  4.123e-08   7.365e-09
50-150  5.205e-08   1.246e-08
15-150  1.045e-07   1.974e-08
Thermal bremsstrahlung (OTTB)

Spectral model: thermal bremsstrahlung
------------------------------------------------------------
Parameters  : value         Lower 90%    Upper 90%
kT [keV]    : 161.862       (-68.7288      -160.312)
Norm        : 7.54193       (-1.01083     1.3014)
------------------------------------------------------------
#Fit statistic : Chi-Squared =          55.47 using 59 PHA bins.
# Reduced chi-squared =         0.9732 for     57 degrees of freedom
# Null hypothesis probability =   5.325744e-01

Energy  Fluence     90% Error
[keV]   [erg/cm2]   [erg/cm2]
15- 25  1.924e-08   1.042e-08
25- 50  3.604e-08   1.948e-08
50-150  7.334e-08   4.231e-08
15-150  1.286e-07   7.025e-08
Double BB

Spectral model: bbodyrad<1> + bbodyrad<2>
------------------------------------------------------------
Parameters  : value         Lower 90%    Upper 90%
kT1 [keV]   : 6.86186        (-3.38249      3.6413)
R1^2/D10^2  : 1.93015        (-1.37818      23.4431)
kT2 [keV]   : 21.8868        (-6.29645      19.4069)
R2^2/D10^2  : 4.00492E-02    (-0.0364625   0.122913)
------------------------------------------------------------
#Fit statistic : Chi-Squared =          54.92 using 59 PHA bins.
# Reduced chi-squared =         0.9985 for     55 degrees of freedom
# Null hypothesis probability =   4.777323e-01

Energy  Fluence     90% Error
[keV]   [erg/cm2]   [erg/cm2]
15- 25  1.785e-08   9.895e-09
25- 50  3.759e-08   1.947e-08
50-150  7.004e-08   3.989e-08
15-150  1.255e-07   6.645e-08
Pre-slew spectrum (Pre-slew PHA with pre-slew DRM)
Power-law model

Spectral model in power-law:
------------------------------------------------------------
Parameters  : value       lower 90%   higher 90%
Photon index: 2.32094     ( -0.224106   0.243463 )
Norm@50keV  : 3.79747E-03    ( -0.000648869   0.000636276 )
------------------------------------------------------------
#Fit statistic : Chi-Squared =          49.10 using 59 PHA bins.
# Reduced chi-squared =         0.8615 for     57 degrees of freedom
# Null hypothesis probability =   7.622584e-01

Photon flux (15-150 keV)    in 9.216 sec: 0.671458 ( -0.0742514  0.0742526 ) ph/cm2/s
Energy fluence (15-150 keV)             : 3.3576e-07 ( -4.57455e-08  4.71879e-08 ) ergs/cm2
Cutoff power-law model

Spectral model in the cutoff power-law:
------------------------------------------------------------
Parameters  : value       lower 90%   higher 90%
Photon index: 1.58739     (     )
Epeak [keV] : 20.3693      (   )
Norm@50keV  : 1.09848E-02    ( -0.0108887   0.122526 )
------------------------------------------------------------
#Fit statistic : Chi-Squared =          47.95 using 59 PHA bins.
# Reduced chi-squared =         0.8563 for     56 degrees of freedom
# Null hypothesis probability =   7.692493e-01

Photon flux (15-150 keV)    in 9.216 sec: 0.655124 ( -0.078692  0.078516 ) ph/cm2/s
Energy fluence (15-150 keV)             : 3.09257e-07 ( -5.48251e-08  6.22909e-08 ) ergs/cm2
Band function

Spectral model in the Band function:
------------------------------------------------------------
Parameters  : value       lower 90%   higher 90%
alpha       : -0.970309   ( 0.81885   0.81885 )
beta        : -2.73464    ( 2.79009   0.550737 )
Epeak [keV] : 24.6113      ( -25.4544 7.43161 )
Norm@50keV   : 2.97927E-02    ( -0.0427724   2299.69 )
------------------------------------------------------------
#Fit statistic : Chi-Squared =          46.76 using 59 PHA bins.
# Reduced chi-squared =         0.8502 for     55 degrees of freedom
# Null hypothesis probability =   7.776114e-01

Photon flux (15-150 keV)    in 9.216 sec:  (    ) ph/cm2/s
Energy fluence (15-150 keV)             : 0 ( 0  0 ) ergs/cm2
S(25-50 keV) vs. S(50-100 keV) plot

S(25-50 keV)  = 1.09e-07
S(50-100 keV) = 8.71e-08
T90 vs. Hardness ratio plot

T90                                   = 7.74400001764297 sec.
Hardness ratio (energy fluence ratio) = 0.799083
Color vs. Color plot
Count Ratio  (25-50 keV) / (15-25 keV) = 0.987087
Count Ratio (50-100 keV) / (15-25 keV) = 0.34169
Mask shadow pattern

IMX = -2.229676086232162E-01, IMY = 6.091630567530077E-01
TIME vs. PHA plot around the trigger time

Blue+Cyan dotted lines: Time interval of the scaled map
From 0.000000 to 1.024000
TIME vs. DetID plot around the trigger time

Blue+Cyan dotted lines: Time interval of the scaled map
From 0.000000 to 1.024000
100 us light curve (15-350 keV)

Blue+Cyan dotted lines: Time interval of the scaled map
From 0.000000 to 1.024000
Spacecraft aspect plot

Bright source in the pre-burst/pre-slew/post-slew images
Pre-burst image of 15-350 keV band
Time interval of the image:
-239.680000 -6.080000

# RAcent  DECcent POSerr Theta    Phi  PeakCts   SNR AngSep     Name
#  [deg]    [deg]    ['] [deg]  [deg]                   [']
299.5777  35.1874    2.4  47.4  134.9   3.7875   4.9    1.1	Cyg X-1
308.1237  40.9250    2.6  38.7  136.7   1.8325   4.4    1.8	Cyg X-3
326.0509  38.3141    3.8  27.9  120.0   0.7734   3.0    5.7	Cyg X-2
 10.2984  10.2226    2.4  38.1   23.6   1.2393   4.8 ------	UNKNOWN
Pre-slew background subtracted image of 15-350 keV band
Time interval of the image:
-6.080000 3.136000

# RAcent  DECcent POSerr Theta    Phi  PeakCts   SNR AngSep     Name
#  [deg]    [deg]    ['] [deg]  [deg]                   [']
299.5885  35.2000   10.8  47.4  134.9   0.1445   1.1    0.1	Cyg X-1
308.1020  40.9323   10.3  38.7  136.7  -0.0640  -1.1    1.3	Cyg X-3
326.3474  38.2922   13.9  27.8  119.7   0.0341   0.8    8.5	Cyg X-2
333.6237  46.7562    2.2  19.5  134.0   0.1638   5.3 ------	UNKNOWN
342.4993  58.2971    3.0  15.9  175.1   0.1060   3.8 ------	UNKNOWN
  2.7460  47.8787    1.9   0.2  -94.5   0.1709   5.9 ------	UNKNOWN
313.0377  68.5979    2.2  31.9 -175.5   0.1856   5.3 ------	UNKNOWN
 43.6996   4.5294    2.5  55.7  -16.5   0.5140   4.7 ------	UNKNOWN
 55.2995  67.6649    0.9  33.0 -110.1   0.6500  13.0 ------	UNKNOWN
Post-slew image of 15-350 keV band
Time interval of the image:
70.020600 962.353600

# RAcent  DECcent POSerr Theta    Phi  PeakCts   SNR AngSep     Name
#  [deg]    [deg]    ['] [deg]  [deg]                   [']
 83.6370  22.0202    0.5  48.9  -36.6  33.7629  25.3    0.4	Crab
337.1348  56.4012    2.6  35.5  110.5   4.5130   4.4 ------	UNKNOWN
 96.3086  27.3740    3.6  47.2  -53.5   7.5974   3.3 ------	UNKNOWN
Plot creation:
Sun May 31 00:13:30 EDT 2015