Click here for the BAT GCN circular template
Image
Pre-slew 15.0-350.0 keV image (Event data)
#   RAcent    DECcent   POSerr    Theta     Phi              Peak Cts       SNR   Name
   22.4792   -17.9908   0.0026    26.2918   -12.4186         4.7959070     72.875 TRIG_00431605

Foreground time interval of the image:
 -3.204  15.757 (delta_t =  18.961 [sec])
Background time interval of the image:
-575.943 -543.305 (delta_t =  32.638 [sec])
-239.344  -3.204 (delta_t = 236.140 [sec])
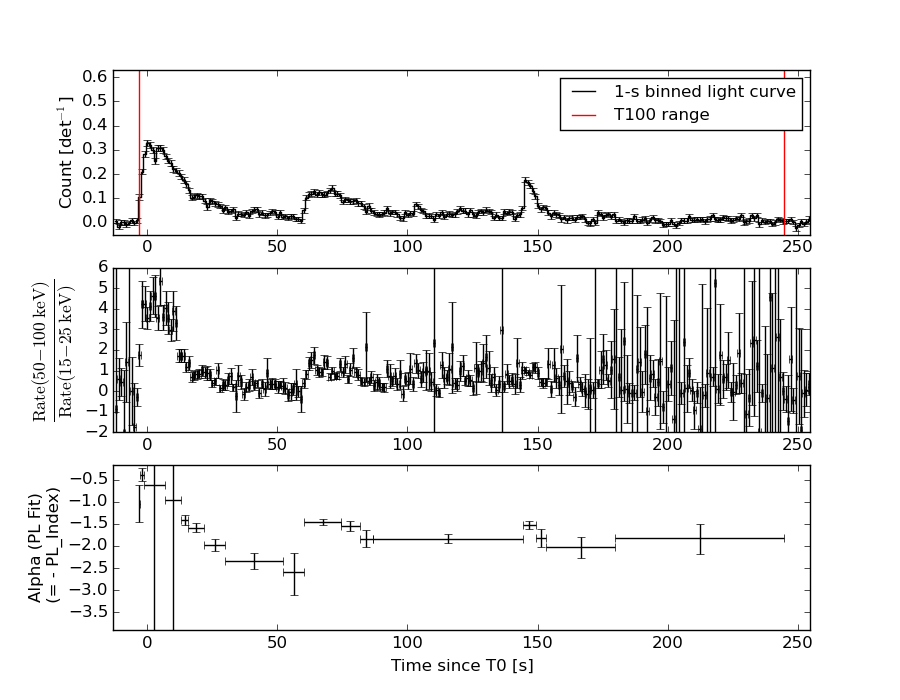
Lightcurves
Notes:
- 1) The mask-weighted light curves are using the flight position.
- 2) Multiple plots of different time binning/intervals are shown to cover all scenarios of short/long GRBs, rate/image triggers, and real/false positives.
- 3) For all the mask-weighted lightcurves, the y-axis units are counts/sec/det where a det is 0.4 x 0.4 = 0.16 sq cm.
- 4) The verticle lines correspond to following: green dotted lines are T50 interval, black dotted lines are T90 interval, blue solid line(s) is a spacecraft slew start time, and orange solid line(s) is a spacecraft slew end time.
- 5) Time of each bin is in the middle of the bin.
1 s binning
From T0-310 s to T0+310 s
From T100_start - 20 s to T100_end + 30 s

Full time interval
64 ms binning
Full time interval
From T100_start to T100_end
From T0-5 sec to T0+5 sec

16 ms binning
From T100_start-5 s to T100_start+5 s
Blue+Cyan dotted lines: Time interval of the scaled map
From 0.000000 to 1.024000
8 ms binning
From T100_start-3 s to T100_start+3 s

Blue+Cyan dotted lines: Time interval of the scaled map
From 0.000000 to 1.024000
2 ms binning
From T100_start-1 s to T100_start+1 s
Blue+Cyan dotted lines: Time interval of the scaled map
From 0.000000 to 1.024000
SN=5 or 10 sec. binning (whichever binning is satisfied first)

SN=5 or 10 sec. binning (T < 200 sec)
Quad-rate summed light curves (from T0-300s to T0+1000s)
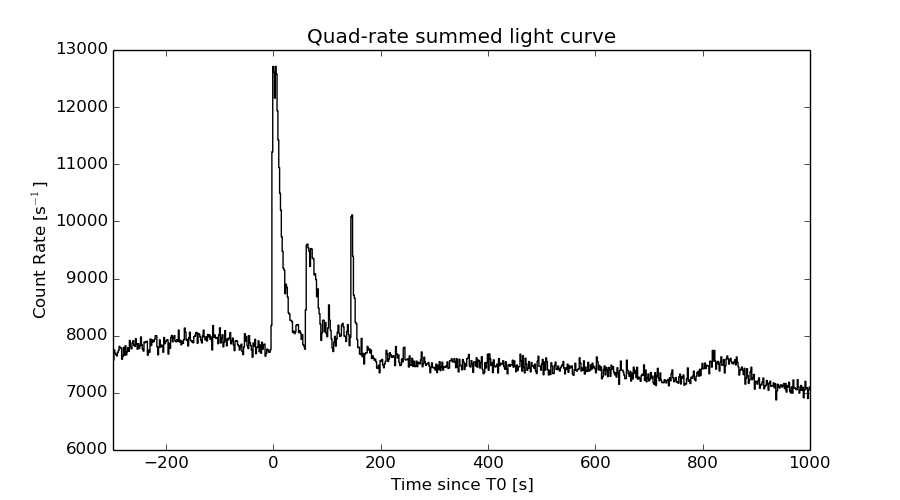
The mask-weighted light curves based on cleaned DPHs

Spectral Evolution
Spectra
Notes:
- 1) The fitting includes the systematic errors.
- 2) When the burst includes telescope slew time periods, the fitting uses an average response file made from multiple 5-s response files through out the slew time plus single time preiod for the non-slew times, and weighted by the total counts in the corresponding time period using addrmf. An average response file is needed becuase a spectral fit using the pre-slew DRM will introduce some errors in both a spectral shape and a normalization if the PHA file contains a lot of the slew/post-slew time interval.
- 3) For fits to more complicated models (e.g. a power-law over a cutoff power-law), the BAT team has decided to require a chi-square improvement of more than 6 for each extra dof.
Time averaged spectrum fit using the average DRM
Power-law model

Time interval is from   -3.204 sec. to  244.552 sec.

Spectral model in power-law:
------------------------------------------------------------
Parameters  : value       lower 90%   higher 90%
Photon index: 1.45168     ( -0.0418457   0.0418236 )
Norm@50keV  : 3.73282E-03    ( -7.90179e-05   7.90097e-05 )
------------------------------------------------------------
#Fit statistic : Chi-Squared =          32.63 using 59 PHA bins.
# Reduced chi-squared =         0.5724 for     57 degrees of freedom
# Null hypothesis probability =   9.960942e-01

Photon flux (15-150 keV)    in 247.8 sec: 0.460211 ( -0.0110584  0.0110979 ) ph/cm2/s
Energy fluence (15-150 keV)             : 8.84876e-06 ( -1.95712e-07  1.95917e-07 ) ergs/cm2
Cutoff power-law model
Time interval is from   -3.204 sec. to  244.552 sec.
Spectral model in the cutoff power-law:
------------------------------------------------------------
Parameters  : value       lower 90%   higher 90%
Photon index: 1.33082     ( -0.170383   0.13987 )
Epeak [keV] : 312.960      ( -149.32 -312.963 )
Norm@50keV  : 4.22174E-03    ( -0.000529202   0.000776823 )
------------------------------------------------------------
#Fit statistic : Chi-Squared =          31.07 using 59 PHA bins.
# Reduced chi-squared =         0.5549 for     56 degrees of freedom
# Null hypothesis probability =   9.972212e-01

Photon flux (15-150 keV)    in 247.8 sec: 0.455427 ( -0.012655  0.012613 ) ph/cm2/s
Energy fluence (15-150 keV)             : 8.77871e-06 ( -2.20567e-07  2.16602e-07 ) ergs/cm2
Band function

Time interval is from   -3.204 sec. to  244.552 sec.

Spectral model in the Band function:
------------------------------------------------------------
Parameters  : value       lower 90%   higher 90%
alpha       : -1.30891   ( 1.01256   1.01256 )
beta        : -1.56160    ( 1.56794   0.14392 )
Epeak [keV] : 265.429      ( -280.391 -280.391 )
Norm@50keV   : 4.32968E-03    ( -0.000493524   0 )
------------------------------------------------------------
#Fit statistic : Chi-Squared =          31.02 using 59 PHA bins.
# Reduced chi-squared =         0.5640 for     55 degrees of freedom
# Null hypothesis probability =   9.962739e-01

Photon flux (15-150 keV)    in 247.8 sec:  (    ) ph/cm2/s
Energy fluence (15-150 keV)             : 0 ( 0  0 ) ergs/cm2
Single BB
Spectral model blackbody:
------------------------------------------------------------
Parameters  : value    Lower 90%  Upper 90%
kT [keV]    : 17.7251  (  )
R^2/D10^2   : 2.82534E-02  (   )
(R is the radius in km and D10 is the distance to the source in units of 10 kpc)
------------------------------------------------------------
#Fit statistic : Chi-Squared =         453.37 using 59 PHA bins.
# Reduced chi-squared =         7.9539 for     57 degrees of freedom
# Null hypothesis probability =   4.196313e-63

Energy  Fluence     90% Error
[keV]   [erg/cm2]   [erg/cm2]
15- 25  4.425e-07   1.958e-08
25- 50  2.023e-06   6.616e-08
50-150  4.595e-06   1.697e-07
15-150  7.060e-06   1.747e-07
Thermal bremsstrahlung (OTTB)

Spectral model: thermal bremsstrahlung
------------------------------------------------------------
Parameters  : value         Lower 90%    Upper 90%
kT [keV]    : 200.000       (      )
Norm        : 1.90673       (-0.0404236     0.0404124)
------------------------------------------------------------
#Fit statistic : Chi-Squared =          64.69 using 59 PHA bins.
# Reduced chi-squared =          1.135 for     57 degrees of freedom
# Null hypothesis probability =   2.261113e-01

Energy  Fluence     90% Error
[keV]   [erg/cm2]   [erg/cm2]
15- 25  1.177e-06   2.986e-08
25- 50  2.264e-06   5.068e-08
50-150  4.965e-06   1.264e-07
15-150  8.406e-06   1.871e-07
Double BB
Spectral model: bbodyrad<1> + bbodyrad<2>
------------------------------------------------------------
Parameters  : value         Lower 90%    Upper 90%
kT1 [keV]   : 7.56789        (-0.672277      0.721243)
R1^2/D10^2  : 0.336058        (-0.0888146      0.130875)
kT2 [keV]   : 28.9342        (-2.26054      2.88483)
R2^2/D10^2  : 4.34082E-03    (-0.0012311   0.00147499)
------------------------------------------------------------
#Fit statistic : Chi-Squared =          43.02 using 59 PHA bins.
# Reduced chi-squared =         0.7821 for     55 degrees of freedom
# Null hypothesis probability =   8.796318e-01

Energy  Fluence     90% Error
[keV]   [erg/cm2]   [erg/cm2]
15- 25  9.690e-07   7.744e-08
25- 50  2.183e-06   9.726e-08
50-150  5.528e-06   2.552e-07
15-150  8.680e-06   3.457e-07
Peak spectrum fit
Power-law model
Time interval is from    4.208 sec. to    5.208 sec.

Spectral model in power-law:
------------------------------------------------------------
Parameters  : value       lower 90%   higher 90%
Photon index: 0.604906     ( -0.10652   0.103324 )
Norm@50keV  : 2.17867E-02    ( -0.001473   0.001458 )
------------------------------------------------------------
#Fit statistic : Chi-Squared =          59.71 using 59 PHA bins.
# Reduced chi-squared =          1.048 for     57 degrees of freedom
# Null hypothesis probability =   3.773050e-01

Photon flux (15-150 keV)    in 1 sec: 2.54222 ( -0.158438  0.158729 ) ph/cm2/s
Energy fluence (15-150 keV)             : 2.77952e-07 ( -1.73131e-08  1.73351e-08 ) ergs/cm2
Cutoff power-law model
Time interval is from    4.208 sec. to    5.208 sec.
Spectral model in the cutoff power-law:
------------------------------------------------------------
Parameters  : value       lower 90%   higher 90%
Photon index: -0.407887     ( -0.57565   0.502456 )
Epeak [keV] : 155.903      ( -32.9671 84.9223 )
Norm@50keV  : 5.30566E-02    ( -0.0184319   0.0318866 )
------------------------------------------------------------
#Fit statistic : Chi-Squared =          46.37 using 59 PHA bins.
# Reduced chi-squared =         0.8280 for     56 degrees of freedom
# Null hypothesis probability =   8.170399e-01

Photon flux (15-150 keV)    in 1 sec: 2.47440 ( -0.16111  0.16167 ) ph/cm2/s
Energy fluence (15-150 keV)             : 2.74174e-07 ( -1.8139e-08  1.8032e-08 ) ergs/cm2
Band function

Time interval is from    4.208 sec. to    5.208 sec.

Spectral model in the Band function:
------------------------------------------------------------
Parameters  : value       lower 90%   higher 90%
alpha       : -0.880132   ( 0.880132   0.880132 )
beta        : -0.604948    ( -0.10326   0.106602 )
Epeak [keV] : 15.9232      (   )
Norm@50keV   : 3.07771E-02    (     )
------------------------------------------------------------
#Fit statistic : Chi-Squared =          59.71 using 59 PHA bins.
# Reduced chi-squared =          1.086 for     55 degrees of freedom
# Null hypothesis probability =   3.083754e-01

Photon flux (15-150 keV)    in 1 sec:  (    ) ph/cm2/s
Energy fluence (15-150 keV)             : 0 ( 0  0 ) ergs/cm2
Single BB
Spectral model blackbody:
------------------------------------------------------------
Parameters  : value    Lower 90%  Upper 90%
kT [keV]    : 29.4467  (-2.31429  2.66714)
R^2/D10^2   : 4.34315E-02  (-0.00951106   0.0116056)
(R is the radius in km and D10 is the distance to the source in units of 10 kpc)
------------------------------------------------------------
#Fit statistic : Chi-Squared =          52.49 using 59 PHA bins.
# Reduced chi-squared =         0.9209 for     57 degrees of freedom
# Null hypothesis probability =   6.446041e-01

Energy  Fluence     90% Error
[keV]   [erg/cm2]   [erg/cm2]
15- 25  5.959e-09   7.010e-10
25- 50  3.648e-08   3.465e-09
50-150  2.250e-07   1.815e-08
15-150  2.674e-07   1.970e-08
Thermal bremsstrahlung (OTTB)
Spectral model: thermal bremsstrahlung
------------------------------------------------------------
Parameters  : value         Lower 90%    Upper 90%
kT [keV]    : 199.363       (      )
Norm        : 9.41361       (     )
------------------------------------------------------------
#Fit statistic : Chi-Squared =         272.19 using 59 PHA bins.
# Reduced chi-squared =         4.7752 for     57 degrees of freedom
# Null hypothesis probability =   8.208753e-30

Energy  Fluence     90% Error
[keV]   [erg/cm2]   [erg/cm2]
15- 25  2.344e-08   1.820e-09
25- 50  4.509e-08   6.135e-09
50-150  9.889e-08   3.254e-08
15-150  1.674e-07   4.586e-08
Double BB

Spectral model: bbodyrad<1> + bbodyrad<2>
------------------------------------------------------------
Parameters  : value         Lower 90%    Upper 90%
kT1 [keV]   : 11.2168        (-6.86716      -11.233)
R1^2/D10^2  : 0.166765        (-0.125988      2.68582)
kT2 [keV]   : 35.5194        (-6.18258      -35.5472)
R2^2/D10^2  : 2.29290E-02    (-0.0218639   0.0174954)
------------------------------------------------------------
#Fit statistic : Chi-Squared =          46.44 using 59 PHA bins.
# Reduced chi-squared =         0.8444 for     55 degrees of freedom
# Null hypothesis probability =   7.875547e-01

Energy  Fluence     90% Error
[keV]   [erg/cm2]   [erg/cm2]
15- 25  8.456e-09   4.592e-09
25- 50  3.940e-08   1.964e-08
50-150  2.273e-07   1.079e-07
15-150  2.752e-07   1.240e-07
Pre-slew spectrum (Pre-slew PHA with pre-slew DRM)
Power-law model

Spectral model in power-law:
------------------------------------------------------------
Parameters  : value       lower 90%   higher 90%
Photon index: 0.817767     (     )
Norm@50keV  : 1.69136E-02    (     )
------------------------------------------------------------
#Fit statistic : Chi-Squared =         125.55 using 59 PHA bins.
# Reduced chi-squared =         2.2026 for     57 degrees of freedom
# Null hypothesis probability =   4.565258e-07

Photon flux (15-150 keV)    in 18.96 sec: 1.94282 (    ) ph/cm2/s
Energy fluence (15-150 keV)             : 3.71974e-06 ( 0  0 ) ergs/cm2
Cutoff power-law model

Spectral model in the cutoff power-law:
------------------------------------------------------------
Parameters  : value       lower 90%   higher 90%
Photon index: 8.73346E-02     ( -0.171458   0.164946 )
Epeak [keV] : 166.578      ( -19.572 29.4276 )
Norm@50keV  : 3.29461E-02    ( -0.00446105   0.00532816 )
------------------------------------------------------------
#Fit statistic : Chi-Squared =          61.00 using 59 PHA bins.
# Reduced chi-squared =          1.089 for     56 degrees of freedom
# Null hypothesis probability =   3.009202e-01

Photon flux (15-150 keV)    in 18.96 sec: 1.88929 ( -0.04286  0.04294 ) ph/cm2/s
Energy fluence (15-150 keV)             : 3.66419e-06 ( -8.0599e-08  8.02766e-08 ) ergs/cm2
Band function
Spectral model in the Band function:
------------------------------------------------------------
Parameters  : value       lower 90%   higher 90%
alpha       : -0.786365   (     )
beta        : -0.817769    (     )
Epeak [keV] : 14.8686      (   )
Norm@50keV   : 2.52558E-02    (     )
------------------------------------------------------------
#Fit statistic : Chi-Squared =         125.55 using 59 PHA bins.
# Reduced chi-squared =         2.2827 for     55 degrees of freedom
# Null hypothesis probability =   1.948077e-07

Photon flux (15-150 keV)    in 18.96 sec:  (    ) ph/cm2/s
Energy fluence (15-150 keV)             : 0 ( 0  0 ) ergs/cm2
S(25-50 keV) vs. S(50-100 keV) plot
S(25-50 keV)  = 2.14e-06
S(50-100 keV) = 3.12e-06
T90 vs. Hardness ratio plot

T90                                   = 177.263999998569 sec.
Hardness ratio (energy fluence ratio) = 1.45794
Color vs. Color plot
Count Ratio  (25-50 keV) / (15-25 keV) = 1.34965
Count Ratio (50-100 keV) / (15-25 keV) = 1.09396
Mask shadow pattern

IMX = 4.824926271121956E-01, IMY = 1.062471090288457E-01
TIME vs. PHA plot around the trigger time

Blue+Cyan dotted lines: Time interval of the scaled map
From 0.000000 to 1.024000
TIME vs. DetID plot around the trigger time

Blue+Cyan dotted lines: Time interval of the scaled map
From 0.000000 to 1.024000
100 us light curve (15-350 keV)
Blue+Cyan dotted lines: Time interval of the scaled map
From 0.000000 to 1.024000
Spacecraft aspect plot

Bright source in the pre-burst/pre-slew/post-slew images
Pre-burst image of 15-350 keV band
Time interval of the image:
-575.943400 -543.304900
-239.344000 -3.204000

# RAcent  DECcent POSerr Theta    Phi  PeakCts   SNR AngSep     Name
#  [deg]    [deg]    ['] [deg]  [deg]                   [']
326.1006  38.2451    3.7  51.2  178.5   1.7456   3.1    5.7	Cyg X-2
335.4854 -32.3998    2.8  40.6   71.0   3.0734   4.1 ------	UNKNOWN
 30.2188 -44.1664    2.3  50.1    9.2   2.5211   4.9 ------	UNKNOWN
336.6924  25.0994    2.8  35.8  173.0   1.1102   4.1 ------	UNKNOWN
 49.4519  -1.6232    5.5  47.1  -53.2   2.0941   2.1 ------	UNKNOWN
 19.1105  44.9894    2.5  48.0 -129.0   4.3355   4.6 ------	UNKNOWN
Pre-slew background subtracted image of 15-350 keV band
Time interval of the image:
-3.204000 15.756590

# RAcent  DECcent POSerr Theta    Phi  PeakCts   SNR AngSep     Name
#  [deg]    [deg]    ['] [deg]  [deg]                   [']
326.3025  38.3547   13.2  51.2  178.8   0.1525   0.9    6.5	Cyg X-2
  6.6664 -51.4064    2.1  50.9   31.7   1.6887   5.5 ------	UNKNOWN
 22.4792 -17.9908    0.2  26.3  -12.4   4.7960  72.9 ------	UNKNOWN
328.5628  44.3230    1.7  54.1 -174.3   1.3020   6.7 ------	UNKNOWN
Post-slew image of 15-350 keV band
Time interval of the image:
75.156590 719.156620

# RAcent  DECcent POSerr Theta    Phi  PeakCts   SNR AngSep     Name
#  [deg]    [deg]    ['] [deg]  [deg]                   [']
349.9294   4.2644    3.0  39.0  127.5   3.4847   3.8 ------	UNKNOWN
 22.4940 -17.9987    0.7   0.0  -96.3   5.4797  15.7 ------	UNKNOWN
 62.9622 -49.2504    2.5  45.1  -31.0   2.9833   4.5 ------	UNKNOWN
Plot creation:
Sun May 31 00:11:32 EDT 2015