Special notes of this burst
Image
Pre-slew 25.0-100.0 keV image (Event data)
#RAcent DECcent POSerr Theta  Phi  Peak_Cts  SNR Name
27.245 22.744 0.000 41.044 165.735 0.318 8.898 TRIG_00433065

Image time interval: 0.000 to 8.192 [sec]
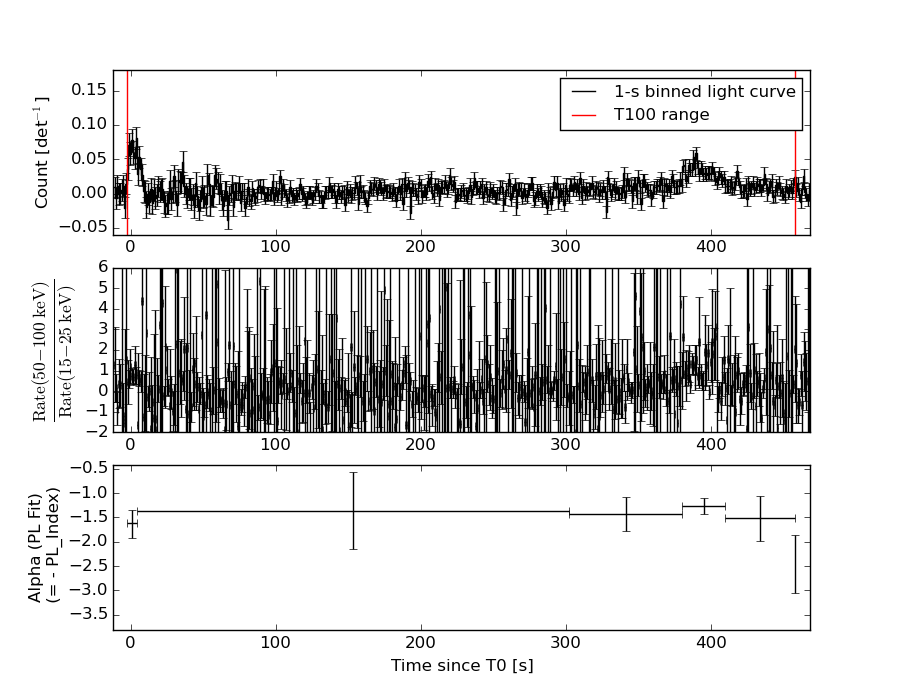
Lightcurves
Notes:
- 1) The mask-weighted light curves are using the flight position.
- 2) Multiple plots of different time binning/intervals are shown to cover all scenarios of short/long GRBs, rate/image triggers, and real/false positives.
- 3) For all the mask-weighted lightcurves, the y-axis units are counts/sec/det where a det is 0.4 x 0.4 = 0.16 sq cm.
- 4) The verticle lines correspond to following: green dotted lines are T50 interval, black dotted lines are T90 interval, blue solid line(s) is a spacecraft slew start time, and orange solid line(s) is a spacecraft slew end time.
- 5) Time of each bin is in the middle of the bin.
1 s binning
From T0-310 s to T0+310 s
From T100_start - 20 s to T100_end + 30 s
Full time interval
64 ms binning
Full time interval

From T100_start to T100_end
From T0-5 sec to T0+5 sec
16 ms binning
From T100_start-5 s to T100_start+5 s
8 ms binning
From T100_start-3 s to T100_start+3 s
2 ms binning
From T100_start-1 s to T100_start+1 s
SN=5 or 10 sec. binning (whichever binning is satisfied first)
SN=5 or 10 sec. binning (T < 200 sec)
Quad-rate summed light curves (from T0-300s to T0+1000s)
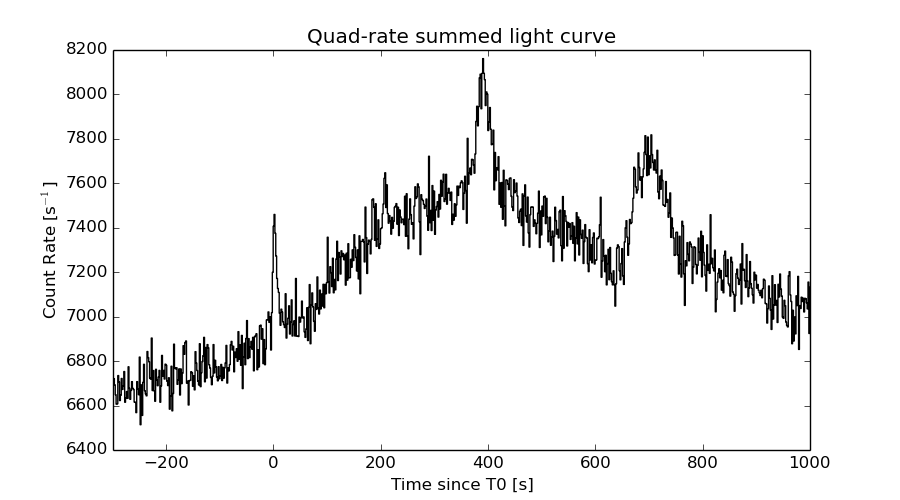
The mask-weighted light curves based on cleaned DPHs

Spectral Evolution
Spectra
Notes:
- 1) The fitting includes the systematic errors.
- 2) When the burst includes telescope slew time periods, the fitting uses an average response file made from multiple 5-s response files through out the slew time plus single time preiod for the non-slew times, and weighted by the total counts in the corresponding time period using addrmf. An average response file is needed becuase a spectral fit using the pre-slew DRM will introduce some errors in both a spectral shape and a normalization if the PHA file contains a lot of the slew/post-slew time interval.
- 3) For fits to more complicated models (e.g. a power-law over a cutoff power-law), the BAT team has decided to require a chi-square improvement of more than 6 for each extra dof.
Time averaged spectrum fit using the average DRM
Power-law model
Time interval is from   -2.420 sec. to  458.424 sec.

Spectral model in power-law:
------------------------------------------------------------
Parameters  : value       lower 90%   higher 90%
Photon index: 1.40216     ( -0.204463   0.204133 )
Norm@50keV  : 4.39118E-04    ( -5.17692e-05   5.14189e-05 )
------------------------------------------------------------
#Fit statistic : Chi-Squared =          50.26 using 59 PHA bins.
# Reduced chi-squared =         0.8817 for     57 degrees of freedom
# Null hypothesis probability =   7.240799e-01

Photon flux (15-150 keV)    in 460.8 sec: 5.35026E-02 ( -0.00617913  0.00618523 ) ph/cm2/s
Energy fluence (15-150 keV)             : 1.95433e-06 ( -2.58668e-07  2.62377e-07 ) ergs/cm2
Cutoff power-law model

Time interval is from   -2.420 sec. to  458.424 sec.
Spectral model in the cutoff power-law:
------------------------------------------------------------
Parameters  : value       lower 90%   higher 90%
Photon index: 1.40416     ( -0.20923   0.201834 )
Epeak [keV] : 9999.36      ( -9999.36 -9999.36 )
Norm@50keV  : 4.39711E-04    ( -0.000118358   0.000482153 )
------------------------------------------------------------
#Fit statistic : Chi-Squared =          50.27 using 59 PHA bins.
# Reduced chi-squared =         0.8976 for     56 degrees of freedom
# Null hypothesis probability =   6.907239e-01

Photon flux (15-150 keV)    in 460.8 sec: 5.34820E-02 ( -0.0061504  0.0061439 ) ph/cm2/s
Energy fluence (15-150 keV)             : 1.95241e-06 ( -2.69057e-07  2.60997e-07 ) ergs/cm2
Band function

Time interval is from   -2.420 sec. to  458.424 sec.

Spectral model in the Band function:
------------------------------------------------------------
Parameters  : value       lower 90%   higher 90%
alpha       : 4.94336   ( -4.94336   -4.94336 )
beta        : -1.53369    ( -0.290698   0.241661 )
Epeak [keV] : 25.5976      ( -25.5976 5.12721 )
Norm@50keV   : 35.0189    ( -3.96989   149727 )
------------------------------------------------------------
#Fit statistic : Chi-Squared =          47.68 using 59 PHA bins.
# Reduced chi-squared =         0.8669 for     55 degrees of freedom
# Null hypothesis probability =   7.476965e-01

Photon flux (15-150 keV)    in 460.8 sec:  (    ) ph/cm2/s
Energy fluence (15-150 keV)             : 0 ( 0  0 ) ergs/cm2
Single BB
Spectral model blackbody:
------------------------------------------------------------
Parameters  : value    Lower 90%  Upper 90%
kT [keV]    : 14.8132  (-2.40473  3.01949)
R^2/D10^2   : 6.24169E-03  (-0.00290506   0.00530361)
(R is the radius in km and D10 is the distance to the source in units of 10 kpc)
------------------------------------------------------------
#Fit statistic : Chi-Squared =          75.01 using 59 PHA bins.
# Reduced chi-squared =          1.316 for     57 degrees of freedom
# Null hypothesis probability =   5.510061e-02

Energy  Fluence     90% Error
[keV]   [erg/cm2]   [erg/cm2]
15- 25  1.324e-07   3.117e-08
25- 50  5.200e-07   9.237e-08
50-150  7.721e-07   1.928e-07
15-150  1.424e-06   2.170e-07
Thermal bremsstrahlung (OTTB)
Spectral model: thermal bremsstrahlung
------------------------------------------------------------
Parameters  : value         Lower 90%    Upper 90%
kT [keV]    : 200.000       (-58.334      -200)
Norm        : 0.219186       (-0.0251228     0.0251228)
------------------------------------------------------------
#Fit statistic : Chi-Squared =          52.21 using 59 PHA bins.
# Reduced chi-squared =         0.9159 for     57 degrees of freedom
# Null hypothesis probability =   6.551739e-01

Energy  Fluence     90% Error
[keV]   [erg/cm2]   [erg/cm2]
15- 25  2.515e-07   1.409e-07
25- 50  4.838e-07   2.684e-07
50-150  1.061e-06   5.834e-07
15-150  1.796e-06   9.707e-07
Double BB
Spectral model: bbodyrad<1> + bbodyrad<2>
------------------------------------------------------------
Parameters  : value         Lower 90%    Upper 90%
kT1 [keV]   : 7.16690        (-1.80475      2.64066)
R1^2/D10^2  : 5.71474E-02        (-0.0362617      0.0990197)
kT2 [keV]   : 35.4824        (-12.4997      108.817)
R2^2/D10^2  : 2.84334E-04    (-0.000269228   0.000861971)
------------------------------------------------------------
#Fit statistic : Chi-Squared =          48.22 using 59 PHA bins.
# Reduced chi-squared =         0.8767 for     55 degrees of freedom
# Null hypothesis probability =   7.294091e-01

Energy  Fluence     90% Error
[keV]   [erg/cm2]   [erg/cm2]
15- 25  2.457e-07   1.013e-07
25- 50  4.708e-07   1.901e-07
50-150  1.300e-06   6.916e-07
15-150  2.016e-06   9.076e-07
Peak spectrum fit
Power-law model
Time interval is from   -1.808 sec. to   -0.808 sec.

Spectral model in power-law:
------------------------------------------------------------
Parameters  : value       lower 90%   higher 90%
Photon index: 1.84020     ( -0.576779   0.650236 )
Norm@50keV  : 5.64543E-03    ( -0.00204903   0.00182125 )
------------------------------------------------------------
#Fit statistic : Chi-Squared =          56.44 using 59 PHA bins.
# Reduced chi-squared =         0.9901 for     57 degrees of freedom
# Null hypothesis probability =   4.961470e-01

Photon flux (15-150 keV)    in 1 sec: 0.790399 ( -0.221193  0.220953 ) ph/cm2/s
Energy fluence (15-150 keV)             : 5.19153e-08 ( -1.74014e-08  1.79455e-08 ) ergs/cm2
Cutoff power-law model

Time interval is from   -1.808 sec. to   -0.808 sec.
Spectral model in the cutoff power-law:
------------------------------------------------------------
Parameters  : value       lower 90%   higher 90%
Photon index: 2.74680     (     )
Epeak [keV] : 242.616      (   )
Norm@50keV  : 1.99431E-03    (     )
------------------------------------------------------------
#Fit statistic : Chi-Squared =          55.07 using 59 PHA bins.
# Reduced chi-squared =         0.9834 for     56 degrees of freedom
# Null hypothesis probability =   5.100380e-01

Photon flux (15-150 keV)    in 1 sec: 0.791755 ( -0.2194  0.219595 ) ph/cm2/s
Energy fluence (15-150 keV)             : 5.10953e-08 ( -1.66334e-08  1.78139e-08 ) ergs/cm2
Band function
Time interval is from   -1.808 sec. to   -0.808 sec.

Spectral model in the Band function:
------------------------------------------------------------
Parameters  : value       lower 90%   higher 90%
alpha       : -1.45399   ( 1.45427   1.45427 )
beta        : -1.84026    ( 1.84042   0.576802 )
Epeak [keV] : 17.1316      ( -17.033 -17.033 )
Norm@50keV   : 1.43610E-02    ( -0.0143742   11322.1 )
------------------------------------------------------------
#Fit statistic : Chi-Squared =          56.44 using 59 PHA bins.
# Reduced chi-squared =          1.026 for     55 degrees of freedom
# Null hypothesis probability =   4.209986e-01

Photon flux (15-150 keV)    in 1 sec:  (    ) ph/cm2/s
Energy fluence (15-150 keV)             : 0 ( 0  0 ) ergs/cm2
Single BB
Spectral model blackbody:
------------------------------------------------------------
Parameters  : value    Lower 90%  Upper 90%
kT [keV]    : 7.90489  (-2.64473  4.87194)
R^2/D10^2   : 0.848338  (-0.84462   3.60438)
(R is the radius in km and D10 is the distance to the source in units of 10 kpc)
------------------------------------------------------------
#Fit statistic : Chi-Squared =          63.63 using 59 PHA bins.
# Reduced chi-squared =          1.116 for     57 degrees of freedom
# Null hypothesis probability =   2.546276e-01

Energy  Fluence     90% Error
[keV]   [erg/cm2]   [erg/cm2]
15- 25  9.500e-09   5.835e-09
25- 50  1.628e-08   9.975e-09
50-150  4.110e-09   3.187e-09
15-150  2.989e-08   1.842e-08
Thermal bremsstrahlung (OTTB)

Spectral model: thermal bremsstrahlung
------------------------------------------------------------
Parameters  : value         Lower 90%    Upper 90%
kT [keV]    : 99.8454       (-99.9046      -99.9046)
Norm        : 3.41445       (-1.21298     2.41504)
------------------------------------------------------------
#Fit statistic : Chi-Squared =          58.06 using 59 PHA bins.
# Reduced chi-squared =          1.019 for     57 degrees of freedom
# Null hypothesis probability =   4.361470e-01

Energy  Fluence     90% Error
[keV]   [erg/cm2]   [erg/cm2]
15- 25  8.924e-09   5.370e-09
25- 50  1.543e-08   9.260e-09
50-150  2.498e-08   1.889e-08
15-150  4.933e-08   3.464e-08
Double BB
------------------------------------------------------------
Parameters  : value         Lower 90%    Upper 90%
kT1 [keV]   : 6.12207        (-2.20326      3.07964)
R1^2/D10^2  : 2.14981        (-1.69396      13.2371)
kT2 [keV]   : 98.7805        (-74.4033      -99.6656)
R2^2/D10^2  : 3.63102E-04    (-0.00029381   0.00941611)
------------------------------------------------------------
#Fit statistic : Chi-Squared =          53.36 using 59 PHA bins.
#Fit statistic : Chi-Squared =          53.29 using 59 PHA bins.
# Reduced chi-squared =         0.9702 for     55 degrees of freedom
# Reduced chi-squared =         0.9688 for     55 degrees of freedom
# Null hypothesis probability =   5.375531e-01
# Null hypothesis probability =   5.404070e-01

Energy  Fluence     90% Error
[keV]   [erg/cm2]   [erg/cm2]
15- 25  1.131e-08   6.760e-09
25- 50  1.305e-08   7.230e-09
50-150  3.584e-08   2.067e-08
15-150  6.020e-08   3.077e-08
Pre-slew spectrum (Pre-slew PHA with pre-slew DRM)
Power-law model
Spectral model in power-law:
------------------------------------------------------------
Parameters  : value       lower 90%   higher 90%
Photon index: 1.80851     ( -0.481713   0.542595 )
Norm@50keV  : 8.12106E-04    ( -0.000263364   0.000247606 )
------------------------------------------------------------
#Fit statistic : Chi-Squared =          48.71 using 59 PHA bins.
# Reduced chi-squared =         0.8545 for     57 degrees of freedom
# Null hypothesis probability =   7.748103e-01

Photon flux (15-150 keV)    in 53.81 sec: 0.112278 ( -0.0301829  0.0302167 ) ph/cm2/s
Energy fluence (15-150 keV)             : 4.02187e-07 ( -1.25798e-07  1.30648e-07 ) ergs/cm2
Cutoff power-law model

Spectral model in the cutoff power-law:
------------------------------------------------------------
Parameters  : value       lower 90%   higher 90%
Photon index: 1.66404     ( -2.33358   0.7174 )
Epeak [keV] : 106.168      (   )
Norm@50keV  : 9.73477E-04    (     )
------------------------------------------------------------
#Fit statistic : Chi-Squared =          48.69 using 59 PHA bins.
# Reduced chi-squared =         0.8694 for     56 degrees of freedom
# Null hypothesis probability =   7.453408e-01

Photon flux (15-150 keV)    in 53.81 sec: 0.111691 ( -0.0310988  0.030648 ) ph/cm2/s
Energy fluence (15-150 keV)             : 3.9763e-07 ( -1.35942e-07  1.33935e-07 ) ergs/cm2
Band function

Spectral model in the Band function:
------------------------------------------------------------
Parameters  : value       lower 90%   higher 90%
alpha       : -6.69402   ( 6.69402   6.69402 )
beta        : -1.80851    ( -0.542595   0.481524 )
Epeak [keV] : 79.0008      ( -79.0008 -79.0008 )
Norm@50keV   : 0.110377    ( -0.0357949   0.0336551 )
------------------------------------------------------------
#Fit statistic : Chi-Squared =          48.71 using 59 PHA bins.
# Reduced chi-squared =         0.8856 for     55 degrees of freedom
# Null hypothesis probability =   7.124094e-01

Photon flux (15-150 keV)    in 53.81 sec:  (    ) ph/cm2/s
Energy fluence (15-150 keV)             : 0 ( 0  0 ) ergs/cm2
S(25-50 keV) vs. S(50-100 keV) plot
S(25-50 keV)  = 4.60e-07
S(50-100 keV) = 6.96e-07
T90 vs. Hardness ratio plot

T90                                   = 436.655999958515 sec.
Hardness ratio (energy fluence ratio) = 1.51304
Color vs. Color plot

Count Ratio  (25-50 keV) / (15-25 keV) = 1.42719
Count Ratio (50-100 keV) / (15-25 keV) = 1.09776
Mask shadow pattern
IMX = -0.843794285758, IMY = -0.214535657933
TIME vs. PHA plot around the trigger time

TIME vs. DetID plot around the trigger time

100 us light curve (15-350 keV)
Spacecraft aspect plot
Bright source in the pre-burst/pre-slew/post-slew images
Pre-burst image of 15-350 keV band
Time interval of the image:
-239.512000 -2.420000

# RAcent  DECcent POSerr Theta    Phi  PeakCts   SNR AngSep     Name
#  [deg]    [deg]    ['] [deg]  [deg]                   [']
 39.8396  33.6801    3.1  54.3  176.9   2.3632   3.7 ------	UNKNOWN
 54.4826  32.0424    3.2  58.7 -169.2   3.5980   3.6 ------	UNKNOWN
Pre-slew background subtracted image of 15-350 keV band
Time interval of the image:
-2.420000 51.388600

# RAcent  DECcent POSerr Theta    Phi  PeakCts   SNR AngSep     Name
#  [deg]    [deg]    ['] [deg]  [deg]                   [']
 27.2549  22.7543    2.2  41.1  165.7   0.6884   5.2 ------	UNKNOWN
 27.2924  11.3554    2.1  29.8  168.5   0.4801   5.4 ------	UNKNOWN
 24.5745  -3.7907    2.4  14.4  167.2   0.3600   4.9 ------	UNKNOWN
 63.0742 -55.6500    2.5  48.4  -50.1   1.5872   4.7 ------	UNKNOWN
Post-slew image of 15-350 keV band
Time interval of the image:
127.588610 625.388600

# RAcent  DECcent POSerr Theta    Phi  PeakCts   SNR AngSep     Name
#  [deg]    [deg]    ['] [deg]  [deg]                   [']
 27.2676  22.7560    1.3   0.1 -167.3   2.6975   9.2 ------	UNKNOWN
Plot creation:
Thu Oct  8 20:27:26 EDT 2015