Special notes of this burst
Image
Pre-slew 15.0-350.0 keV image (Event data)

#   RAcent    DECcent   POSerr    Theta     Phi              Peak Cts       SNR   Name
   48.6251    30.9696   0.0092    20.6896   -76.6603         5.0215982     20.966 TRIG_00433160

Foreground time interval of the image:
 -3.899 260.301 (delta_t = 264.200 [sec])
Background time interval of the image:
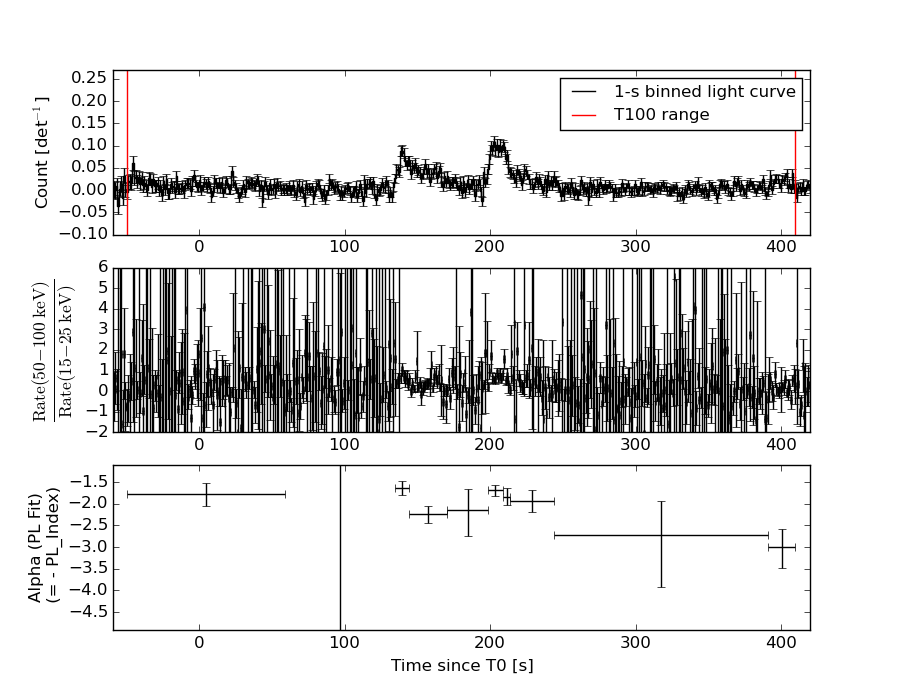
Lightcurves
Notes:
- 1) The mask-weighted light curves are using the flight position.
- 2) Multiple plots of different time binning/intervals are shown to cover all scenarios of short/long GRBs, rate/image triggers, and real/false positives.
- 3) For all the mask-weighted lightcurves, the y-axis units are counts/sec/det where a det is 0.4 x 0.4 = 0.16 sq cm.
- 4) The verticle lines correspond to following: green dotted lines are T50 interval, black dotted lines are T90 interval, blue solid line(s) is a spacecraft slew start time, and orange solid line(s) is a spacecraft slew end time.
- 5) Time of each bin is in the middle of the bin.
1 s binning
From T0-310 s to T0+310 s

From T100_start - 20 s to T100_end + 30 s

Full time interval

64 ms binning
Full time interval

From T100_start to T100_end

From T0-5 sec to T0+5 sec

16 ms binning
From T100_start-5 s to T100_start+5 s

8 ms binning
From T100_start-3 s to T100_start+3 s

2 ms binning
From T100_start-1 s to T100_start+1 s

SN=5 or 10 sec. binning (whichever binning is satisfied first)

SN=5 or 10 sec. binning (T < 200 sec)

Quad-rate summed light curves (from T0-300s to T0+1000s)

Spectral Evolution
Spectra
Notes:
- 1) The fitting includes the systematic errors.
- 2) When the burst includes telescope slew time periods, the fitting uses an average response file made from multiple 5-s response files through out the slew time plus single time preiod for the non-slew times, and weighted by the total counts in the corresponding time period using addrmf. An average response file is needed becuase a spectral fit using the pre-slew DRM will introduce some errors in both a spectral shape and a normalization if the PHA file contains a lot of the slew/post-slew time interval.
- 3) For fits to more complicated models (e.g. a power-law over a cutoff power-law), the BAT team has decided to require a chi-square improvement of more than 6 for each extra dof.
Time averaged spectrum fit using the average DRM
Power-law model

Time interval is from  -49.428 sec. to  409.632 sec.

Spectral model in power-law:
------------------------------------------------------------
Parameters  : value       lower 90%   higher 90%
Photon index: 1.98536     ( -0.12974   0.133837 )
Norm@50keV  : 7.60747E-04    ( -6.06308e-05   5.95991e-05 )
------------------------------------------------------------
#Fit statistic : Chi-Squared =          55.42 using 59 PHA bins.
# Reduced chi-squared =         0.9723 for     57 degrees of freedom
# Null hypothesis probability =   5.344779e-01

Photon flux (15-150 keV)    in 459.1 sec: 0.113351 ( -0.00725168  0.0072635 ) ph/cm2/s
Energy fluence (15-150 keV)             : 3.21848e-06 ( -2.41053e-07  2.44582e-07 ) ergs/cm2
Cutoff power-law model

Time interval is from  -49.428 sec. to  409.632 sec.
Spectral model in the cutoff power-law:
------------------------------------------------------------
Parameters  : value       lower 90%   higher 90%
Photon index: 1.97198     ( -0.471945   0.377162 )
Epeak [keV] : 91.5612      ( -102.82 -104.511 )
Norm@50keV  : 7.73799E-04    ( -0.000258662   0.000612449 )
------------------------------------------------------------
#Fit statistic : Chi-Squared =          55.42 using 59 PHA bins.
# Reduced chi-squared =         0.9897 for     56 degrees of freedom
# Null hypothesis probability =   4.967457e-01

Photon flux (15-150 keV)    in 459.1 sec: 0.113277 ( -0.007838  0.007123 ) ph/cm2/s
Energy fluence (15-150 keV)             : 3.22302e-06 ( -2.94104e-07  2.36873e-07 ) ergs/cm2
Band function

Time interval is from  -49.428 sec. to  409.632 sec.

Spectral model in the Band function:
------------------------------------------------------------
Parameters  : value       lower 90%   higher 90%
alpha       : -1.97465   ( 1.97467   0.467307 )
beta        : -8.83505    ( 4.51574   8.83505 )
Epeak [keV] : 104.295      ( -104.488 -104.488 )
Norm@50keV   : 7.71024E-04    ( -5.73786e-05   0.000612472 )
------------------------------------------------------------
#Fit statistic : Chi-Squared =          55.42 using 59 PHA bins.
# Reduced chi-squared =          1.008 for     55 degrees of freedom
# Null hypothesis probability =   4.587578e-01

Photon flux (15-150 keV)    in 459.1 sec: 0.113296 (    ) ph/cm2/s
Energy fluence (15-150 keV)             : 0 ( 0  0 ) ergs/cm2
Single BB

Spectral model blackbody:
------------------------------------------------------------
Parameters  : value    Lower 90%  Upper 90%
kT [keV]    : 10.3376  (  )
R^2/D10^2   : 4.35359E-02  (   )
(R is the radius in km and D10 is the distance to the source in units of 10 kpc)
------------------------------------------------------------
#Fit statistic : Chi-Squared =         128.74 using 59 PHA bins.
# Reduced chi-squared =         2.2585 for     57 degrees of freedom
# Null hypothesis probability =   1.816635e-07

Energy  Fluence     90% Error
[keV]   [erg/cm2]   [erg/cm2]
15- 25  4.396e-07   5.351e-08
25- 50  1.145e-06   8.998e-08
50-150  6.572e-07   1.191e-07
15-150  2.241e-06   1.797e-07
Thermal bremsstrahlung (OTTB)

Spectral model: thermal bremsstrahlung
------------------------------------------------------------
Parameters  : value         Lower 90%    Upper 90%
kT [keV]    : 73.8783       (-15.1231      21.7352)
Norm        : 0.534555       (-0.0562854     0.0662047)
------------------------------------------------------------
#Fit statistic : Chi-Squared =          60.62 using 59 PHA bins.
# Reduced chi-squared =          1.063 for     57 degrees of freedom
# Null hypothesis probability =   3.467686e-01

Energy  Fluence     90% Error
[keV]   [erg/cm2]   [erg/cm2]
15- 25  6.330e-07   5.624e-08
25- 50  1.021e-06   6.841e-08
50-150  1.365e-06   2.321e-07
15-150  3.019e-06   2.624e-07
Double BB

Spectral model: bbodyrad<1> + bbodyrad<2>
------------------------------------------------------------
Parameters  : value         Lower 90%    Upper 90%
kT1 [keV]   : 5.11922        (-0.857307      0.950973)
R1^2/D10^2  : 0.499206        (-0.24674      0.600112)
kT2 [keV]   : 20.2008        (-3.335      4.72766)
R2^2/D10^2  : 2.74611E-03    (-0.00149623   0.00277418)
------------------------------------------------------------
#Fit statistic : Chi-Squared =          54.52 using 59 PHA bins.
# Reduced chi-squared =         0.9912 for     55 degrees of freedom
# Null hypothesis probability =   4.930471e-01

Energy  Fluence     90% Error
[keV]   [erg/cm2]   [erg/cm2]
15- 25  7.107e-07   1.815e-07
25- 50  9.187e-07   1.784e-07
50-150  1.520e-06   4.527e-07
15-150  3.149e-06   6.540e-07
Peak spectrum fit
Power-law model

Time interval is from  207.888 sec. to  208.888 sec.

Spectral model in power-law:
------------------------------------------------------------
Parameters  : value       lower 90%   higher 90%
Photon index: 1.63038     ( -0.280898   0.293518 )
Norm@50keV  : 7.42688E-03    ( -0.00130443   0.00126941 )
------------------------------------------------------------
#Fit statistic : Chi-Squared =          54.32 using 59 PHA bins.
# Reduced chi-squared =         0.9530 for     57 degrees of freedom
# Null hypothesis probability =   5.762593e-01

Photon flux (15-150 keV)    in 1 sec: 0.963585 ( -0.149528  0.149607 ) ph/cm2/s
Energy fluence (15-150 keV)             : 6.92146e-08 ( -1.286e-08  1.32142e-08 ) ergs/cm2
Cutoff power-law model

Time interval is from  207.888 sec. to  208.888 sec.
Spectral model in the cutoff power-law:
------------------------------------------------------------
Parameters  : value       lower 90%   higher 90%
Photon index: 1.44956     ( -1.23659   1.08826 )
Epeak [keV] : 139.632      ( -142.659 -142.659 )
Norm@50keV  : 9.28736E-03    ( -0.00926668   0.0328218 )
------------------------------------------------------------
#Fit statistic : Chi-Squared =          54.24 using 59 PHA bins.
# Reduced chi-squared =         0.9685 for     56 degrees of freedom
# Null hypothesis probability =   5.419432e-01

Photon flux (15-150 keV)    in 1 sec: 0.956078 ( -0.155983  0.154462 ) ph/cm2/s
Energy fluence (15-150 keV)             : 6.80202e-08 ( -1.45577e-08  1.41857e-08 ) ergs/cm2
Band function

Time interval is from  207.888 sec. to  208.888 sec.

Spectral model in the Band function:
------------------------------------------------------------
Parameters  : value       lower 90%   higher 90%
alpha       : -1.43930   ( 1.4393   0.560675 )
beta        : -3.86887    ( 3.54949   13.5495 )
Epeak [keV] : 136.808      ( -86.6593 -136.808 )
Norm@50keV   : 9.40471E-03    ( -0.00325399   0.00596221 )
------------------------------------------------------------
#Fit statistic : Chi-Squared =          54.23 using 59 PHA bins.
# Reduced chi-squared =         0.9861 for     55 degrees of freedom
# Null hypothesis probability =   5.038517e-01

Photon flux (15-150 keV)    in 1 sec: 0.956449 (    ) ph/cm2/s
Energy fluence (15-150 keV)             : 0 ( 0  0 ) ergs/cm2
Single BB
Spectral model blackbody:
------------------------------------------------------------
Parameters  : value    Lower 90%  Upper 90%
kT [keV]    : 12.9248  (-2.49829  3.16537)
R^2/D10^2   : 0.178726  (-0.0966272   0.207354)
(R is the radius in km and D10 is the distance to the source in units of 10 kpc)
------------------------------------------------------------
#Fit statistic : Chi-Squared =          64.79 using 59 PHA bins.
# Reduced chi-squared =          1.137 for     57 degrees of freedom
# Null hypothesis probability =   2.235089e-01

Energy  Fluence     90% Error
[keV]   [erg/cm2]   [erg/cm2]
15- 25  6.332e-09   2.035e-09
25- 50  2.167e-08   5.865e-09
50-150  2.281e-08   7.890e-09
15-150  5.082e-08   1.174e-08
Thermal bremsstrahlung (OTTB)

Spectral model: thermal bremsstrahlung
------------------------------------------------------------
Parameters  : value         Lower 90%    Upper 90%
kT [keV]    : 156.707       (-79.5886      -156.419)
Norm        : 3.96715       (-0.65289     0.854864)
------------------------------------------------------------
#Fit statistic : Chi-Squared =          54.32 using 59 PHA bins.
# Reduced chi-squared =         0.9530 for     57 degrees of freedom
# Null hypothesis probability =   5.762299e-01

Energy  Fluence     90% Error
[keV]   [erg/cm2]   [erg/cm2]
15- 25  1.015e-08   5.655e-09
25- 50  1.893e-08   1.044e-08
50-150  3.804e-08   2.242e-08
15-150  6.712e-08   3.868e-08
Double BB

Spectral model: bbodyrad<1> + bbodyrad<2>
------------------------------------------------------------
Parameters  : value         Lower 90%    Upper 90%
kT1 [keV]   : 5.80828        (-2.84252      3.48137)
R1^2/D10^2  : 2.03135        (-1.58799      34.0561)
kT2 [keV]   : 22.2734        (-7.37421      26.7918)
R2^2/D10^2  : 2.06159E-02    (-0.0190743   0.0343263)
------------------------------------------------------------
#Fit statistic : Chi-Squared =          54.37 using 59 PHA bins.
# Reduced chi-squared =         0.9885 for     55 degrees of freedom
# Null hypothesis probability =   4.987683e-01

Energy  Fluence     90% Error
[keV]   [erg/cm2]   [erg/cm2]
15- 25  1.056e-08   6.155e-09
25- 50  1.808e-08   9.490e-09
50-150  3.781e-08   2.299e-08
15-150  6.645e-08   3.472e-08
Pre-slew spectrum (Pre-slew PHA with pre-slew DRM)
Power-law model
Spectral model in power-law:
------------------------------------------------------------
Parameters  : value       lower 90%   higher 90%
Photon index: 1.94433     ( -0.125977   0.129669 )
Norm@50keV  : 1.04154E-03    ( -8.04543e-05   7.92115e-05 )
------------------------------------------------------------
#Fit statistic : Chi-Squared =          46.37 using 59 PHA bins.
# Reduced chi-squared =         0.8136 for     57 degrees of freedom
# Null hypothesis probability =   8.416748e-01

Photon flux (15-150 keV)    in 264.2 sec: 0.152365 ( -0.00965156  0.0096676 ) ph/cm2/s
Energy fluence (15-150 keV)             : 2.53193e-06 ( -1.87483e-07  1.90126e-07 ) ergs/cm2
Cutoff power-law model

Spectral model in the cutoff power-law:
------------------------------------------------------------
Parameters  : value       lower 90%   higher 90%
Photon index: 1.80900     ( -0.499808   0.432497 )
Epeak [keV] : 62.1438      (   )
Norm@50keV  : 1.23698E-03    (     )
------------------------------------------------------------
#Fit statistic : Chi-Squared =          46.12 using 59 PHA bins.
# Reduced chi-squared =         0.8236 for     56 degrees of freedom
# Null hypothesis probability =   8.240439e-01

Photon flux (15-150 keV)    in 264.2 sec: 0.151121 ( -0.010458  0.010394 ) ph/cm2/s
Energy fluence (15-150 keV)             : 2.49413e-06 ( -2.26264e-07  2.19228e-07 ) ergs/cm2
Band function
Spectral model in the Band function:
------------------------------------------------------------
Parameters  : value       lower 90%   higher 90%
alpha       : -1.80905   ( -5.18443   0.372452 )
beta        : -10.00000    ( 10   1.06581e-14 )
Epeak [keV] : 62.1416      ( -44.6443 -62.1416 )
Norm@50keV   : 1.23660E-03    ( -0.000270103   0.00107115 )
------------------------------------------------------------
#Fit statistic : Chi-Squared =          46.12 using 59 PHA bins.
# Reduced chi-squared =         0.8385 for     55 degrees of freedom
# Null hypothesis probability =   7.974493e-01

Photon flux (15-150 keV)    in 264.2 sec:  (    ) ph/cm2/s
Energy fluence (15-150 keV)             : 0 ( 0  0 ) ergs/cm2
S(25-50 keV) vs. S(50-100 keV) plot

S(25-50 keV)  = 9.65e-07
S(50-100 keV) = 9.74e-07
T90 vs. Hardness ratio plot

T90                                   = 428.827999949455 sec.
Hardness ratio (energy fluence ratio) = 1.00933
Color vs. Color plot

Count Ratio  (25-50 keV) / (15-25 keV) = 0.92751
Count Ratio (50-100 keV) / (15-25 keV) = 0.555808
Mask shadow pattern

IMX = 8.713579396343785E-02, IMY = 3.674718432211420E-01
TIME vs. PHA plot around the trigger time
TIME vs. DetID plot around the trigger time

100 us light curve (15-350 keV)

Spacecraft aspect plot
Bright source in the pre-burst/pre-slew/post-slew images
Pre-burst image of 15-350 keV band
Time interval of the image:
Pre-slew background subtracted image of 15-350 keV band
Time interval of the image:
-3.899400 260.300600

# RAcent  DECcent POSerr Theta    Phi  PeakCts   SNR AngSep     Name
#  [deg]    [deg]    ['] [deg]  [deg]                   [']
326.1173  38.4044   74.4  53.9  163.2  -0.1835  -0.2    5.6	Cyg X-2
 11.5054  40.4861    2.8  22.2 -171.9   0.7640   4.1 ------	UNKNOWN
320.8428  56.4945    2.4  58.3 -175.2   6.0551   4.8 ------	UNKNOWN
 42.9649  24.8621    3.1  14.5  -60.2   0.6922   3.7 ------	UNKNOWN
 48.6251  30.9696    0.6  20.7  -76.7   5.0211  21.0 ------	UNKNOWN
341.2657  64.0825    3.3  51.1 -162.5   1.6558   3.5 ------	UNKNOWN
356.2604  66.6551    2.8  48.1 -154.6   1.8972   4.1 ------	UNKNOWN
 77.4939  18.4142    7.3  47.0  -53.1   2.1932   2.1 ------	UNKNOWN
 77.7048  18.4628    7.2  47.2  -53.3   2.6192   2.4 ------	UNKNOWN
Post-slew image of 15-350 keV band
Time interval of the image:
305.500600 963.038100

# RAcent  DECcent POSerr Theta    Phi  PeakCts   SNR AngSep     Name
#  [deg]    [deg]    ['] [deg]  [deg]                   [']
 83.6323  22.0190    0.3  32.4  -63.3  25.0812  39.9    0.3	Crab
 72.4815  -8.8764    3.0  45.9  -14.5   2.5591   3.9 ------	UNKNOWN
Plot creation:
Sat May 30 23:58:37 EDT 2015