Special notes of this burst
Image
Pre-slew 15.0-350.0 keV image (Event data)

#   RAcent    DECcent   POSerr    Theta     Phi              Peak Cts       SNR   Name
   31.5409    14.9202   0.0135     8.7935    12.5106         0.2632925     14.121 TRIG_00433442

Foreground time interval of the image:
 -1.640   2.140 (delta_t =   3.780 [sec])
Background time interval of the image:
-134.963  -1.640 (delta_t = 133.323 [sec])
Lightcurves
Notes:
- 1) The mask-weighted light curves are using the flight position.
- 2) Multiple plots of different time binning/intervals are shown to cover all scenarios of short/long GRBs, rate/image triggers, and real/false positives.
- 3) For all the mask-weighted lightcurves, the y-axis units are counts/sec/det where a det is 0.4 x 0.4 = 0.16 sq cm.
- 4) The verticle lines correspond to following: green dotted lines are T50 interval, black dotted lines are T90 interval, blue solid line(s) is a spacecraft slew start time, and orange solid line(s) is a spacecraft slew end time.
- 5) Time of each bin is in the middle of the bin.
1 s binning
From T0-310 s to T0+310 s

From T100_start - 20 s to T100_end + 30 s

Full time interval

64 ms binning
Full time interval

From T100_start to T100_end

From T0-5 sec to T0+5 sec

16 ms binning
From T100_start-5 s to T100_start+5 s

Blue+Cyan dotted lines: Time interval of the scaled map
From 0.000000 to 1.024000
8 ms binning
From T100_start-3 s to T100_start+3 s

Blue+Cyan dotted lines: Time interval of the scaled map
From 0.000000 to 1.024000
2 ms binning
From T100_start-1 s to T100_start+1 s

Blue+Cyan dotted lines: Time interval of the scaled map
From 0.000000 to 1.024000
SN=5 or 10 sec. binning (whichever binning is satisfied first)

SN=5 or 10 sec. binning (T < 200 sec)

Quad-rate summed light curves (from T0-300s to T0+1000s)

The mask-weighted light curves based on cleaned DPHs

Spectral Evolution

Spectra
Notes:
- 1) The fitting includes the systematic errors.
- 2) When the burst includes telescope slew time periods, the fitting uses an average response file made from multiple 5-s response files through out the slew time plus single time preiod for the non-slew times, and weighted by the total counts in the corresponding time period using addrmf. An average response file is needed becuase a spectral fit using the pre-slew DRM will introduce some errors in both a spectral shape and a normalization if the PHA file contains a lot of the slew/post-slew time interval.
- 3) For fits to more complicated models (e.g. a power-law over a cutoff power-law), the BAT team has decided to require a chi-square improvement of more than 6 for each extra dof.
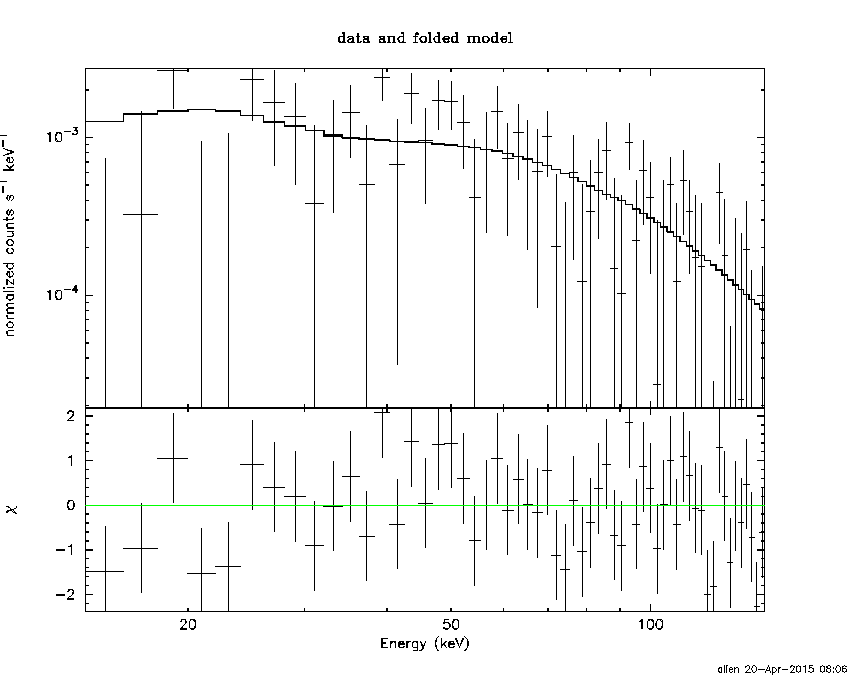
Time averaged spectrum fit using the average DRM
Power-law model

Time interval is from   -1.640 sec. to    2.140 sec.

Spectral model in power-law:
------------------------------------------------------------
Parameters  : value       lower 90%   higher 90%
Photon index: 1.08769     ( -0.19159   0.186361 )
Norm@50keV  : 4.36817E-03    ( -0.000490327   0.00048958 )
------------------------------------------------------------
#Fit statistic : Chi-Squared =          54.58 using 59 PHA bins.
# Reduced chi-squared =         0.9575 for     57 degrees of freedom
# Null hypothesis probability =   5.663925e-01

Photon flux (15-150 keV)    in 3.78 sec: 0.506097 ( -0.058048  0.0581546 ) ph/cm2/s
Energy fluence (15-150 keV)             : 1.73318e-07 ( -2.12295e-08  2.13861e-08 ) ergs/cm2
Cutoff power-law model

Time interval is from   -1.640 sec. to    2.140 sec.
Spectral model in the cutoff power-law:
------------------------------------------------------------
Parameters  : value       lower 90%   higher 90%
Photon index: 0.411414     ( -0.844697   0.734644 )
Epeak [keV] : 126.929      ( -44.9783 -126.93 )
Norm@50keV  : 9.12365E-03    ( -0.00490333   0.014092 )
------------------------------------------------------------
#Fit statistic : Chi-Squared =          52.20 using 59 PHA bins.
# Reduced chi-squared =         0.9322 for     56 degrees of freedom
# Null hypothesis probability =   6.194244e-01

Photon flux (15-150 keV)    in 3.78 sec: 0.493602 ( -0.059852  0.059841 ) ph/cm2/s
Energy fluence (15-150 keV)             : 1.6626e-07 ( -2.31945e-08  2.30716e-08 ) ergs/cm2
Band function

Time interval is from   -1.640 sec. to    2.140 sec.

Spectral model in the Band function:
------------------------------------------------------------
Parameters  : value       lower 90%   higher 90%
alpha       : 3.64459   ( -5.69682   -3.6447 )
beta        : -1.34143    ( -0.338027   0.28961 )
Epeak [keV] : 38.3812      ( -16.6611 64.2575 )
Norm@50keV   : 4.87667    ( -4.878   13.886 )
------------------------------------------------------------
#Fit statistic : Chi-Squared =          50.35 using 59 PHA bins.
# Reduced chi-squared =         0.9155 for     55 degrees of freedom
# Null hypothesis probability =   6.524542e-01

Photon flux (15-150 keV)    in 3.78 sec:  (    ) ph/cm2/s
Energy fluence (15-150 keV)             : 0 ( 0  0 ) ergs/cm2
Single BB

Spectral model blackbody:
------------------------------------------------------------
Parameters  : value    Lower 90%  Upper 90%
kT [keV]    : 19.6594  (-2.7147  3.3109)
R^2/D10^2   : 2.56396E-02  (-0.0101714   0.016102)
(R is the radius in km and D10 is the distance to the source in units of 10 kpc)
------------------------------------------------------------
#Fit statistic : Chi-Squared =          61.54 using 59 PHA bins.
# Reduced chi-squared =          1.080 for     57 degrees of freedom
# Null hypothesis probability =   3.167121e-01

Energy  Fluence     90% Error
[keV]   [erg/cm2]   [erg/cm2]
15- 25  7.270e-09   1.484e-09
25- 50  3.580e-08   6.269e-09
50-150  1.023e-07   1.956e-08
15-150  1.454e-07   2.440e-08
Thermal bremsstrahlung (OTTB)

Spectral model: thermal bremsstrahlung
------------------------------------------------------------
Parameters  : value         Lower 90%    Upper 90%
kT [keV]    : 200.000       (      )
Norm        : 2.07169       (-0.239704     0.239692)
------------------------------------------------------------
#Fit statistic : Chi-Squared =          69.12 using 59 PHA bins.
# Reduced chi-squared =          1.213 for     57 degrees of freedom
# Null hypothesis probability =   1.303851e-01

Energy  Fluence     90% Error
[keV]   [erg/cm2]   [erg/cm2]
15- 25  1.949e-08   1.081e-08
25- 50  3.750e-08   2.054e-08
50-150  8.225e-08   4.525e-08
15-150  1.392e-07   7.639e-08
Double BB

Spectral model: bbodyrad<1> + bbodyrad<2>
------------------------------------------------------------
Parameters  : value         Lower 90%    Upper 90%
kT1 [keV]   : 9.49956        (-3.27088      4.74066)
R1^2/D10^2  : 0.146953        (-0.0943999      0.336971)
kT2 [keV]   : 33.0586        (-10.0634      79.9351)
R2^2/D10^2  : 3.77778E-03    (-0.00358324   0.00963921)
------------------------------------------------------------
#Fit statistic : Chi-Squared =          50.64 using 59 PHA bins.
# Reduced chi-squared =         0.9207 for     55 degrees of freedom
# Null hypothesis probability =   6.417314e-01

Energy  Fluence     90% Error
[keV]   [erg/cm2]   [erg/cm2]
15- 25  1.231e-08   7.025e-09
25- 50  3.781e-08   1.947e-08
50-150  1.190e-07   6.279e-08
15-150  1.691e-07   8.694e-08
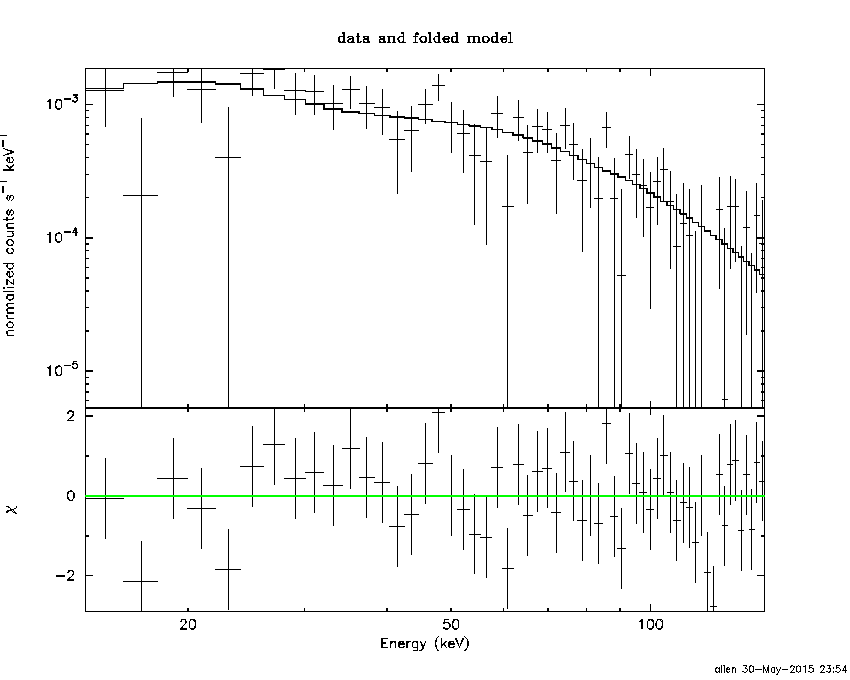
Peak spectrum fit
Power-law model
Time interval is from    0.032 sec. to    1.032 sec.

Spectral model in power-law:
------------------------------------------------------------
Parameters  : value       lower 90%   higher 90%
Photon index: 0.875971     ( -0.299884   0.280479 )
Norm@50keV  : 5.22938E-03    ( -0.000980094   0.000970001 )
------------------------------------------------------------
#Fit statistic : Chi-Squared =          56.83 using 59 PHA bins.
# Reduced chi-squared =         0.9970 for     57 degrees of freedom
# Null hypothesis probability =   4.814469e-01

Photon flux (15-150 keV)    in 1 sec: 0.600133 ( -0.111252  0.111958 ) ph/cm2/s
Energy fluence (15-150 keV)             : 5.92495e-08 ( -1.11265e-08  1.12051e-08 ) ergs/cm2
Cutoff power-law model

Time interval is from    0.032 sec. to    1.032 sec.
Spectral model in the cutoff power-law:
------------------------------------------------------------
Parameters  : value       lower 90%   higher 90%
Photon index: -0.882029     ( -2.02546   1.3721 )
Epeak [keV] : 94.1126      ( -24.7411 121.883 )
Norm@50keV  : 3.10040E-02    ( -0.0310054   0.18895 )
------------------------------------------------------------
#Fit statistic : Chi-Squared =          51.62 using 59 PHA bins.
# Reduced chi-squared =         0.9218 for     56 degrees of freedom
# Null hypothesis probability =   6.410954e-01

Photon flux (15-150 keV)    in 1 sec: 0.568718 ( -0.112415  0.114115 ) ph/cm2/s
Energy fluence (15-150 keV)             : 5.48513e-08 ( -1.21567e-08  1.21283e-08 ) ergs/cm2
Band function

Time interval is from    0.032 sec. to    1.032 sec.

Spectral model in the Band function:
------------------------------------------------------------
Parameters  : value       lower 90%   higher 90%
alpha       : 0.883375   ( -1.02425   2.29358 )
beta        : -10.0000    ( 10   20 )
Epeak [keV] : 94.0801      ( -19.38 121.834 )
Norm@50keV   : 3.10457E-02    ( -0.0310455   0.188725 )
------------------------------------------------------------
#Fit statistic : Chi-Squared =          51.62 using 59 PHA bins.
# Reduced chi-squared =         0.9386 for     55 degrees of freedom
# Null hypothesis probability =   6.044418e-01

Photon flux (15-150 keV)    in 1 sec:  (    ) ph/cm2/s
Energy fluence (15-150 keV)             : 0 ( 0  0 ) ergs/cm2
Single BB

Spectral model blackbody:
------------------------------------------------------------
Parameters  : value    Lower 90%  Upper 90%
kT [keV]    : 22.1304  (-4.13508  5.7075)
R^2/D10^2   : 2.28468E-02  (-0.0117705   0.0214515)
(R is the radius in km and D10 is the distance to the source in units of 10 kpc)
------------------------------------------------------------
#Fit statistic : Chi-Squared =          52.06 using 59 PHA bins.
# Reduced chi-squared =         0.9133 for     57 degrees of freedom
# Null hypothesis probability =   6.605711e-01

Energy  Fluence     90% Error
[keV]   [erg/cm2]   [erg/cm2]
15- 25  2.065e-09   7.145e-10
25- 50  1.096e-08   3.331e-09
50-150  4.010e-08   1.292e-08
15-150  5.313e-08   1.581e-08
Thermal bremsstrahlung (OTTB)

Spectral model: thermal bremsstrahlung
------------------------------------------------------------
Parameters  : value         Lower 90%    Upper 90%
kT [keV]    : 200.000       (      )
Norm        : 2.40034       (-0.467813     0.467778)
------------------------------------------------------------
#Fit statistic : Chi-Squared =          70.31 using 59 PHA bins.
# Reduced chi-squared =          1.234 for     57 degrees of freedom
# Null hypothesis probability =   1.107553e-01

Energy  Fluence     90% Error
[keV]   [erg/cm2]   [erg/cm2]
15- 25  5.981e-09   3.524e-09
25- 50  1.150e-08   6.640e-09
50-150  2.523e-08   1.452e-08
15-150  4.272e-08   2.478e-08
Double BB

Spectral model: bbodyrad<1> + bbodyrad<2>
------------------------------------------------------------
Parameters  : value         Lower 90%    Upper 90%
kT1 [keV]   : 14.3507        (-14.4501      -14.4501)
R1^2/D10^2  : 4.10585E-02        (-0.0411761      -0.0411761)
kT2 [keV]   : 31.5953        (-32.6097      -32.6097)
R2^2/D10^2  : 4.94475E-03    (-0.00423534   0.0359509)
------------------------------------------------------------
#Fit statistic : Chi-Squared =          51.30 using 59 PHA bins.
# Reduced chi-squared =         0.9328 for     55 degrees of freedom
# Null hypothesis probability =   6.166861e-01

Energy  Fluence     90% Error
[keV]   [erg/cm2]   [erg/cm2]
15- 25  2.529e-09   2.375e-09
25- 50  1.150e-08   1.782e-08
50-150  4.179e-08   9.785e-08
15-150  5.582e-08   1.087e-07
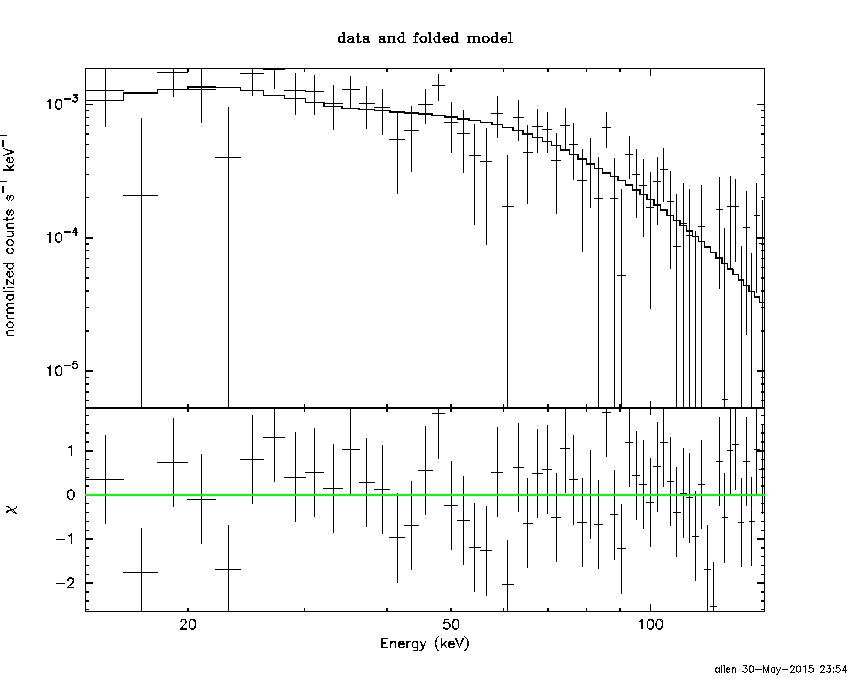
Pre-slew spectrum (Pre-slew PHA with pre-slew DRM)
Power-law model
Spectral model in power-law:
------------------------------------------------------------
Parameters  : value       lower 90%   higher 90%
Photon index: 1.08769     ( -0.19159   0.186361 )
Norm@50keV  : 4.36817E-03    ( -0.000490327   0.00048958 )
------------------------------------------------------------
#Fit statistic : Chi-Squared =          54.58 using 59 PHA bins.
# Reduced chi-squared =         0.9575 for     57 degrees of freedom
# Null hypothesis probability =   5.663925e-01

Photon flux (15-150 keV)    in 3.78 sec: 0.506097 ( -0.058048  0.0581546 ) ph/cm2/s
Energy fluence (15-150 keV)             : 1.73318e-07 ( -2.12295e-08  2.13861e-08 ) ergs/cm2
Cutoff power-law model
Spectral model in the cutoff power-law:
------------------------------------------------------------
Parameters  : value       lower 90%   higher 90%
Photon index: 0.411414     ( -0.844697   0.734644 )
Epeak [keV] : 126.929      ( -44.9783 -126.93 )
Norm@50keV  : 9.12365E-03    ( -0.00490333   0.014092 )
------------------------------------------------------------
#Fit statistic : Chi-Squared =          52.20 using 59 PHA bins.
# Reduced chi-squared =         0.9322 for     56 degrees of freedom
# Null hypothesis probability =   6.194244e-01

Photon flux (15-150 keV)    in 3.78 sec: 0.493602 ( -0.059852  0.059841 ) ph/cm2/s
Energy fluence (15-150 keV)             : 1.6626e-07 ( -2.31945e-08  2.30716e-08 ) ergs/cm2
Band function

Spectral model in the Band function:
------------------------------------------------------------
Parameters  : value       lower 90%   higher 90%
alpha       : 3.65383   ( -7.26322   -3.65393 )
beta        : -1.34141    ( -0.342474   0.289597 )
Epeak [keV] : 38.3559      ( -16.634 63.7423 )
Norm@50keV   : 4.95046    ( -4.95172   13.8143 )
------------------------------------------------------------
#Fit statistic : Chi-Squared =          50.35 using 59 PHA bins.
# Reduced chi-squared =         0.9155 for     55 degrees of freedom
# Null hypothesis probability =   6.524592e-01

Photon flux (15-150 keV)    in 3.78 sec:  (    ) ph/cm2/s
Energy fluence (15-150 keV)             : 0 ( 0  0 ) ergs/cm2
S(25-50 keV) vs. S(50-100 keV) plot

S(25-50 keV)  = 3.40e-08
S(50-100 keV) = 6.39e-08
T90 vs. Hardness ratio plot

T90                                   = 3.39599996805191 sec.
Hardness ratio (energy fluence ratio) = 1.87941
Color vs. Color plot

Count Ratio  (25-50 keV) / (15-25 keV) = 2.33603
Count Ratio (50-100 keV) / (15-25 keV) = 1.87534
Mask shadow pattern

IMX = 1.510184813019935E-01, IMY = -3.350921789987814E-02
TIME vs. PHA plot around the trigger time
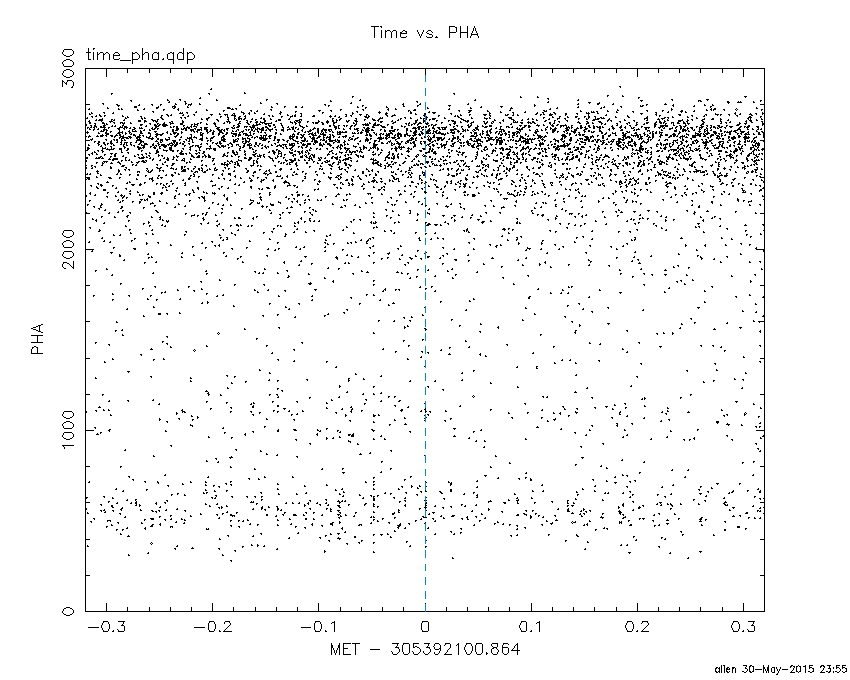
Blue+Cyan dotted lines: Time interval of the scaled map
From 0.000000 to 1.024000
TIME vs. DetID plot around the trigger time

Blue+Cyan dotted lines: Time interval of the scaled map
From 0.000000 to 1.024000
100 us light curve (15-350 keV)

Blue+Cyan dotted lines: Time interval of the scaled map
From 0.000000 to 1.024000
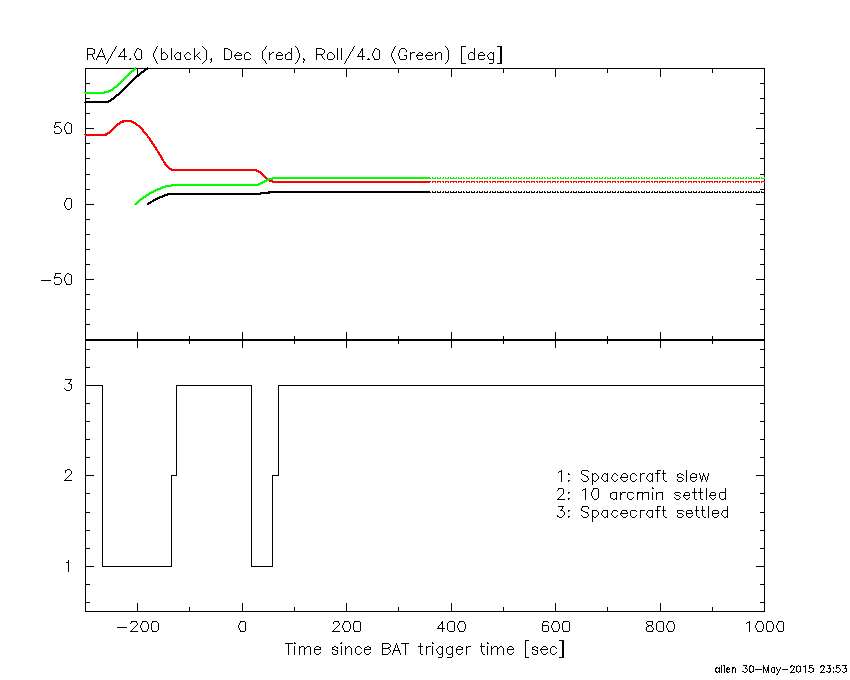
Spacecraft aspect plot
Bright source in the pre-burst/pre-slew/post-slew images
Pre-burst image of 15-350 keV band
Time interval of the image:
-134.963400 -1.640000

# RAcent  DECcent POSerr Theta    Phi  PeakCts   SNR AngSep     Name
#  [deg]    [deg]    ['] [deg]  [deg]                   [']
326.2406  38.3128    5.0  53.8  162.2   1.3851   2.3    3.3	Cyg X-2
 27.5439 -25.9926    2.6  48.7   40.2   2.4007   4.3 ------	UNKNOWN
 25.9359   5.9401    2.1  16.9   45.1   0.6260   5.4 ------	UNKNOWN
Pre-slew background subtracted image of 15-350 keV band
Time interval of the image:
-1.640000 2.140000

# RAcent  DECcent POSerr Theta    Phi  PeakCts   SNR AngSep     Name
#  [deg]    [deg]    ['] [deg]  [deg]                   [']
326.1674  38.4304   19.2  53.9  162.4   0.0596   0.6    6.5	Cyg X-2
 22.6907   8.3445    2.8  15.1   58.2   0.0796   4.2 ------	UNKNOWN
 17.3483  15.3746    2.3  11.9   94.1   0.0940   5.0 ------	UNKNOWN
 31.5409  14.9202    0.8   8.8   12.5   0.2632  14.1 ------	UNKNOWN
Post-slew image of 15-350 keV band
Time interval of the image:
57.836600 962.236700

# RAcent  DECcent POSerr Theta    Phi  PeakCts   SNR AngSep     Name
#  [deg]    [deg]    ['] [deg]  [deg]                   [']
349.2564  59.8058    2.8  54.4  177.1   6.6977   4.2 ------	UNKNOWN
 46.9583 -16.6265    3.0  35.0   -4.7   2.1966   3.9 ------	UNKNOWN
  1.7461  69.0411    2.7  57.3 -170.5   9.2371   4.3 ------	UNKNOWN
Plot creation:
Sat May 30 23:55:12 EDT 2015