Click here for the BAT GCN circular template
Image
Pre-slew 15.0-350.0 keV image (Event data)

#   RAcent    DECcent   POSerr    Theta     Phi              Peak Cts       SNR   Name
   28.6976    55.6340   0.0026    40.7779  -150.4510         7.6037461     72.805 TRIG_00433509

Foreground time interval of the image:
 -0.220   9.933 (delta_t =  10.153 [sec])
Background time interval of the image:
-239.568  -0.220 (delta_t = 239.348 [sec])
Lightcurves
Notes:
- 1) The mask-weighted light curves are using the flight position.
- 2) Multiple plots of different time binning/intervals are shown to cover all scenarios of short/long GRBs, rate/image triggers, and real/false positives.
- 3) For all the mask-weighted lightcurves, the y-axis units are counts/sec/det where a det is 0.4 x 0.4 = 0.16 sq cm.
- 4) The verticle lines correspond to following: green dotted lines are T50 interval, black dotted lines are T90 interval, blue solid line(s) is a spacecraft slew start time, and orange solid line(s) is a spacecraft slew end time.
- 5) Time of each bin is in the middle of the bin.
1 s binning
From T0-310 s to T0+310 s

From T100_start - 20 s to T100_end + 30 s

Full time interval

64 ms binning
Full time interval

From T100_start to T100_end
From T0-5 sec to T0+5 sec
16 ms binning
From T100_start-5 s to T100_start+5 s

Blue+Cyan dotted lines: Time interval of the scaled map
From 0.000000 to 0.512000
8 ms binning
From T100_start-3 s to T100_start+3 s

Blue+Cyan dotted lines: Time interval of the scaled map
From 0.000000 to 0.512000
2 ms binning
From T100_start-1 s to T100_start+1 s
Blue+Cyan dotted lines: Time interval of the scaled map
From 0.000000 to 0.512000
SN=5 or 10 sec. binning (whichever binning is satisfied first)

SN=5 or 10 sec. binning (T < 200 sec)

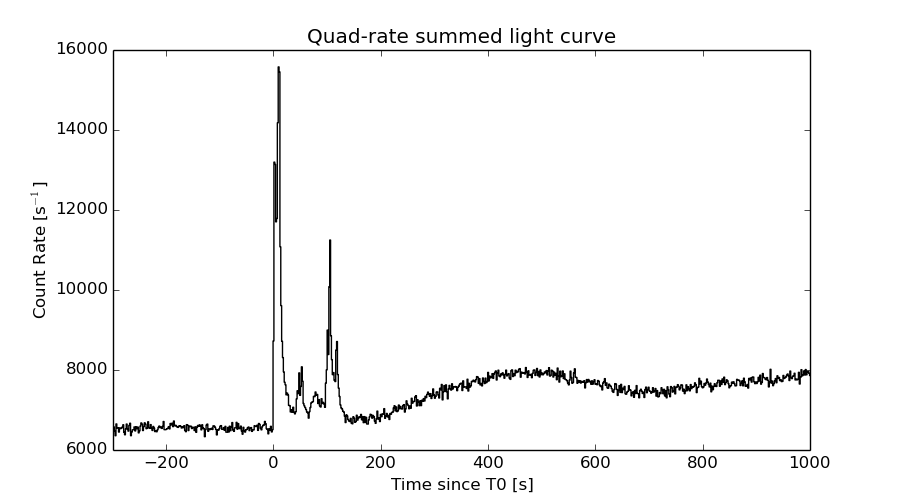
Quad-rate summed light curves (from T0-300s to T0+1000s)
Spectral Evolution

Spectra
Notes:
- 1) The fitting includes the systematic errors.
- 2) When the burst includes telescope slew time periods, the fitting uses an average response file made from multiple 5-s response files through out the slew time plus single time preiod for the non-slew times, and weighted by the total counts in the corresponding time period using addrmf. An average response file is needed becuase a spectral fit using the pre-slew DRM will introduce some errors in both a spectral shape and a normalization if the PHA file contains a lot of the slew/post-slew time interval.
- 3) For fits to more complicated models (e.g. a power-law over a cutoff power-law), the BAT team has decided to require a chi-square improvement of more than 6 for each extra dof.
Time averaged spectrum fit using the average DRM
Power-law model

Time interval is from   -0.220 sec. to  130.456 sec.

Spectral model in power-law:
------------------------------------------------------------
Parameters  : value       lower 90%   higher 90%
Photon index: 1.72288     ( -0.035363   0.0354203 )
Norm@50keV  : 9.84613E-03    ( -0.000172642   0.000172626 )
------------------------------------------------------------
#Fit statistic : Chi-Squared =          55.58 using 59 PHA bins.
# Reduced chi-squared =         0.9751 for     57 degrees of freedom
# Null hypothesis probability =   5.285587e-01

Photon flux (15-150 keV)    in 130.7 sec: 1.31831 ( -0.029153  0.0293202 ) ph/cm2/s
Energy fluence (15-150 keV)             : 1.18949e-05 ( -2.09002e-07  2.09025e-07 ) ergs/cm2
Cutoff power-law model

Time interval is from   -0.220 sec. to  130.456 sec.
Spectral model in the cutoff power-law:
------------------------------------------------------------
Parameters  : value       lower 90%   higher 90%
Photon index: 1.72256     ( -0.036671   0.0348141 )
Epeak [keV] : 9999.36      ( -9999.35 -9999.36 )
Norm@50keV  : 9.85957E-03    ( -0.000171173   0.00112972 )
------------------------------------------------------------
#Fit statistic : Chi-Squared =          55.60 using 59 PHA bins.
# Reduced chi-squared =         0.9928 for     56 degrees of freedom
# Null hypothesis probability =   4.900551e-01

Photon flux (15-150 keV)    in 130.7 sec: 1.31781 ( -0.02807  0.02835 ) ph/cm2/s
Energy fluence (15-150 keV)             : 1.1896e-05 ( -2.09538e-07  2.0699e-07 ) ergs/cm2
Band function

Time interval is from   -0.220 sec. to  130.456 sec.

Spectral model in the Band function:
------------------------------------------------------------
Parameters  : value       lower 90%   higher 90%
alpha       : -1.30869   ( 1.3087   6.18848 )
beta        : -1.72556    ( -0.607268   0.037489 )
Epeak [keV] : 42.4102      ( -42.409 -42.409 )
Norm@50keV   : 1.97707E-02    ( -0.00986937   1.70171e+06 )
------------------------------------------------------------
#Fit statistic : Chi-Squared =          55.49 using 59 PHA bins.
# Reduced chi-squared =          1.009 for     55 degrees of freedom
# Null hypothesis probability =   4.559671e-01

Photon flux (15-150 keV)    in 130.7 sec:  (    ) ph/cm2/s
Energy fluence (15-150 keV)             : 0 ( 0  0 ) ergs/cm2
Single BB

Spectral model blackbody:
------------------------------------------------------------
Parameters  : value    Lower 90%  Upper 90%
kT [keV]    : 16.3096  (  )
R^2/D10^2   : 9.64731E-02  (   )
(R is the radius in km and D10 is the distance to the source in units of 10 kpc)
------------------------------------------------------------
#Fit statistic : Chi-Squared =         861.85 using 59 PHA bins.
# Reduced chi-squared =         15.120 for     57 degrees of freedom
# Null hypothesis probability =  3.701165e-144

Energy  Fluence     90% Error
[keV]   [erg/cm2]   [erg/cm2]
15- 25  6.904e-07   2.673e-08
25- 50  2.953e-06   8.038e-08
50-150  5.529e-06   1.634e-07
15-150  9.173e-06   1.823e-07
Thermal bremsstrahlung (OTTB)

Spectral model: thermal bremsstrahlung
------------------------------------------------------------
Parameters  : value         Lower 90%    Upper 90%
kT [keV]    : 157.453       (      )
Norm        : 5.20986       (-0.13091     0.136864)
------------------------------------------------------------
#Fit statistic : Chi-Squared =          84.89 using 59 PHA bins.
# Reduced chi-squared =          1.489 for     57 degrees of freedom
# Null hypothesis probability =   9.694745e-03

Energy  Fluence     90% Error
[keV]   [erg/cm2]   [erg/cm2]
15- 25  1.731e-06   8.234e-08
25- 50  3.234e-06   1.320e-07
50-150  6.529e-06   1.311e-06
15-150  1.149e-05   1.331e-06
Double BB

Spectral model: bbodyrad<1> + bbodyrad<2>
------------------------------------------------------------
Parameters  : value         Lower 90%    Upper 90%
kT1 [keV]   : 7.26198        (-0.444508      0.465768)
R1^2/D10^2  : 1.31655        (-0.272608      0.362833)
kT2 [keV]   : 27.9637        (-1.67958      1.97699)
R2^2/D10^2  : 1.10267E-02    (-0.0024338   0.0028643)
------------------------------------------------------------
#Fit statistic : Chi-Squared =          76.82 using 59 PHA bins.
# Reduced chi-squared =          1.397 for     55 degrees of freedom
# Null hypothesis probability =   2.762303e-02

Energy  Fluence     90% Error
[keV]   [erg/cm2]   [erg/cm2]
15- 25  1.696e-06   1.026e-07
25- 50  3.322e-06   1.052e-07
50-150  6.648e-06   2.143e-07
15-150  1.167e-05   3.196e-07
Peak spectrum fit
Power-law model

Time interval is from   10.480 sec. to   11.480 sec.

Spectral model in power-law:
------------------------------------------------------------
Parameters  : value       lower 90%   higher 90%
Photon index: 1.39885     ( -0.0666405   0.0667566 )
Norm@50keV  : 8.37969E-02    ( -0.0032347   0.00323417 )
------------------------------------------------------------
#Fit statistic : Chi-Squared =          48.15 using 59 PHA bins.
# Reduced chi-squared =         0.8447 for     57 degrees of freedom
# Null hypothesis probability =   7.918262e-01

Photon flux (15-150 keV)    in 1 sec: 10.2022 ( -0.413532  0.414121 ) ph/cm2/s
Energy fluence (15-150 keV)             : 8.09892e-07 ( -3.37641e-08  3.38281e-08 ) ergs/cm2
Cutoff power-law model

Time interval is from   10.480 sec. to   11.480 sec.
Spectral model in the cutoff power-law:
------------------------------------------------------------
Parameters  : value       lower 90%   higher 90%
Photon index: 1.00777     ( -0.281912   0.265455 )
Epeak [keV] : 138.371      ( -36.4541 163.144 )
Norm@50keV  : 0.127910    ( -0.0311682   0.0441455 )
------------------------------------------------------------
#Fit statistic : Chi-Squared =          41.65 using 59 PHA bins.
# Reduced chi-squared =         0.7438 for     56 degrees of freedom
# Null hypothesis probability =   9.233404e-01

Photon flux (15-150 keV)    in 1 sec: 10.0155 ( -0.4304  0.431 ) ph/cm2/s
Energy fluence (15-150 keV)             : 7.94921e-07 ( -3.5884e-08  3.5728e-08 ) ergs/cm2
Band function

Time interval is from   10.480 sec. to   11.480 sec.

Spectral model in the Band function:
------------------------------------------------------------
Parameters  : value       lower 90%   higher 90%
alpha       : -0.394181   ( -0.346671   5.32886 )
beta        : -1.55082    ( 1.55432   0.132494 )
Epeak [keV] : 63.8438      ( -41.8377 177.146 )
Norm@50keV   : 0.311508    ( -0.196748   1987.29 )
------------------------------------------------------------
#Fit statistic : Chi-Squared =          40.86 using 59 PHA bins.
# Reduced chi-squared =         0.7430 for     55 degrees of freedom
# Null hypothesis probability =   9.220991e-01

Photon flux (15-150 keV)    in 1 sec:  (    ) ph/cm2/s
Energy fluence (15-150 keV)             : 0 ( 0  0 ) ergs/cm2
Single BB

Spectral model blackbody:
------------------------------------------------------------
Parameters  : value    Lower 90%  Upper 90%
kT [keV]    : 17.1274  (  )
R^2/D10^2   : 0.752812  (   )
(R is the radius in km and D10 is the distance to the source in units of 10 kpc)
------------------------------------------------------------
#Fit statistic : Chi-Squared =         170.07 using 59 PHA bins.
# Reduced chi-squared =         2.9836 for     57 degrees of freedom
# Null hypothesis probability =   3.482359e-13

Energy  Fluence     90% Error
[keV]   [erg/cm2]   [erg/cm2]
15- 25  4.488e-08   3.505e-09
25- 50  1.998e-07   1.120e-08
50-150  4.194e-07   2.830e-08
15-150  6.641e-07   3.045e-08
Thermal bremsstrahlung (OTTB)

Spectral model: thermal bremsstrahlung
------------------------------------------------------------
Parameters  : value         Lower 90%    Upper 90%
kT [keV]    : 200.000       (      )
Norm        : 42.4895       (-1.64284     1.64257)
------------------------------------------------------------
#Fit statistic : Chi-Squared =          60.42 using 59 PHA bins.
# Reduced chi-squared =          1.060 for     57 degrees of freedom
# Null hypothesis probability =   3.533033e-01

Energy  Fluence     90% Error
[keV]   [erg/cm2]   [erg/cm2]
15- 25  1.058e-07   4.850e-09
25- 50  2.035e-07   8.500e-09
50-150  4.464e-07   1.930e-08
15-150  7.557e-07   3.180e-08
Double BB

Spectral model: bbodyrad<1> + bbodyrad<2>
------------------------------------------------------------
Parameters  : value         Lower 90%    Upper 90%
kT1 [keV]   : 8.01526        (-1.13419      1.25775)
R1^2/D10^2  : 6.00931        (-2.14133      3.81225)
kT2 [keV]   : 28.9867        (-3.67596      5.58481)
R2^2/D10^2  : 9.75330E-02    (-0.0453161   0.0635859)
------------------------------------------------------------
#Fit statistic : Chi-Squared =          41.71 using 59 PHA bins.
# Reduced chi-squared =         0.7583 for     55 degrees of freedom
# Null hypothesis probability =   9.068819e-01

Energy  Fluence     90% Error
[keV]   [erg/cm2]   [erg/cm2]
15- 25  8.300e-08   1.284e-08
25- 50  2.024e-07   2.145e-08
50-150  5.109e-07   7.750e-08
15-150  7.962e-07   1.034e-07
Pre-slew spectrum (Pre-slew PHA with pre-slew DRM)
Power-law model

Spectral model in power-law:
------------------------------------------------------------
Parameters  : value       lower 90%   higher 90%
Photon index: 1.38905     ( -0.0358608   0.0357946 )
Norm@50keV  : 5.28501E-02    ( -0.00104753   0.00104697 )
------------------------------------------------------------
#Fit statistic : Chi-Squared =          61.69 using 59 PHA bins.
# Reduced chi-squared =          1.082 for     57 degrees of freedom
# Null hypothesis probability =   3.122081e-01

Photon flux (15-150 keV)    in 10.15 sec: 6.42033 ( -0.144489  0.144901 ) ph/cm2/s
Energy fluence (15-150 keV)             : 5.19505e-06 ( -1.03865e-07  1.03895e-07 ) ergs/cm2
Cutoff power-law model

Spectral model in the cutoff power-law:
------------------------------------------------------------
Parameters  : value       lower 90%   higher 90%
Photon index: 1.13445     ( -0.14946   0.144913 )
Epeak [keV] : 201.158      ( -52.5061 175.825 )
Norm@50keV  : 6.79522E-02    ( -0.00885594   0.0104974 )
------------------------------------------------------------
#Fit statistic : Chi-Squared =          52.53 using 59 PHA bins.
# Reduced chi-squared =         0.9381 for     56 degrees of freedom
# Null hypothesis probability =   6.068630e-01

Photon flux (15-150 keV)    in 10.15 sec: 6.30370 ( -0.1565  0.15731 ) ph/cm2/s
Energy fluence (15-150 keV)             : 5.14223e-06 ( -1.09184e-07  1.0895e-07 ) ergs/cm2
Band function

Spectral model in the Band function:
------------------------------------------------------------
Parameters  : value       lower 90%   higher 90%
alpha       : -4.80733E-02   ( -1.0557   1.83396 )
beta        : -1.46672    ( -0.100227   0.0554914 )
Epeak [keV] : 52.7651      ( -16.5544 87.0417 )
Norm@50keV   : 0.328932    ( -0.327593   5.59783 )
------------------------------------------------------------
#Fit statistic : Chi-Squared =          47.93 using 59 PHA bins.
# Reduced chi-squared =         0.8714 for     55 degrees of freedom
# Null hypothesis probability =   7.392857e-01

Photon flux (15-150 keV)    in 10.15 sec:  (    ) ph/cm2/s
Energy fluence (15-150 keV)             : 0 ( 0  0 ) ergs/cm2
S(25-50 keV) vs. S(50-100 keV) plot

S(25-50 keV)  = 3.25e-06
S(50-100 keV) = 3.94e-06
T90 vs. Hardness ratio plot

T90                                   = 114.631999969482 sec.
Hardness ratio (energy fluence ratio) = 1.21231
Color vs. Color plot

Count Ratio  (25-50 keV) / (15-25 keV) = 1.1842
Count Ratio (50-100 keV) / (15-25 keV) = 0.827688
Mask shadow pattern

IMX = -7.503218835992842E-01, IMY = 4.253591034882063E-01
TIME vs. PHA plot around the trigger time

Blue+Cyan dotted lines: Time interval of the scaled map
From 0.000000 to 0.512000
TIME vs. DetID plot around the trigger time

Blue+Cyan dotted lines: Time interval of the scaled map
From 0.000000 to 0.512000
100 us light curve (15-350 keV)

Blue+Cyan dotted lines: Time interval of the scaled map
From 0.000000 to 0.512000
Spacecraft aspect plot

Bright source in the pre-burst/pre-slew/post-slew images
Pre-burst image of 15-350 keV band
Time interval of the image:
-239.568000 -0.220000

# RAcent  DECcent POSerr Theta    Phi  PeakCts   SNR AngSep     Name
#  [deg]    [deg]    ['] [deg]  [deg]                   [']
  4.6816  -3.0756    2.6  32.1   90.1   1.4847   4.4  336.0	UNKNOWN
338.8633  55.0988    3.2  56.9  179.1   3.5912   3.6 ------	UNKNOWN
 51.6414  -3.2609    2.3  27.0  -17.2   0.8409   5.0 ------	UNKNOWN
346.6147  63.0392    3.2  57.3 -170.3   2.8555   3.6 ------	UNKNOWN
 71.7380  19.7532    3.3  38.6  -71.1   1.6383   3.5 ------	UNKNOWN
 78.8954   6.7995    3.3  47.1  -53.4   2.6575   3.5 ------	UNKNOWN
 71.7772  33.6110    3.3  40.8  -92.6   2.8851   3.5 ------	UNKNOWN
 54.7276  62.5648    2.7  50.4 -134.4   3.5156   4.3 ------	UNKNOWN
Pre-slew background subtracted image of 15-350 keV band
Time interval of the image:
-0.220000 9.932590

# RAcent  DECcent POSerr Theta    Phi  PeakCts   SNR AngSep     Name
#  [deg]    [deg]    ['] [deg]  [deg]                   [']
 42.6433 -21.0567    2.5  37.6   14.9   0.3803   4.5 ------	UNKNOWN
 44.9803  10.0558    2.7  14.0  -39.2   0.2677   4.3 ------	UNKNOWN
 52.0409  22.8074    2.6  20.9  -83.3   0.3540   4.5 ------	UNKNOWN
 67.3651  -9.8638    2.7  43.3  -25.2   0.4770   4.3 ------	UNKNOWN
 28.6976  55.6340    0.2  40.8 -150.5   7.6024  72.8 ------	UNKNOWN
Post-slew image of 15-350 keV band
Time interval of the image:
69.132590 962.458600

# RAcent  DECcent POSerr Theta    Phi  PeakCts   SNR AngSep     Name
#  [deg]    [deg]    ['] [deg]  [deg]                   [']
 83.6318  22.0169    0.6  52.4  -29.3  30.9807  20.1    0.2	Crab
308.1185  40.9485    8.5  52.4  153.8   3.7181   1.3    0.4	Cyg X-3
325.9850  38.4422  103.3  44.3  138.5   0.1844   0.1   11.4	Cyg X-2
 28.6616  55.6469    1.1   0.0 -156.2   5.6072  10.8 ------	UNKNOWN
 54.2624  56.3139    2.8  14.3  -59.4   1.9394   4.1 ------	UNKNOWN
 95.4402  37.8918    3.0  46.9  -53.1  10.2289   3.9 ------	UNKNOWN
 95.9492  38.0212    3.2  47.1  -53.6   9.3968   3.6 ------	UNKNOWN
Plot creation:
Sat May 30 23:53:25 EDT 2015