Click here for the BAT GCN circular template
Image
Pre-slew 15.0-350.0 keV image (Event data)
#   RAcent    DECcent   POSerr    Theta     Phi              Peak Cts       SNR   Name
    0.6693     7.0073   0.0050    33.1059    99.4698        13.2954125     38.696 TRIG_00434843

Foreground time interval of the image:
 -1.760  87.244 (delta_t =  89.004 [sec])
Background time interval of the image:
-239.104  -1.760 (delta_t = 237.344 [sec])
Lightcurves
Notes:
- 1) The mask-weighted light curves are using the flight position.
- 2) Multiple plots of different time binning/intervals are shown to cover all scenarios of short/long GRBs, rate/image triggers, and real/false positives.
- 3) For all the mask-weighted lightcurves, the y-axis units are counts/sec/det where a det is 0.4 x 0.4 = 0.16 sq cm.
- 4) The verticle lines correspond to following: green dotted lines are T50 interval, black dotted lines are T90 interval, blue solid line(s) is a spacecraft slew start time, and orange solid line(s) is a spacecraft slew end time.
- 5) Time of each bin is in the middle of the bin.
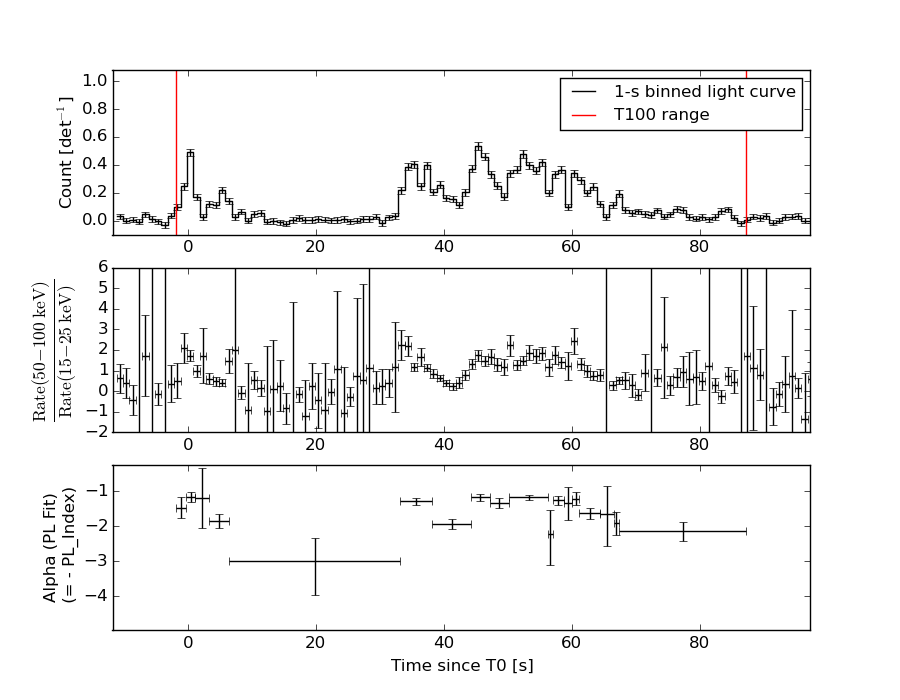
1 s binning
From T0-310 s to T0+310 s
From T100_start - 20 s to T100_end + 30 s
Full time interval
64 ms binning
Full time interval
From T100_start to T100_end
From T0-5 sec to T0+5 sec
16 ms binning
From T100_start-5 s to T100_start+5 s
Blue+Cyan dotted lines: Time interval of the scaled map
From 0.000000 to 1.024000
8 ms binning
From T100_start-3 s to T100_start+3 s
Blue+Cyan dotted lines: Time interval of the scaled map
From 0.000000 to 1.024000
2 ms binning
From T100_start-1 s to T100_start+1 s
Blue+Cyan dotted lines: Time interval of the scaled map
From 0.000000 to 1.024000
SN=5 or 10 sec. binning (whichever binning is satisfied first)
SN=5 or 10 sec. binning (T < 200 sec)
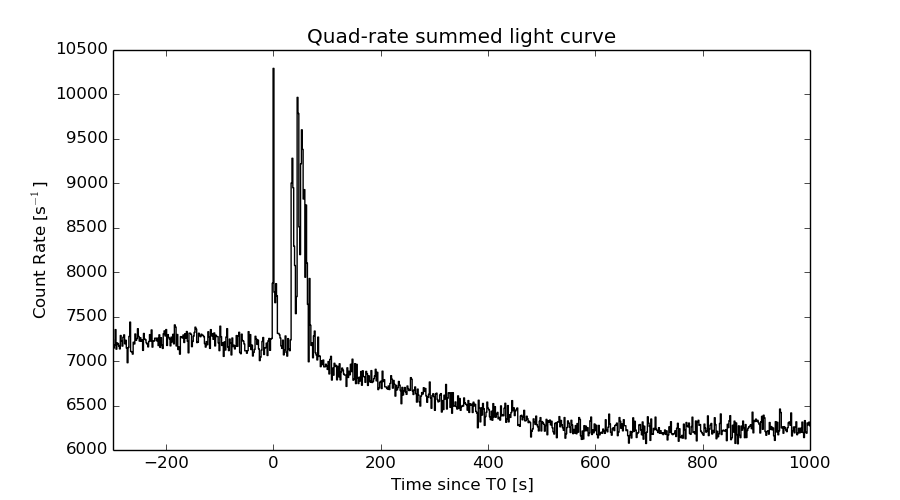
Quad-rate summed light curves (from T0-300s to T0+1000s)
Spectral Evolution
Spectra
Notes:
- 1) The fitting includes the systematic errors.
- 2) When the burst includes telescope slew time periods, the fitting uses an average response file made from multiple 5-s response files through out the slew time plus single time preiod for the non-slew times, and weighted by the total counts in the corresponding time period using addrmf. An average response file is needed becuase a spectral fit using the pre-slew DRM will introduce some errors in both a spectral shape and a normalization if the PHA file contains a lot of the slew/post-slew time interval.
- 3) For fits to more complicated models (e.g. a power-law over a cutoff power-law), the BAT team has decided to require a chi-square improvement of more than 6 for each extra dof.
Time averaged spectrum fit using the average DRM
Power-law model

Time interval is from   -1.760 sec. to   87.244 sec.

Spectral model in power-law:
------------------------------------------------------------
Parameters  : value       lower 90%   higher 90%
Photon index: 1.51633     ( -0.0562688   0.056395 )
Norm@50keV  : 9.57661E-03    ( -0.000285061   0.000284991 )
------------------------------------------------------------
#Fit statistic : Chi-Squared =          63.20 using 59 PHA bins.
# Reduced chi-squared =          1.109 for     57 degrees of freedom
# Null hypothesis probability =   2.668113e-01

Photon flux (15-150 keV)    in 89 sec: 1.20086 ( -0.038758  0.0388669 ) ph/cm2/s
Energy fluence (15-150 keV)             : 8.06441e-06 ( -2.56093e-07  2.56552e-07 ) ergs/cm2
Cutoff power-law model

Time interval is from   -1.760 sec. to   87.244 sec.
Spectral model in the cutoff power-law:
------------------------------------------------------------
Parameters  : value       lower 90%   higher 90%
Photon index: 1.24266     ( -0.237746   0.225752 )
Epeak [keV] : 149.468      ( -45.3865 378.216 )
Norm@50keV  : 1.28370E-02    ( -0.00269383   0.00361599 )
------------------------------------------------------------
#Fit statistic : Chi-Squared =          58.89 using 59 PHA bins.
# Reduced chi-squared =          1.052 for     56 degrees of freedom
# Null hypothesis probability =   3.703100e-01

Photon flux (15-150 keV)    in 89 sec: 1.17714 ( -0.04292  0.04314 ) ph/cm2/s
Energy fluence (15-150 keV)             : 7.91368e-06 ( -2.87568e-07  2.86277e-07 ) ergs/cm2
Band function

Time interval is from   -1.760 sec. to   87.244 sec.

Spectral model in the Band function:
------------------------------------------------------------
Parameters  : value       lower 90%   higher 90%
alpha       : -1.22081   ( -0.449307   1.41063 )
beta        : -1.77552    ( 1.78474   0.25929 )
Epeak [keV] : 139.270      ( -94.4856 360.747 )
Norm@50keV   : 1.31991E-02    ( -0.00280237   0.0401899 )
------------------------------------------------------------
#Fit statistic : Chi-Squared =          58.82 using 59 PHA bins.
# Reduced chi-squared =          1.069 for     55 degrees of freedom
# Null hypothesis probability =   3.373997e-01

Photon flux (15-150 keV)    in 89 sec:  (    ) ph/cm2/s
Energy fluence (15-150 keV)             : 0 ( 0  0 ) ergs/cm2
Single BB
Spectral model blackbody:
------------------------------------------------------------
Parameters  : value    Lower 90%  Upper 90%
kT [keV]    : 16.2256  (  )
R^2/D10^2   : 0.100019  (   )
(R is the radius in km and D10 is the distance to the source in units of 10 kpc)
------------------------------------------------------------
#Fit statistic : Chi-Squared =         267.95 using 59 PHA bins.
# Reduced chi-squared =         4.7008 for     57 degrees of freedom
# Null hypothesis probability =   4.457045e-29

Energy  Fluence     90% Error
[keV]   [erg/cm2]   [erg/cm2]
15- 25  4.830e-07   2.706e-08
25- 50  2.057e-06   8.989e-08
50-150  3.805e-06   2.198e-07
15-150  6.345e-06   2.229e-07
Thermal bremsstrahlung (OTTB)
Spectral model: thermal bremsstrahlung
------------------------------------------------------------
Parameters  : value         Lower 90%    Upper 90%
kT [keV]    : 200.000       (      )
Norm        : 4.90282       (-0.145334     0.145332)
------------------------------------------------------------
#Fit statistic : Chi-Squared =          62.62 using 59 PHA bins.
# Reduced chi-squared =          1.099 for     57 degrees of freedom
# Null hypothesis probability =   2.835275e-01

Energy  Fluence     90% Error
[keV]   [erg/cm2]   [erg/cm2]
15- 25  1.087e-06   3.516e-08
25- 50  2.090e-06   7.387e-08
50-150  4.585e-06   1.624e-07
15-150  7.762e-06   2.403e-07
Double BB
Spectral model: bbodyrad<1> + bbodyrad<2>
------------------------------------------------------------
Parameters  : value         Lower 90%    Upper 90%
kT1 [keV]   : 7.28294        (-0.91771      1.00655)
R1^2/D10^2  : 1.00689        (-0.345005      0.605811)
kT2 [keV]   : 26.3836        (-2.72099      3.7726)
R2^2/D10^2  : 1.47045E-02    (-0.0056734   0.00742268)
------------------------------------------------------------
#Fit statistic : Chi-Squared =          66.80 using 59 PHA bins.
# Reduced chi-squared =          1.215 for     55 degrees of freedom
# Null hypothesis probability =   1.321347e-01

Energy  Fluence     90% Error
[keV]   [erg/cm2]   [erg/cm2]
15- 25  9.478e-07   1.145e-07
25- 50  2.068e-06   1.495e-07
50-150  4.801e-06   4.294e-07
15-150  7.818e-06   6.083e-07
Peak spectrum fit
Power-law model
Time interval is from   44.460 sec. to   45.460 sec.

Spectral model in power-law:
------------------------------------------------------------
Parameters  : value       lower 90%   higher 90%
Photon index: 1.15815     ( -0.138645   0.137867 )
Norm@50keV  : 3.80065E-02    ( -0.0031388   0.0031382 )
------------------------------------------------------------
#Fit statistic : Chi-Squared =          68.85 using 59 PHA bins.
# Reduced chi-squared =          1.208 for     57 degrees of freedom
# Null hypothesis probability =   1.351358e-01

Photon flux (15-150 keV)    in 1 sec: 4.43669 ( -0.376125  0.376582 ) ph/cm2/s
Energy fluence (15-150 keV)             : 3.90303e-07 ( -3.54201e-08  3.55649e-08 ) ergs/cm2
Cutoff power-law model
Time interval is from   44.460 sec. to   45.460 sec.
Spectral model in the cutoff power-law:
------------------------------------------------------------
Parameters  : value       lower 90%   higher 90%
Photon index: 0.472774     ( -0.684066   0.592601 )
Epeak [keV] : 126.337      ( -36.9441 367.451 )
Norm@50keV  : 7.77479E-02    ( -0.0352651   0.0757849 )
------------------------------------------------------------
#Fit statistic : Chi-Squared =          64.90 using 59 PHA bins.
# Reduced chi-squared =          1.159 for     56 degrees of freedom
# Null hypothesis probability =   1.941445e-01

Photon flux (15-150 keV)    in 1 sec: 4.33127 ( -0.38812  0.38772 ) ph/cm2/s
Energy fluence (15-150 keV)             : 3.80655e-07 ( -3.7228e-08  3.7108e-08 ) ergs/cm2
Band function

Time interval is from   44.460 sec. to   45.460 sec.

Spectral model in the Band function:
------------------------------------------------------------
Parameters  : value       lower 90%   higher 90%
alpha       : -0.472775   ( -0.371102   0.726378 )
beta        : -10.0000    ( 10   20 )
Epeak [keV] : 126.319      ( -26.9977 187.797 )
Norm@50keV   : 7.77484E-02    ( -0.0352863   0.0760193 )
------------------------------------------------------------
#Fit statistic : Chi-Squared =          64.90 using 59 PHA bins.
# Reduced chi-squared =          1.180 for     55 degrees of freedom
# Null hypothesis probability =   1.696265e-01

Photon flux (15-150 keV)    in 1 sec:  (    ) ph/cm2/s
Energy fluence (15-150 keV)             : 0 ( 0  0 ) ergs/cm2
Single BB
Spectral model blackbody:
------------------------------------------------------------
Parameters  : value    Lower 90%  Upper 90%
kT [keV]    : 19.9690  (-1.90473  2.15885)
R^2/D10^2   : 0.215715  (-0.0617134   0.0837884)
(R is the radius in km and D10 is the distance to the source in units of 10 kpc)
------------------------------------------------------------
#Fit statistic : Chi-Squared =          80.58 using 59 PHA bins.
# Reduced chi-squared =          1.414 for     57 degrees of freedom
# Null hypothesis probability =   2.157875e-02

Energy  Fluence     90% Error
[keV]   [erg/cm2]   [erg/cm2]
15- 25  1.659e-08   2.700e-09
25- 50  8.256e-08   1.026e-08
50-150  2.440e-07   3.370e-08
15-150  3.432e-07   3.655e-08
Thermal bremsstrahlung (OTTB)
Spectral model: thermal bremsstrahlung
------------------------------------------------------------
Parameters  : value         Lower 90%    Upper 90%
kT [keV]    : 200.000       (      )
Norm        : 18.2629       (-1.54765     1.54755)
------------------------------------------------------------
#Fit statistic : Chi-Squared =          89.14 using 59 PHA bins.
# Reduced chi-squared =          1.564 for     57 degrees of freedom
# Null hypothesis probability =   4.156400e-03

Energy  Fluence     90% Error
[keV]   [erg/cm2]   [erg/cm2]
15- 25  4.548e-08   5.320e-09
25- 50  8.750e-08   2.546e-08
50-150  1.919e-07   8.398e-08
15-150  3.249e-07   1.120e-07
Double BB
Spectral model: bbodyrad<1> + bbodyrad<2>
------------------------------------------------------------
Parameters  : value         Lower 90%    Upper 90%
kT1 [keV]   : 4.24869        (-1.91269      7.74052)
R1^2/D10^2  : 17.3780        (-16.1018      409.689)
kT2 [keV]   : 22.9601        (-3.00084      15.4358)
R2^2/D10^2  : 0.128332    (-0.108817   0.0784)
------------------------------------------------------------
#Fit statistic : Chi-Squared =          65.54 using 59 PHA bins.
# Reduced chi-squared =          1.192 for     55 degrees of freedom
# Null hypothesis probability =   1.563950e-01

Energy  Fluence     90% Error
[keV]   [erg/cm2]   [erg/cm2]
15- 25  3.328e-08   1.379e-08
25- 50  7.549e-08   1.655e-08
50-150  2.621e-07   4.900e-08
15-150  3.708e-07   5.590e-08
Pre-slew spectrum (Pre-slew PHA with pre-slew DRM)
Power-law model
Spectral model in power-law:
------------------------------------------------------------
Parameters  : value       lower 90%   higher 90%
Photon index: 1.51633     ( -0.0562688   0.056395 )
Norm@50keV  : 9.57661E-03    ( -0.000285061   0.000284991 )
------------------------------------------------------------
#Fit statistic : Chi-Squared =          63.20 using 59 PHA bins.
# Reduced chi-squared =          1.109 for     57 degrees of freedom
# Null hypothesis probability =   2.668113e-01

Photon flux (15-150 keV)    in 89 sec: 1.20086 ( -0.038758  0.0388669 ) ph/cm2/s
Energy fluence (15-150 keV)             : 8.06441e-06 ( -2.56093e-07  2.56552e-07 ) ergs/cm2
Cutoff power-law model
Spectral model in the cutoff power-law:
------------------------------------------------------------
Parameters  : value       lower 90%   higher 90%
Photon index: 1.24266     ( -0.237746   0.225752 )
Epeak [keV] : 149.468      ( -45.3865 378.216 )
Norm@50keV  : 1.28370E-02    ( -0.00269383   0.00361599 )
------------------------------------------------------------
#Fit statistic : Chi-Squared =          58.89 using 59 PHA bins.
# Reduced chi-squared =          1.052 for     56 degrees of freedom
# Null hypothesis probability =   3.703100e-01

Photon flux (15-150 keV)    in 89 sec: 1.17714 ( -0.04292  0.04314 ) ph/cm2/s
Energy fluence (15-150 keV)             : 7.91368e-06 ( -2.87568e-07  2.86277e-07 ) ergs/cm2
Band function
Spectral model in the Band function:
------------------------------------------------------------
Parameters  : value       lower 90%   higher 90%
alpha       : -1.22081   ( -0.449307   1.41063 )
beta        : -1.77552    ( 1.78474   0.25929 )
Epeak [keV] : 139.270      ( -94.4856 363.088 )
Norm@50keV   : 1.31991E-02    ( -0.00280237   0.0401899 )
------------------------------------------------------------
#Fit statistic : Chi-Squared =          58.82 using 59 PHA bins.
# Reduced chi-squared =          1.069 for     55 degrees of freedom
# Null hypothesis probability =   3.373997e-01

Photon flux (15-150 keV)    in 89 sec:  (    ) ph/cm2/s
Energy fluence (15-150 keV)             : 0 ( 0  0 ) ergs/cm2
S(25-50 keV) vs. S(50-100 keV) plot
S(25-50 keV)  = 2.01e-06
S(50-100 keV) = 2.81e-06
T90 vs. Hardness ratio plot
T90                                   = 71.9479999542236 sec.
Hardness ratio (energy fluence ratio) = 1.39801
Color vs. Color plot
Count Ratio  (25-50 keV) / (15-25 keV) = 1.40646
Count Ratio (50-100 keV) / (15-25 keV) = 1.09315
Mask shadow pattern
IMX = -1.072788815451070E-01, IMY = -6.431526300249275E-01
TIME vs. PHA plot around the trigger time
Blue+Cyan dotted lines: Time interval of the scaled map
From 0.000000 to 1.024000
TIME vs. DetID plot around the trigger time
Blue+Cyan dotted lines: Time interval of the scaled map
From 0.000000 to 1.024000
100 us light curve (15-350 keV)
Blue+Cyan dotted lines: Time interval of the scaled map
From 0.000000 to 1.024000
Spacecraft aspect plot
Bright source in the pre-burst/pre-slew/post-slew images
Pre-burst image of 15-350 keV band
Time interval of the image:
-239.104000 -1.760000

# RAcent  DECcent POSerr Theta    Phi  PeakCts   SNR AngSep     Name
#  [deg]    [deg]    ['] [deg]  [deg]                   [']
 27.6204  18.1960    2.5  36.6  150.2   1.6195   4.6 ------	UNKNOWN
 49.0951  16.1531    2.2  43.0 -178.9   1.7543   5.1 ------	UNKNOWN
  6.6964 -38.3796    3.1  24.6   -6.8   0.7684   3.7 ------	UNKNOWN
 46.9565 -61.8656    3.4  47.0  -53.2   3.4363   3.5 ------	UNKNOWN
 68.4826 -23.8455    3.1  43.1 -111.9   3.6053   3.7 ------	UNKNOWN
Pre-slew background subtracted image of 15-350 keV band
Time interval of the image:
-1.760000 87.244000

# RAcent  DECcent POSerr Theta    Phi  PeakCts   SNR AngSep     Name
#  [deg]    [deg]    ['] [deg]  [deg]                   [']
  0.6693   7.0073    0.3  33.1   99.5  13.2943  38.6  422.3	UNKNOWN
332.3156 -42.2708    2.5  48.8   11.3   1.7737   4.7 ------	UNKNOWN
 55.3566   8.4278    2.5  41.8 -164.4   0.9411   4.6 ------	UNKNOWN
 17.2799 -69.2963    2.2  51.4  -35.4   1.9615   5.2 ------	UNKNOWN
Post-slew image of 15-350 keV band
Time interval of the image:
-239.104000 962.923400

# RAcent  DECcent POSerr Theta    Phi  PeakCts   SNR AngSep     Name
#  [deg]    [deg]    ['] [deg]  [deg]                   [']
  0.6836   7.0235    1.2  33.1   99.5  13.2552   9.9  423.4	UNKNOWN
 27.6032  18.1972    2.4  36.6  150.2   5.8134   4.8 ------	UNKNOWN
 23.0505  -5.8085    2.5  12.2  144.3   2.8755   4.7 ------	UNKNOWN
  6.7522 -38.4042    2.9  24.6   -6.9   2.6550   4.0 ------	UNKNOWN
 49.0835 -12.1019    2.6  26.2 -137.2   3.0815   4.4 ------	UNKNOWN
343.0727 -63.6274    2.8  52.9  -17.0   6.3085   4.1 ------	UNKNOWN
 47.0214 -61.9174    9.1  47.1  -53.2   4.4454   1.3 ------	UNKNOWN
 71.7804 -11.1619    2.4  48.0 -128.9  14.5686   4.7 ------	UNKNOWN
 72.8954  -6.9589    2.6  50.2 -133.9  16.8347   4.5 ------	UNKNOWN
Plot creation:
Sat May 30 23:48:07 EDT 2015