Special notes of this burst
Image
Pre-slew 15.0-350.0 keV image (Event data)
#   RAcent    DECcent   POSerr    Theta     Phi              Peak Cts       SNR   Name
  223.0407   -28.5441   0.0199    37.7504   -93.1662         0.6932722      9.640 TRIG_00435160

Foreground time interval of the image:
 -0.296   4.424 (delta_t =   4.720 [sec])
Background time interval of the image:
-239.976  -0.296 (delta_t = 239.680 [sec])
Lightcurves
Notes:
- 1) The mask-weighted light curves are using the flight position.
- 2) Multiple plots of different time binning/intervals are shown to cover all scenarios of short/long GRBs, rate/image triggers, and real/false positives.
- 3) For all the mask-weighted lightcurves, the y-axis units are counts/sec/det where a det is 0.4 x 0.4 = 0.16 sq cm.
- 4) The verticle lines correspond to following: green dotted lines are T50 interval, black dotted lines are T90 interval, blue solid line(s) is a spacecraft slew start time, and orange solid line(s) is a spacecraft slew end time.
- 5) Time of each bin is in the middle of the bin.
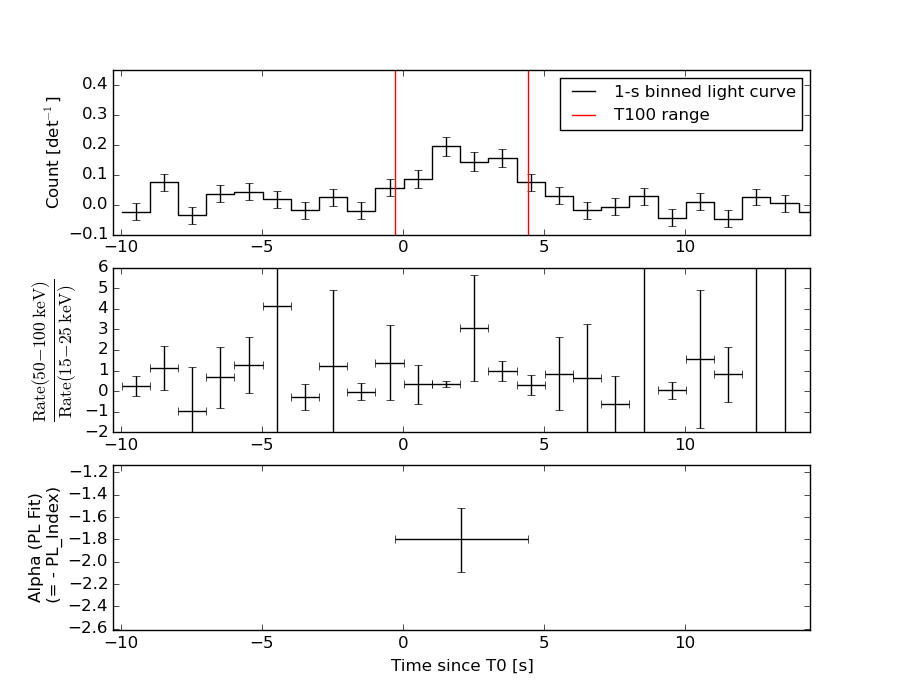
1 s binning
From T0-310 s to T0+310 s
From T100_start - 20 s to T100_end + 30 s
Full time interval
64 ms binning
Full time interval
From T100_start to T100_end
From T0-5 sec to T0+5 sec
16 ms binning
From T100_start-5 s to T100_start+5 s
Blue+Cyan dotted lines: Time interval of the scaled map
From 0.000000 to 4.096000
8 ms binning
From T100_start-3 s to T100_start+3 s
Blue+Cyan dotted lines: Time interval of the scaled map
From 0.000000 to 4.096000
2 ms binning
From T100_start-1 s to T100_start+1 s
Blue+Cyan dotted lines: Time interval of the scaled map
From 0.000000 to 4.096000
SN=5 or 10 sec. binning (whichever binning is satisfied first)
SN=5 or 10 sec. binning (T < 200 sec)
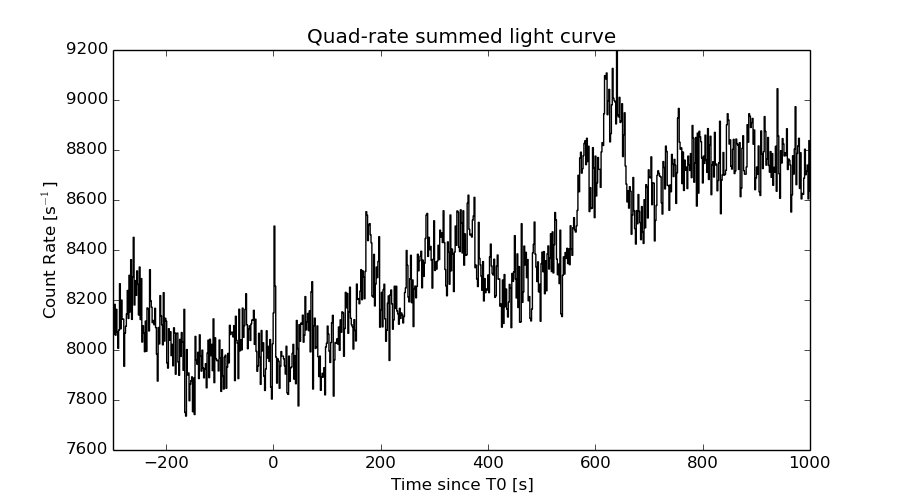
Quad-rate summed light curves (from T0-300s to T0+1000s)
Spectral Evolution
Spectra
Notes:
- 1) The fitting includes the systematic errors.
- 2) When the burst includes telescope slew time periods, the fitting uses an average response file made from multiple 5-s response files through out the slew time plus single time preiod for the non-slew times, and weighted by the total counts in the corresponding time period using addrmf. An average response file is needed becuase a spectral fit using the pre-slew DRM will introduce some errors in both a spectral shape and a normalization if the PHA file contains a lot of the slew/post-slew time interval.
- 3) For fits to more complicated models (e.g. a power-law over a cutoff power-law), the BAT team has decided to require a chi-square improvement of more than 6 for each extra dof.
Time averaged spectrum fit using the average DRM
Power-law model
Time interval is from   -0.296 sec. to    4.424 sec.

Spectral model in power-law:
------------------------------------------------------------
Parameters  : value       lower 90%   higher 90%
Photon index: 1.79600     ( -0.279759   0.292341 )
Norm@50keV  : 8.98611E-03    ( -0.00152014   0.00149413 )
------------------------------------------------------------
#Fit statistic : Chi-Squared =          55.66 using 59 PHA bins.
# Reduced chi-squared =         0.9766 for     57 degrees of freedom
# Null hypothesis probability =   5.253008e-01

Photon flux (15-150 keV)    in 4.72 sec: 1.23635 ( -0.203928  0.205207 ) ph/cm2/s
Energy fluence (15-150 keV)             : 3.90525e-07 ( -6.64633e-08  6.72123e-08 ) ergs/cm2
Cutoff power-law model

Time interval is from   -0.296 sec. to    4.424 sec.
Spectral model in the cutoff power-law:
------------------------------------------------------------
Parameters  : value       lower 90%   higher 90%
Photon index: 1.36513     ( -1.28689   0.89494 )
Epeak [keV] : 73.3169      (   )
Norm@50keV  : 1.48491E-02    (     )
------------------------------------------------------------
#Fit statistic : Chi-Squared =          55.20 using 59 PHA bins.
# Reduced chi-squared =         0.9857 for     56 degrees of freedom
# Null hypothesis probability =   5.052289e-01

Photon flux (15-150 keV)    in 4.72 sec: 1.20823 ( -0.215294  0.216 ) ph/cm2/s
Energy fluence (15-150 keV)             : 3.80093e-07 ( -7.16935e-08  7.17412e-08 ) ergs/cm2
Band function

Time interval is from   -0.296 sec. to    4.424 sec.

Spectral model in the Band function:
------------------------------------------------------------
Parameters  : value       lower 90%   higher 90%
alpha       : -1.38015   ( -0.619833   0.963397 )
beta        : -9.37109    ( 9.37167   19.3717 )
Epeak [keV] : 74.5763      ( -34.2799 -74.5737 )
Norm@50keV   : 1.45606E-02    ( -0.00674931   0.00878861 )
------------------------------------------------------------
#Fit statistic : Chi-Squared =          55.20 using 59 PHA bins.
# Reduced chi-squared =          1.004 for     55 degrees of freedom
# Null hypothesis probability =   4.671483e-01

Photon flux (15-150 keV)    in 4.72 sec:  (    ) ph/cm2/s
Energy fluence (15-150 keV)             : 3.79529e-07 ( 0  0 ) ergs/cm2
Single BB
Spectral model blackbody:
------------------------------------------------------------
Parameters  : value    Lower 90%  Upper 90%
kT [keV]    : 13.5494  (-2.70155  3.22524)
R^2/D10^2   : 0.185394  (-0.100914   0.236476)
(R is the radius in km and D10 is the distance to the source in units of 10 kpc)
------------------------------------------------------------
#Fit statistic : Chi-Squared =          65.14 using 59 PHA bins.
# Reduced chi-squared =          1.143 for     57 degrees of freedom
# Null hypothesis probability =   2.146008e-01

Energy  Fluence     90% Error
[keV]   [erg/cm2]   [erg/cm2]
15- 25  3.402e-08   1.143e-08
25- 50  1.224e-07   3.417e-08
50-150  1.454e-07   4.968e-08
15-150  3.019e-07   8.090e-08
Thermal bremsstrahlung (OTTB)
Spectral model: thermal bremsstrahlung
------------------------------------------------------------
Parameters  : value         Lower 90%    Upper 90%
kT [keV]    : 112.184       (-47.5483      -111.905)
Norm        : 5.28060       (-1.04769     1.43781)
------------------------------------------------------------
#Fit statistic : Chi-Squared =          55.23 using 59 PHA bins.
# Reduced chi-squared =         0.9689 for     57 degrees of freedom
# Null hypothesis probability =   5.419325e-01

Energy  Fluence     90% Error
[keV]   [erg/cm2]   [erg/cm2]
15- 25  6.506e-08   1.465e-08
25- 50  1.150e-07   3.443e-08
50-150  1.984e-07   1.265e-07
15-150  3.784e-07   1.632e-07
Double BB
Spectral model: bbodyrad<1> + bbodyrad<2>
------------------------------------------------------------
Parameters  : value         Lower 90%    Upper 90%
kT1 [keV]   : 5.95610        (-2.56188      3.15586)
R1^2/D10^2  : 2.48952        (-1.91586      25.3271)
kT2 [keV]   : 21.1643        (-5.89967      15.1551)
R2^2/D10^2  : 2.83653E-02    (-0.0247286   0.0499052)
------------------------------------------------------------
#Fit statistic : Chi-Squared =          54.69 using 59 PHA bins.
# Reduced chi-squared =         0.9943 for     55 degrees of freedom
# Null hypothesis probability =   4.865344e-01

Energy  Fluence     90% Error
[keV]   [erg/cm2]   [erg/cm2]
15- 25  6.609e-08   3.835e-08
25- 50  1.121e-07   5.803e-08
50-150  1.996e-07   1.087e-07
15-150  3.778e-07   2.051e-07
Peak spectrum fit
Power-law model
Time interval is from    1.308 sec. to    2.308 sec.

Spectral model in power-law:
------------------------------------------------------------
Parameters  : value       lower 90%   higher 90%
Photon index: 2.11738     ( -0.361959   0.40695 )
Norm@50keV  : 1.52299E-02    ( -0.00378566   0.00356866 )
------------------------------------------------------------
#Fit statistic : Chi-Squared =          65.63 using 59 PHA bins.
# Reduced chi-squared =          1.151 for     57 degrees of freedom
# Null hypothesis probability =   2.024868e-01

Photon flux (15-150 keV)    in 1 sec: 2.41681 ( -0.471777  0.473135 ) ph/cm2/s
Energy fluence (15-150 keV)             : 1.41749e-07 ( -3.06417e-08  3.1245e-08 ) ergs/cm2
Cutoff power-law model
Time interval is from    1.308 sec. to    2.308 sec.
Spectral model in the cutoff power-law:
------------------------------------------------------------
Parameters  : value       lower 90%   higher 90%
Photon index: 1.97337     (     )
Epeak [keV] : 11.5888      (   )
Norm@50keV  : 1.76365E-02    (     )
------------------------------------------------------------
#Fit statistic : Chi-Squared =          65.81 using 59 PHA bins.
# Reduced chi-squared =          1.175 for     56 degrees of freedom
# Null hypothesis probability =   1.736429e-01

Photon flux (15-150 keV)    in 1 sec: 2.41594 (    ) ph/cm2/s
Energy fluence (15-150 keV)             : 1.41908e-07 ( -3.1402e-08  3.0662e-08 ) ergs/cm2
Band function
Time interval is from    1.308 sec. to    2.308 sec.

Spectral model in the Band function:
------------------------------------------------------------
Parameters  : value       lower 90%   higher 90%
alpha       : -1.50774   ( 1.50594   1.50594 )
beta        : -2.15352    ( 2.1511   0.395471 )
Epeak [keV] : 21.2092      ( -21.3359 -21.3359 )
Norm@50keV   : 4.24366E-02    ( -0.0408118   6.98339e+06 )
------------------------------------------------------------
#Fit statistic : Chi-Squared =          65.63 using 59 PHA bins.
# Reduced chi-squared =          1.193 for     55 degrees of freedom
# Null hypothesis probability =   1.545303e-01

Photon flux (15-150 keV)    in 1 sec:  (    ) ph/cm2/s
Energy fluence (15-150 keV)             : 0 ( 0  0 ) ergs/cm2
Single BB
Spectral model blackbody:
------------------------------------------------------------
Parameters  : value    Lower 90%  Upper 90%
kT [keV]    : 8.61801  (-1.89281  2.51429)
R^2/D10^2   : 1.90875  (-1.21973   3.28195)
(R is the radius in km and D10 is the distance to the source in units of 10 kpc)
------------------------------------------------------------
#Fit statistic : Chi-Squared =          74.80 using 59 PHA bins.
# Reduced chi-squared =          1.312 for     57 degrees of freedom
# Null hypothesis probability =   5.698710e-02

Energy  Fluence     90% Error
[keV]   [erg/cm2]   [erg/cm2]
15- 25  2.694e-08   1.152e-08
25- 50  5.344e-08   1.988e-08
50-150  1.782e-08   1.045e-08
15-150  9.820e-08   4.116e-08
Thermal bremsstrahlung (OTTB)
Spectral model: thermal bremsstrahlung
------------------------------------------------------------
Parameters  : value         Lower 90%    Upper 90%
kT [keV]    : 60.9239       (-27.3837      70.4826)
Norm        : 12.3212       (-3.95475     5.97872)
------------------------------------------------------------
#Fit statistic : Chi-Squared =          67.29 using 59 PHA bins.
# Reduced chi-squared =          1.180 for     57 degrees of freedom
# Null hypothesis probability =   1.654249e-01

Energy  Fluence     90% Error
[keV]   [erg/cm2]   [erg/cm2]
15- 25  3.104e-08   8.100e-09
25- 50  4.747e-08   1.211e-08
50-150  5.470e-08   2.957e-08
15-150  1.332e-07   3.787e-08
Double BB
Spectral model: bbodyrad<1> + bbodyrad<2>
------------------------------------------------------------
Parameters  : value         Lower 90%    Upper 90%
kT1 [keV]   : 6.37305        (-1.84305      2.11361)
R1^2/D10^2  : 5.45587        (-3.70062      16.7932)
kT2 [keV]   : 32.5681        (-15.0702      122.771)
R2^2/D10^2  : 8.94053E-03    (-0.00856657   0.0435592)
------------------------------------------------------------
#Fit statistic : Chi-Squared =          64.52 using 59 PHA bins.
# Reduced chi-squared =          1.173 for     55 degrees of freedom
# Null hypothesis probability =   1.779745e-01

Energy  Fluence     90% Error
[keV]   [erg/cm2]   [erg/cm2]
15- 25  3.336e-08   1.932e-08
25- 50  4.520e-08   2.522e-08
50-150  6.903e-08   4.375e-08
15-150  1.476e-07   7.756e-08
Pre-slew spectrum (Pre-slew PHA with pre-slew DRM)
Power-law model

Spectral model in power-law:
------------------------------------------------------------
Parameters  : value       lower 90%   higher 90%
Photon index: 1.79600     ( -0.279759   0.292341 )
Norm@50keV  : 8.98611E-03    ( -0.00152014   0.00149413 )
------------------------------------------------------------
#Fit statistic : Chi-Squared =          55.66 using 59 PHA bins.
# Reduced chi-squared =         0.9766 for     57 degrees of freedom
# Null hypothesis probability =   5.253008e-01

Photon flux (15-150 keV)    in 4.72 sec: 1.23635 ( -0.203928  0.205207 ) ph/cm2/s
Energy fluence (15-150 keV)             : 3.90525e-07 ( -6.64633e-08  6.72123e-08 ) ergs/cm2
Cutoff power-law model

Spectral model in the cutoff power-law:
------------------------------------------------------------
Parameters  : value       lower 90%   higher 90%
Photon index: 1.36513     ( -1.28689   0.895044 )
Epeak [keV] : 73.3169      (   )
Norm@50keV  : 1.48491E-02    (     )
------------------------------------------------------------
#Fit statistic : Chi-Squared =          55.20 using 59 PHA bins.
# Reduced chi-squared =         0.9857 for     56 degrees of freedom
# Null hypothesis probability =   5.052289e-01

Photon flux (15-150 keV)    in 4.72 sec: 1.20823 ( -0.215294  0.216 ) ph/cm2/s
Energy fluence (15-150 keV)             : 3.80093e-07 ( -7.16935e-08  7.17412e-08 ) ergs/cm2
Band function
Spectral model in the Band function:
------------------------------------------------------------
Parameters  : value       lower 90%   higher 90%
alpha       : -1.38015   ( -0.619945   0.963434 )
beta        : -9.37109    ( 9.37167   19.3717 )
Epeak [keV] : 74.5763      ( -34.2799 -74.5737 )
Norm@50keV   : 1.45606E-02    ( -0.00674931   0.00878861 )
------------------------------------------------------------
#Fit statistic : Chi-Squared =          55.20 using 59 PHA bins.
# Reduced chi-squared =          1.004 for     55 degrees of freedom
# Null hypothesis probability =   4.671483e-01

Photon flux (15-150 keV)    in 4.72 sec:  (    ) ph/cm2/s
Energy fluence (15-150 keV)             : 3.79529e-07 ( 0  0 ) ergs/cm2
S(25-50 keV) vs. S(50-100 keV) plot
S(25-50 keV)  = 1.10e-07
S(50-100 keV) = 1.26e-07
T90 vs. Hardness ratio plot
T90                                   = 4.16000002622604 sec.
Hardness ratio (energy fluence ratio) = 1.14545
Color vs. Color plot
Count Ratio  (25-50 keV) / (15-25 keV) = 1.16518
Count Ratio (50-100 keV) / (15-25 keV) = 0.877271
Mask shadow pattern
IMX = -4.276569109937540E-02, IMY = 7.731133110912413E-01
TIME vs. PHA plot around the trigger time
Blue+Cyan dotted lines: Time interval of the scaled map
From 0.000000 to 4.096000
TIME vs. DetID plot around the trigger time
Blue+Cyan dotted lines: Time interval of the scaled map
From 0.000000 to 4.096000
100 us light curve (15-350 keV)
Blue+Cyan dotted lines: Time interval of the scaled map
From 0.000000 to 4.096000
Spacecraft aspect plot
Bright source in the pre-burst/pre-slew/post-slew images
Pre-burst image of 15-350 keV band
Time interval of the image:
-239.976000 -0.296000

# RAcent  DECcent POSerr Theta    Phi  PeakCts   SNR AngSep     Name
#  [deg]    [deg]    ['] [deg]  [deg]                   [']
244.9807 -15.6401    0.2  23.8  -53.5  19.0889  64.5    0.1	Sco X-1
256.0314 -37.8528    2.6  12.4 -131.6   1.0480   4.4    2.2	4U 1700-377
256.4620 -36.5639    5.7  11.3 -128.0   0.4938   2.0    8.5	GX 349+2
262.9601 -24.8325    2.3   5.1  -29.9   1.3442   5.0    5.9	GX 1+4
264.9459 -44.4436    7.4  15.5 -169.2   0.3839   1.6    8.7	4U 1735-44
268.3181  -1.3918    8.4  27.6   11.3   0.3944   1.4    4.7	SW J1753.5-0127
270.3268 -25.1037    1.8   5.2   50.5   1.6617   6.4    2.7	GX 5-1
270.1325 -25.7336   11.5   4.7   54.1   0.2707   1.0    9.2	GRS 1758-258
273.8679 -14.1119    3.3  16.4   33.8   0.8361   3.5    9.2	GX 17+2
275.8055 -30.2931    3.4   8.3  108.6   0.7774   3.4    7.6	H1820-303
285.0174 -24.9097    4.7  17.1   87.7   0.7167   2.4    1.2	HT1900.1-2455
288.7237  10.9681    4.0  45.4   38.7   3.0160   2.9    4.6	GRS 1915+105
263.1712 -33.8457    4.0   5.6 -144.7   0.7088   2.9    9.1	GX 354-0
304.7948 -20.3337    3.1  35.8   92.0   2.5275   3.8 ------	UNKNOWN
291.6036   4.2096    3.7  41.1   47.4   2.2286   3.1 ------	UNKNOWN
276.9072  23.0713    3.1  53.0   19.2   4.9102   3.8 ------	UNKNOWN
260.7846  -7.9141    3.4  21.7   -8.0   0.8955   3.4 ------	UNKNOWN
259.9297   2.5618    2.9  32.1   -5.1   1.1716   3.9 ------	UNKNOWN
254.7720 -15.2594    2.1  17.4  -33.4   1.3418   5.5 ------	UNKNOWN
238.6787 -17.1476    2.6  28.0  -64.1   1.3550   4.4 ------	UNKNOWN
200.5701 -76.0101    2.8  56.2 -157.6   4.5168   4.1 ------	UNKNOWN
	UNKNOWN
	UNKNOWN
Pre-slew background subtracted image of 15-350 keV band
Time interval of the image:
-0.296000 4.424000

# RAcent  DECcent POSerr Theta    Phi  PeakCts   SNR AngSep     Name
#  [deg]    [deg]    ['] [deg]  [deg]                   [']
245.1403 -15.4947    0.0  23.7  -52.9  -0.0250  -0.9   12.8	Sco X-1
255.9856 -37.8433   42.5  12.4 -131.5  -0.0065  -0.3    0.1	4U 1700-377
256.4273 -36.4391  523.8  11.2 -127.4  -0.0005  -0.0    1.0	GX 349+2
263.0119 -24.7997    4.9   5.1  -29.3  -0.0539  -2.3    3.3	GX 1+4
264.7456 -44.5926   10.6  15.7 -168.7   0.0260   1.1    8.6	4U 1735-44
268.2582  -1.6150    0.0  27.4   11.2   0.0138   0.5   11.8	SW J1753.5-0127
270.4239 -25.0439    4.0   5.3   50.8  -0.0680  -2.9    7.9	GX 5-1
270.1637 -25.9136    0.0   4.6   55.9  -0.0321  -1.4   12.7	GRS 1758-258
273.8862 -14.2041    0.0  16.3   33.9  -0.0254  -1.0   12.2	GX 17+2
275.7755 -30.4843    4.9   8.3  109.9  -0.0549  -2.4   10.5	H1820-303
285.2247 -24.9747    6.4  17.3   88.1   0.0479   1.8   10.8	HT1900.1-2455
288.7801  10.9892   32.2  45.4   38.8   0.0280   0.4    2.8	GRS 1915+105
262.7931 -33.6990    0.0   5.6 -141.2   0.0277   1.2   12.7	GX 354-0
323.2582 -66.9999    2.1  50.8  162.0   0.4512   5.5 ------	UNKNOWN
244.8260   7.8783    2.2  42.3  -25.6   0.2059   5.1 ------	UNKNOWN
242.3410  12.7093    3.0  47.7  -25.4   0.1884   3.9 ------	UNKNOWN
202.1438 -66.4913    1.9  53.4 -146.4   0.6533   6.1 ------	UNKNOWN
223.0407 -28.5441    1.2  37.8  -93.2   0.6936   9.6 ------	UNKNOWN
Post-slew image of 15-350 keV band
Time interval of the image:
569.324600 962.107000

# RAcent  DECcent POSerr Theta    Phi  PeakCts   SNR AngSep     Name
#  [deg]    [deg]    ['] [deg]  [deg]                   [']
186.4988 -62.9671    7.8  52.8 -146.8   2.5086   1.5   12.6	GX 301-2
244.9743 -15.6430    0.1  21.7  -38.4  36.3166  82.5    0.3	Sco X-1
256.0214 -37.8636    2.7   5.1 -154.0   1.8603   4.3    2.0	4U 1700-377
256.4895 -36.5418    2.2   3.7 -149.8   2.1679   5.2    7.6	GX 349+2
262.9703 -24.6762    1.9   9.4   24.1   2.6176   6.0    4.7	GX 1+4
264.7525 -44.5995   15.2  12.2  159.8   0.3091   0.8    9.0	4U 1735-44
268.2820  -1.3458    7.0  33.2   17.7   0.9272   1.6    8.2	SW J1753.5-0127
270.2904 -25.1044    1.8  12.9   53.8   2.7355   6.3    1.6	GX 5-1
270.1382 -25.7595   18.1  12.4   55.6   0.2764   0.6    8.9	GRS 1758-258
274.0340 -14.0549    4.4  23.7   39.5   1.4044   2.6    2.0	GX 17+2
275.7913 -30.5323    4.6  14.7   83.9   1.0927   2.5   12.1	H1820-303
285.0253 -24.9397   48.3  24.3   77.0   0.1453   0.2    1.3	HT1900.1-2455
262.8164 -33.9908    0.0   3.4  102.7  -0.3888  -0.9   12.7	GX 354-0
319.9488 -58.1420    3.1  47.2  141.2   6.8962   3.8 ------	UNKNOWN
272.3427   9.4346    2.7  44.7   19.4   4.0009   4.3 ------	UNKNOWN
267.9651   8.1644    2.2  42.4   13.7   3.5976   5.2 ------	UNKNOWN
254.7977 -15.2489    2.0  18.4  -12.1   2.4478   5.8 ------	UNKNOWN
244.2718 -12.2512    2.0  24.9  -35.4   2.4867   5.7 ------	UNKNOWN
235.3069 -38.6201    2.0  19.7 -112.1   2.6759   5.9 ------	UNKNOWN
185.5249 -63.3040    2.2  53.2 -147.3   8.9257   5.2 ------	UNKNOWN
222.7737  -0.6993    3.2  47.0  -53.3   7.5822   3.6 ------	UNKNOWN
Plot creation:
Sat May 30 23:46:20 EDT 2015