Click here for the BAT GCN circular template
Image
Pre-slew 15.0-350.0 keV image (Event data)

#   RAcent    DECcent   POSerr    Theta     Phi              Peak Cts       SNR   Name
  166.3867   -16.3831   0.0064    12.9326   -56.6631         2.1254784     30.226 TRIG_00437408

Foreground time interval of the image:
-31.923  13.277 (delta_t =  45.200 [sec])
Background time interval of the image:
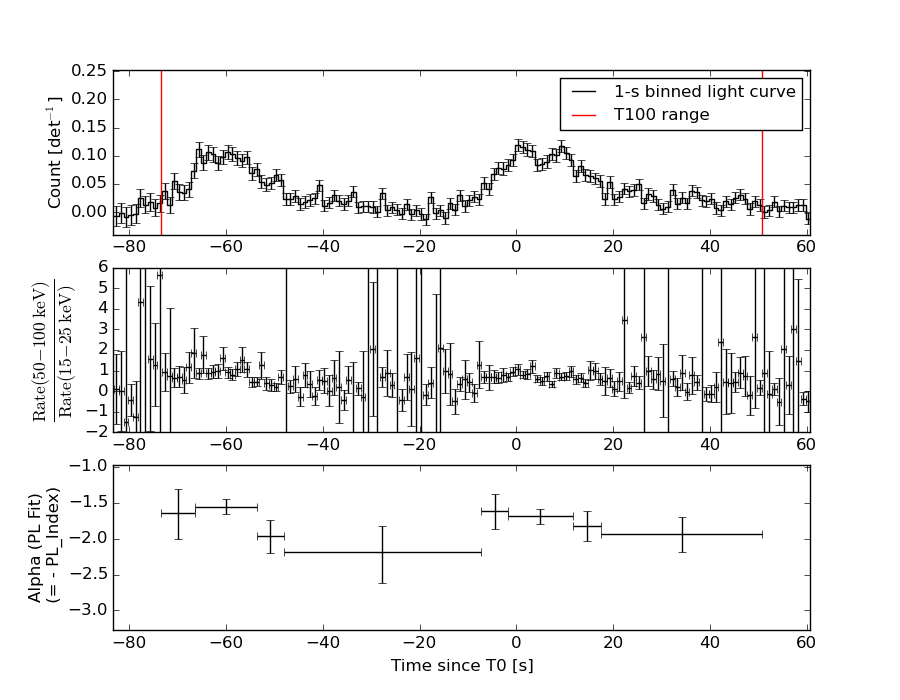
Lightcurves
Notes:
- 1) The mask-weighted light curves are using the flight position.
- 2) Multiple plots of different time binning/intervals are shown to cover all scenarios of short/long GRBs, rate/image triggers, and real/false positives.
- 3) For all the mask-weighted lightcurves, the y-axis units are counts/sec/det where a det is 0.4 x 0.4 = 0.16 sq cm.
- 4) The verticle lines correspond to following: green dotted lines are T50 interval, black dotted lines are T90 interval, blue solid line(s) is a spacecraft slew start time, and orange solid line(s) is a spacecraft slew end time.
- 5) Time of each bin is in the middle of the bin.
1 s binning
From T0-310 s to T0+310 s
From T100_start - 20 s to T100_end + 30 s

Full time interval
64 ms binning
Full time interval

From T100_start to T100_end
From T0-5 sec to T0+5 sec

16 ms binning
From T100_start-5 s to T100_start+5 s
Blue+Cyan dotted lines: Time interval of the scaled map
From 0.000000 to 1.024000
8 ms binning
From T100_start-3 s to T100_start+3 s
Blue+Cyan dotted lines: Time interval of the scaled map
From 0.000000 to 1.024000
2 ms binning
From T100_start-1 s to T100_start+1 s
Blue+Cyan dotted lines: Time interval of the scaled map
From 0.000000 to 1.024000
SN=5 or 10 sec. binning (whichever binning is satisfied first)
SN=5 or 10 sec. binning (T < 200 sec)
Quad-rate summed light curves (from T0-300s to T0+1000s)
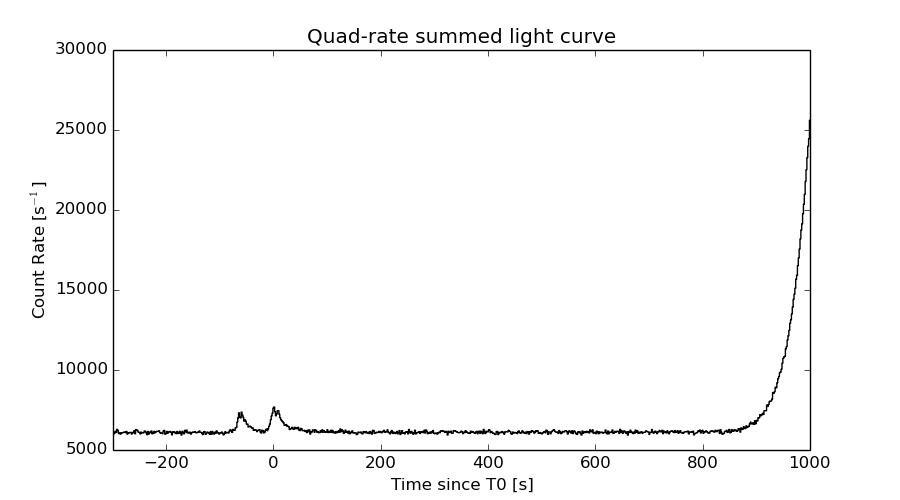
The mask-weighted light curves based on cleaned DPHs

Spectral Evolution
Spectra
Notes:
- 1) The fitting includes the systematic errors.
- 2) When the burst includes telescope slew time periods, the fitting uses an average response file made from multiple 5-s response files through out the slew time plus single time preiod for the non-slew times, and weighted by the total counts in the corresponding time period using addrmf. An average response file is needed becuase a spectral fit using the pre-slew DRM will introduce some errors in both a spectral shape and a normalization if the PHA file contains a lot of the slew/post-slew time interval.
- 3) For fits to more complicated models (e.g. a power-law over a cutoff power-law), the BAT team has decided to require a chi-square improvement of more than 6 for each extra dof.
Time averaged spectrum fit using the average DRM
Power-law model

Time interval is from  -73.512 sec. to   50.700 sec.

Spectral model in power-law:
------------------------------------------------------------
Parameters  : value       lower 90%   higher 90%
Photon index: 1.74719     ( -0.0817512   0.0826476 )
Norm@50keV  : 2.60539E-03    ( -0.000113203   0.000112589 )
------------------------------------------------------------
#Fit statistic : Chi-Squared =          47.88 using 59 PHA bins.
# Reduced chi-squared =         0.8401 for     57 degrees of freedom
# Null hypothesis probability =   7.997619e-01

Photon flux (15-150 keV)    in 124.2 sec: 0.351928 ( -0.0150856  0.0151506 ) ph/cm2/s
Energy fluence (15-150 keV)             : 2.98636e-06 ( -1.34823e-07  1.35594e-07 ) ergs/cm2
Cutoff power-law model
Time interval is from  -73.512 sec. to   50.700 sec.
Spectral model in the cutoff power-law:
------------------------------------------------------------
Parameters  : value       lower 90%   higher 90%
Photon index: 1.74845     ( -0.0837587   0.0815975 )
Epeak [keV] : 9999.36      ( -9999.35 -9999.36 )
Norm@50keV  : 2.60684E-03    ( -0.000443159   0.000993587 )
------------------------------------------------------------
#Fit statistic : Chi-Squared =          47.89 using 59 PHA bins.
# Reduced chi-squared =         0.8552 for     56 degrees of freedom
# Null hypothesis probability =   7.712931e-01

Photon flux (15-150 keV)    in 124.2 sec: 0.351828 ( -0.016315  0.015039 ) ph/cm2/s
Energy fluence (15-150 keV)             : 2.98513e-06 ( -7.68425e-08  1.34906e-07 ) ergs/cm2
Band function

Time interval is from  -73.512 sec. to   50.700 sec.

Spectral model in the Band function:
------------------------------------------------------------
Parameters  : value       lower 90%   higher 90%
alpha       : -1.44159   ( 1.44159   1.44159 )
beta        : -1.74719    ( -0.082772   0.0817373 )
Epeak [keV] : 21.7456      ( -21.7456 -21.7456 )
Norm@50keV   : 5.48408E-03    ( -0.0020568   0.363928 )
------------------------------------------------------------
#Fit statistic : Chi-Squared =          47.88 using 59 PHA bins.
# Reduced chi-squared =         0.8706 for     55 degrees of freedom
# Null hypothesis probability =   7.408237e-01

Photon flux (15-150 keV)    in 124.2 sec:  (    ) ph/cm2/s
Energy fluence (15-150 keV)             : 0 ( 0  0 ) ergs/cm2
Single BB
Spectral model blackbody:
------------------------------------------------------------
Parameters  : value    Lower 90%  Upper 90%
kT [keV]    : 13.2015  (  )
R^2/D10^2   : 5.63631E-02  (   )
(R is the radius in km and D10 is the distance to the source in units of 10 kpc)
------------------------------------------------------------
#Fit statistic : Chi-Squared =         202.94 using 59 PHA bins.
# Reduced chi-squared =         3.5603 for     57 degrees of freedom
# Null hypothesis probability =   3.044739e-18

Energy  Fluence     90% Error
[keV]   [erg/cm2]   [erg/cm2]
15- 25  2.587e-07   2.111e-08
25- 50  9.057e-07   4.105e-08
50-150  1.007e-06   9.197e-08
15-150  2.171e-06   1.043e-07
Thermal bremsstrahlung (OTTB)
Spectral model: thermal bremsstrahlung
------------------------------------------------------------
Parameters  : value         Lower 90%    Upper 90%
kT [keV]    : 130.570       (-24.6327      29.9467)
Norm        : 1.44136       (-0.0764535     0.0947145)
------------------------------------------------------------
#Fit statistic : Chi-Squared =          54.37 using 59 PHA bins.
# Reduced chi-squared =         0.9539 for     57 degrees of freedom
# Null hypothesis probability =   5.742434e-01

Energy  Fluence     90% Error
[keV]   [erg/cm2]   [erg/cm2]
15- 25  4.644e-07   3.465e-08
25- 50  8.426e-07   5.682e-08
50-150  1.565e-06   4.171e-07
15-150  2.872e-06   4.664e-07
Double BB
Spectral model: bbodyrad<1> + bbodyrad<2>
------------------------------------------------------------
Parameters  : value         Lower 90%    Upper 90%
kT1 [keV]   : 5.99657        (-0.848633      0.946023)
R1^2/D10^2  : 0.724808        (-0.303391      0.60442)
kT2 [keV]   : 23.4678        (-3.00471      4.27452)
R2^2/D10^2  : 5.67006E-03    (-0.00259588   0.00384438)
------------------------------------------------------------
#Fit statistic : Chi-Squared =          54.65 using 59 PHA bins.
# Reduced chi-squared =         0.9936 for     55 degrees of freedom
# Null hypothesis probability =   4.880688e-01

Energy  Fluence     90% Error
[keV]   [erg/cm2]   [erg/cm2]
15- 25  4.994e-07   6.353e-08
25- 50  8.099e-07   8.582e-08
50-150  1.609e-06   2.421e-07
15-150  2.918e-06   3.198e-07
Peak spectrum fit
Power-law model
Time interval is from    0.224 sec. to    1.224 sec.

Spectral model in power-law:
------------------------------------------------------------
Parameters  : value       lower 90%   higher 90%
Photon index: 1.70775     ( -0.230647   0.243477 )
Norm@50keV  : 8.14468E-03    ( -0.00124798   0.00121308 )
------------------------------------------------------------
#Fit statistic : Chi-Squared =          41.38 using 59 PHA bins.
# Reduced chi-squared =         0.7259 for     57 degrees of freedom
# Null hypothesis probability =   9.405718e-01

Photon flux (15-150 keV)    in 1 sec: 1.08465 ( -0.138571  0.138573 ) ph/cm2/s
Energy fluence (15-150 keV)             : 7.53653e-08 ( -1.19605e-08  1.22671e-08 ) ergs/cm2
Cutoff power-law model
Time interval is from    0.224 sec. to    1.224 sec.
Spectral model in the cutoff power-law:
------------------------------------------------------------
Parameters  : value       lower 90%   higher 90%
Photon index: 1.45412     ( -0.905902   0.762667 )
Epeak [keV] : 98.4606      ( -50.4201 -98.4504 )
Norm@50keV  : 1.12100E-02    ( -0.00678695   0.0229009 )
------------------------------------------------------------
#Fit statistic : Chi-Squared =          41.07 using 59 PHA bins.
# Reduced chi-squared =         0.7334 for     56 degrees of freedom
# Null hypothesis probability =   9.325756e-01

Photon flux (15-150 keV)    in 1 sec: 1.07457 ( -0.141716  0.14055 ) ph/cm2/s
Energy fluence (15-150 keV)             : 7.36565e-08 ( -1.29507e-08  1.32861e-08 ) ergs/cm2
Band function

Time interval is from    0.224 sec. to    1.224 sec.

Spectral model in the Band function:
------------------------------------------------------------
Parameters  : value       lower 90%   higher 90%
alpha       : -1.45330   ( -0.598354   0.77526 )
beta        : -10.0000    ( 10   20 )
Epeak [keV] : 98.2091      ( -50.9793 -98.2156 )
Norm@50keV   : 1.12212E-02    (     )
------------------------------------------------------------
#Fit statistic : Chi-Squared =          41.07 using 59 PHA bins.
# Reduced chi-squared =         0.7468 for     55 degrees of freedom
# Null hypothesis probability =   9.185021e-01

Photon flux (15-150 keV)    in 1 sec:  (    ) ph/cm2/s
Energy fluence (15-150 keV)             : 0 ( 0  0 ) ergs/cm2
Single BB
Spectral model blackbody:
------------------------------------------------------------
Parameters  : value    Lower 90%  Upper 90%
kT [keV]    : 12.8008  (-2.28475  2.6386)
R^2/D10^2   : 0.207448  (-0.100141   0.209946)
(R is the radius in km and D10 is the distance to the source in units of 10 kpc)
------------------------------------------------------------
#Fit statistic : Chi-Squared =          59.40 using 59 PHA bins.
# Reduced chi-squared =          1.042 for     57 degrees of freedom
# Null hypothesis probability =   3.880927e-01

Energy  Fluence     90% Error
[keV]   [erg/cm2]   [erg/cm2]
15- 25  7.210e-09   1.831e-09
25- 50  2.442e-08   5.070e-09
50-150  2.506e-08   6.915e-09
15-150  5.669e-08   1.079e-08
Thermal bremsstrahlung (OTTB)
Spectral model: thermal bremsstrahlung
------------------------------------------------------------
Parameters  : value         Lower 90%    Upper 90%
kT [keV]    : 131.730       (-56.3143      -129.614)
Norm        : 4.53337       (-0.64746     0.875458)
------------------------------------------------------------
#Fit statistic : Chi-Squared =          41.26 using 59 PHA bins.
# Reduced chi-squared =         0.7238 for     57 degrees of freedom
# Null hypothesis probability =   9.422015e-01

Energy  Fluence     90% Error
[keV]   [erg/cm2]   [erg/cm2]
15- 25  1.175e-08   4.982e-09
25- 50  2.136e-08   1.114e-08
50-150  3.984e-08   2.491e-08
15-150  7.295e-08   3.816e-08
Double BB

Spectral model: bbodyrad<1> + bbodyrad<2>
------------------------------------------------------------
Parameters  : value         Lower 90%    Upper 90%
kT1 [keV]   : 4.72264        (-1.2931      1.70375)
R1^2/D10^2  : 5.47110        (-3.86095      17.2506)
kT2 [keV]   : 20.2416        (-4.41455      7.17666)
R2^2/D10^2  : 3.36161E-02    (-0.0223317   0.0494066)
------------------------------------------------------------
#Fit statistic : Chi-Squared =          37.97 using 59 PHA bins.
# Reduced chi-squared =         0.6904 for     55 degrees of freedom
# Null hypothesis probability =   9.611870e-01

Energy  Fluence     90% Error
[keV]   [erg/cm2]   [erg/cm2]
15- 25  1.317e-08   6.696e-09
25- 50  1.922e-08   7.670e-09
50-150  4.054e-08   2.348e-08
15-150  7.294e-08   3.102e-08
Pre-slew spectrum (Pre-slew PHA with pre-slew DRM)
Power-law model

Spectral model in power-law:
------------------------------------------------------------
Parameters  : value       lower 90%   higher 90%
Photon index: 1.73016     ( -0.120275   0.122507 )
Norm@50keV  : 2.65887E-03    ( -0.000175107   0.000172912 )
------------------------------------------------------------
#Fit statistic : Chi-Squared =          61.45 using 59 PHA bins.
# Reduced chi-squared =          1.078 for     57 degrees of freedom
# Null hypothesis probability =   3.196271e-01

Photon flux (15-150 keV)    in 45.2 sec: 0.356931 ( -0.0214919  0.0215638 ) ph/cm2/s
Energy fluence (15-150 keV)             : 1.11031e-06 ( -7.65521e-08  7.7386e-08 ) ergs/cm2
Cutoff power-law model

Spectral model in the cutoff power-law:
------------------------------------------------------------
Parameters  : value       lower 90%   higher 90%
Photon index: 1.72909     ( -0.129202   0.11622 )
Epeak [keV] : 1.00000E+04      (   )
Norm@50keV  : 2.66302E-03    (     )
------------------------------------------------------------
#Fit statistic : Chi-Squared =          61.47 using 59 PHA bins.
# Reduced chi-squared =          1.098 for     56 degrees of freedom
# Null hypothesis probability =   2.865679e-01

Photon flux (15-150 keV)    in 45.2 sec: 0.357477 ( -0.022422  0.020992 ) ph/cm2/s
Energy fluence (15-150 keV)             : 1.1122e-06 ( -8.74032e-08  7.12849e-08 ) ergs/cm2
Band function
Spectral model in the Band function:
------------------------------------------------------------
Parameters  : value       lower 90%   higher 90%
alpha       : -1.41649   ( 1.41649   1.41649 )
beta        : -1.73014    ( 1.73014   0.120259 )
Epeak [keV] : 18.9935      ( -18.994 -18.994 )
Norm@50keV   : 5.98863E-03    ( -0.00333553   3.15905 )
------------------------------------------------------------
#Fit statistic : Chi-Squared =          61.45 using 59 PHA bins.
# Reduced chi-squared =          1.117 for     55 degrees of freedom
# Null hypothesis probability =   2.559997e-01

Photon flux (15-150 keV)    in 45.2 sec:  (    ) ph/cm2/s
Energy fluence (15-150 keV)             : 0 ( 0  0 ) ergs/cm2
S(25-50 keV) vs. S(50-100 keV) plot

S(25-50 keV)  = 8.24e-07
S(50-100 keV) = 9.82e-07
T90 vs. Hardness ratio plot
T90                                   = 98.6719999909401 sec.
Hardness ratio (energy fluence ratio) = 1.19175
Color vs. Color plot
Count Ratio  (25-50 keV) / (15-25 keV) = 1.09544
Count Ratio (50-100 keV) / (15-25 keV) = 0.707928
Mask shadow pattern
IMX = 1.261951849153893E-01, IMY = 1.918444380881048E-01
TIME vs. PHA plot around the trigger time

Blue+Cyan dotted lines: Time interval of the scaled map
From 0.000000 to 1.024000
TIME vs. DetID plot around the trigger time

Blue+Cyan dotted lines: Time interval of the scaled map
From 0.000000 to 1.024000
100 us light curve (15-350 keV)
Blue+Cyan dotted lines: Time interval of the scaled map
From 0.000000 to 1.024000
Spacecraft aspect plot

Bright source in the pre-burst/pre-slew/post-slew images
Pre-burst image of 15-350 keV band
Time interval of the image:
Pre-slew background subtracted image of 15-350 keV band
Time interval of the image:
-31.923410 13.276600

# RAcent  DECcent POSerr Theta    Phi  PeakCts   SNR AngSep     Name
#  [deg]    [deg]    ['] [deg]  [deg]                   [']
135.3933 -40.6660  100.0  40.4    6.6  -0.0134  -0.1    9.1	Vela X-1
170.0855 -60.6187   12.3  55.3  -27.7   0.3262   0.9    6.8	Cen X-3
136.4918  26.4980    2.3  38.9  126.8   0.9119   4.9 ------	UNKNOWN
153.3501  45.5629    2.7  51.8  154.5   1.6464   4.3 ------	UNKNOWN
175.4026  36.3811    2.3  45.2  178.4   0.6881   5.0 ------	UNKNOWN
165.3525   2.6914    2.4  11.0 -162.5   0.3209   4.8 ------	UNKNOWN
166.3866 -16.3831    0.4  12.9  -56.7   2.1258  30.2 ------	UNKNOWN
199.4416  39.6660    2.3  59.2 -164.9   2.4683   5.0 ------	UNKNOWN
194.5537 -31.7692    3.0  42.4  -68.7   1.2461   3.9 ------	UNKNOWN
204.3476   9.9488    2.4  48.3 -129.8   1.5592   4.8 ------	UNKNOWN
Post-slew image of 15-350 keV band
Time interval of the image:
53.876590 962.796800

# RAcent  DECcent POSerr Theta    Phi  PeakCts   SNR AngSep     Name
#  [deg]    [deg]    ['] [deg]  [deg]                   [']
135.4955 -40.4740    4.0  36.0   38.1   2.7283   2.9    5.1	Vela X-1
170.2732 -60.6380    1.6  44.3   -6.3   6.9769   7.0    1.5	Cen X-3
186.5337 -62.6566    5.3  48.4  -15.8   2.4287   2.2    7.6	GX 301-2
130.3103 -31.6040    2.3  36.1   54.8   5.3402   5.1 ------	UNKNOWN
167.4604 -51.3683    3.4  35.0   -4.8   2.5055   3.4 ------	UNKNOWN
182.2545  37.9626    3.4  56.4 -168.6   8.4750   3.4 ------	UNKNOWN
Plot creation:
Sat May 30 23:33:17 EDT 2015