Click here for the BAT GCN circular template
Image
Pre-slew 15.0-350.0 keV image (Event data)
#   RAcent    DECcent   POSerr    Theta     Phi              Peak Cts       SNR   Name
  172.9899   -72.6519   0.0066    31.4698  -112.2128         1.8039559     29.286 TRIG_00438675

Foreground time interval of the image:
 -0.096   8.180 (delta_t =   8.276 [sec])
Background time interval of the image:
-643.903 -554.180 (delta_t =  89.723 [sec])
-239.304  -0.096 (delta_t = 239.208 [sec])
Lightcurves
Notes:
- 1) The mask-weighted light curves are using the flight position.
- 2) Multiple plots of different time binning/intervals are shown to cover all scenarios of short/long GRBs, rate/image triggers, and real/false positives.
- 3) For all the mask-weighted lightcurves, the y-axis units are counts/sec/det where a det is 0.4 x 0.4 = 0.16 sq cm.
- 4) The verticle lines correspond to following: green dotted lines are T50 interval, black dotted lines are T90 interval, blue solid line(s) is a spacecraft slew start time, and orange solid line(s) is a spacecraft slew end time.
- 5) Time of each bin is in the middle of the bin.
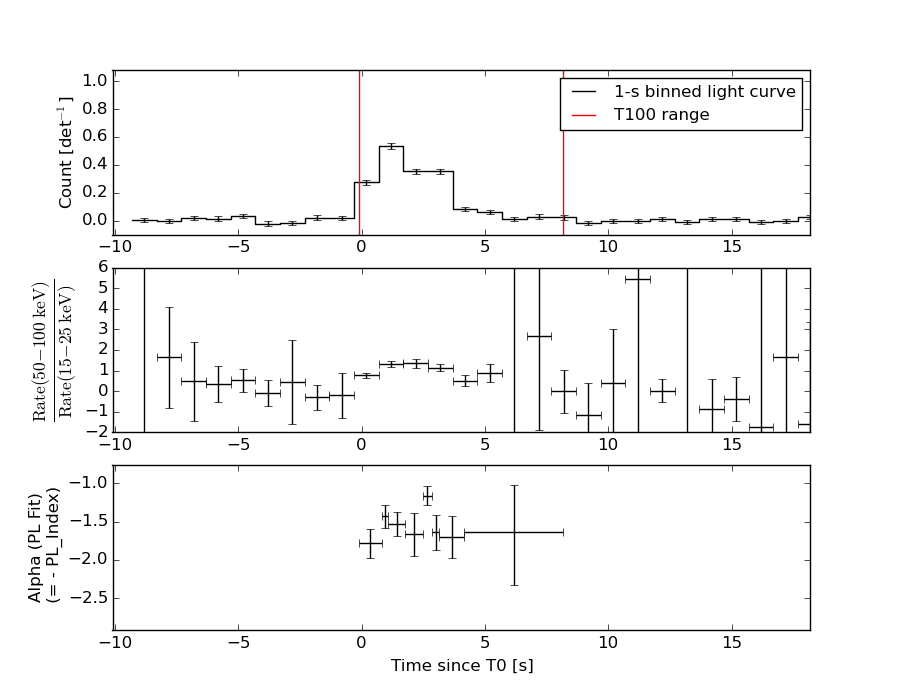
1 s binning
From T0-310 s to T0+310 s
From T100_start - 20 s to T100_end + 30 s
Full time interval
64 ms binning
Full time interval
From T100_start to T100_end

From T0-5 sec to T0+5 sec
16 ms binning
From T100_start-5 s to T100_start+5 s
Blue+Cyan dotted lines: Time interval of the scaled map
From 0.000000 to 0.256000
8 ms binning
From T100_start-3 s to T100_start+3 s

Blue+Cyan dotted lines: Time interval of the scaled map
From 0.000000 to 0.256000
2 ms binning
From T100_start-1 s to T100_start+1 s
Blue+Cyan dotted lines: Time interval of the scaled map
From 0.000000 to 0.256000
SN=5 or 10 sec. binning (whichever binning is satisfied first)
SN=5 or 10 sec. binning (T < 200 sec)

Quad-rate summed light curves (from T0-300s to T0+1000s)
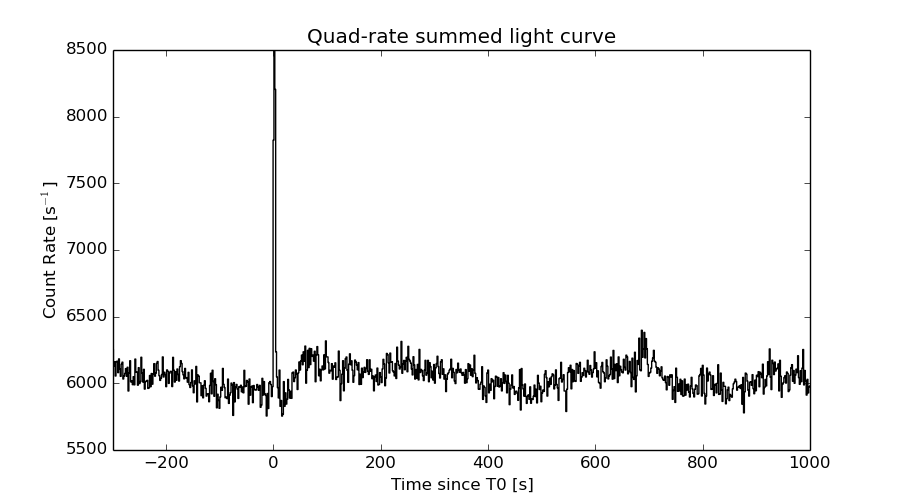
The mask-weighted light curves based on cleaned DPHs

Spectral Evolution
Spectra
Notes:
- 1) The fitting includes the systematic errors.
- 2) When the burst includes telescope slew time periods, the fitting uses an average response file made from multiple 5-s response files through out the slew time plus single time preiod for the non-slew times, and weighted by the total counts in the corresponding time period using addrmf. An average response file is needed becuase a spectral fit using the pre-slew DRM will introduce some errors in both a spectral shape and a normalization if the PHA file contains a lot of the slew/post-slew time interval.
- 3) For fits to more complicated models (e.g. a power-law over a cutoff power-law), the BAT team has decided to require a chi-square improvement of more than 6 for each extra dof.
Time averaged spectrum fit using the average DRM
Power-law model

Time interval is from   -0.096 sec. to    8.180 sec.

Spectral model in power-law:
------------------------------------------------------------
Parameters  : value       lower 90%   higher 90%
Photon index: 1.49994     ( -0.0910006   0.0915118 )
Norm@50keV  : 1.39624E-02    ( -0.000722956   0.000721074 )
------------------------------------------------------------
#Fit statistic : Chi-Squared =          39.51 using 59 PHA bins.
# Reduced chi-squared =         0.6931 for     57 degrees of freedom
# Null hypothesis probability =   9.624881e-01

Photon flux (15-150 keV)    in 8.276 sec: 1.74303 ( -0.0926083  0.092774 ) ph/cm2/s
Energy fluence (15-150 keV)             : 1.0962e-06 ( -6.15146e-08  6.17655e-08 ) ergs/cm2
Cutoff power-law model

Time interval is from   -0.096 sec. to    8.180 sec.
Spectral model in the cutoff power-law:
------------------------------------------------------------
Parameters  : value       lower 90%   higher 90%
Photon index: 1.08906     ( -0.391432   0.359775 )
Epeak [keV] : 116.988      ( -33.3735 356.582 )
Norm@50keV  : 2.19944E-02    ( -0.00706381   0.0114754 )
------------------------------------------------------------
#Fit statistic : Chi-Squared =          35.66 using 59 PHA bins.
# Reduced chi-squared =         0.6368 for     56 degrees of freedom
# Null hypothesis probability =   9.844578e-01

Photon flux (15-150 keV)    in 8.276 sec: 1.70398 ( -0.09847  0.0985 ) ph/cm2/s
Energy fluence (15-150 keV)             : 1.06865e-06 ( -6.67377e-08  6.66135e-08 ) ergs/cm2
Band function
Time interval is from   -0.096 sec. to    8.180 sec.

Spectral model in the Band function:
------------------------------------------------------------
Parameters  : value       lower 90%   higher 90%
alpha       : -1.08934   ( -0.340949   0.403443 )
beta        : -10.0000    ( 10   2.30926e-14 )
Epeak [keV] : 117.013      ( -41.5698 355.557 )
Norm@50keV   : 2.19856E-02    ( -0.00705403   0.0114959 )
------------------------------------------------------------
#Fit statistic : Chi-Squared =          35.66 using 59 PHA bins.
# Reduced chi-squared =         0.6484 for     55 degrees of freedom
# Null hypothesis probability =   9.799904e-01

Photon flux (15-150 keV)    in 8.276 sec: 1.70595 (    ) ph/cm2/s
Energy fluence (15-150 keV)             : 1.07156e-06 ( 0  0 ) ergs/cm2
Single BB
Spectral model blackbody:
------------------------------------------------------------
Parameters  : value    Lower 90%  Upper 90%
kT [keV]    : 16.2911  (-1.01879  1.09447)
R^2/D10^2   : 0.147616  (-0.0300443   0.0374522)
(R is the radius in km and D10 is the distance to the source in units of 10 kpc)
------------------------------------------------------------
#Fit statistic : Chi-Squared =         106.23 using 59 PHA bins.
# Reduced chi-squared =         1.8637 for     57 degrees of freedom
# Null hypothesis probability =   8.288312e-05

Energy  Fluence     90% Error
[keV]   [erg/cm2]   [erg/cm2]
15- 25  6.676e-08   6.592e-09
25- 50  2.853e-07   1.982e-08
50-150  5.327e-07   5.185e-08
15-150  8.847e-07   5.793e-08
Thermal bremsstrahlung (OTTB)
Spectral model: thermal bremsstrahlung
------------------------------------------------------------
Parameters  : value         Lower 90%    Upper 90%
kT [keV]    : 200.000       (      )
Norm        : 7.12442       (-0.364063     0.364067)
------------------------------------------------------------
#Fit statistic : Chi-Squared =          37.79 using 59 PHA bins.
# Reduced chi-squared =         0.6631 for     57 degrees of freedom
# Null hypothesis probability =   9.766286e-01

Energy  Fluence     90% Error
[keV]   [erg/cm2]   [erg/cm2]
15- 25  1.473e-07   7.904e-09
25- 50  2.833e-07   1.692e-08
50-150  6.214e-07   3.774e-08
15-150  1.052e-06   6.248e-08
Double BB
Spectral model: bbodyrad<1> + bbodyrad<2>
------------------------------------------------------------
Parameters  : value         Lower 90%    Upper 90%
kT1 [keV]   : 5.20097        (-0.978074      1.2181)
R1^2/D10^2  : 4.71404        (-2.63595      6.87691)
kT2 [keV]   : 21.6940        (-2.13604      2.82475)
R2^2/D10^2  : 4.76116E-02    (-0.017535   0.0257403)
------------------------------------------------------------
#Fit statistic : Chi-Squared =          31.99 using 59 PHA bins.
# Reduced chi-squared =         0.5816 for     55 degrees of freedom
# Null hypothesis probability =   9.944707e-01

Energy  Fluence     90% Error
[keV]   [erg/cm2]   [erg/cm2]
15- 25  1.453e-07   4.011e-08
25- 50  2.608e-07   3.877e-08
50-150  6.405e-07   8.272e-08
15-150  1.047e-06   1.364e-07
Peak spectrum fit
Power-law model
Time interval is from    0.732 sec. to    1.732 sec.

Spectral model in power-law:
------------------------------------------------------------
Parameters  : value       lower 90%   higher 90%
Photon index: 1.47565     ( -0.115662   0.116938 )
Norm@50keV  : 3.59546E-02    ( -0.0024732   0.00246602 )
------------------------------------------------------------
#Fit statistic : Chi-Squared =          56.37 using 59 PHA bins.
# Reduced chi-squared =         0.9889 for     57 degrees of freedom
# Null hypothesis probability =   4.987780e-01

Photon flux (15-150 keV)    in 1 sec: 4.45980 ( -0.307421  0.307748 ) ph/cm2/s
Energy fluence (15-150 keV)             : 3.42485e-07 ( -2.57865e-08  2.59142e-08 ) ergs/cm2
Cutoff power-law model
Time interval is from    0.732 sec. to    1.732 sec.
Spectral model in the cutoff power-law:
------------------------------------------------------------
Parameters  : value       lower 90%   higher 90%
Photon index: 1.10248     ( -0.483222   0.417848 )
Epeak [keV] : 126.430      ( -44.4934 -126.43 )
Norm@50keV  : 5.46663E-02    ( -0.0197908   0.0377389 )
------------------------------------------------------------
#Fit statistic : Chi-Squared =          54.26 using 59 PHA bins.
# Reduced chi-squared =         0.9690 for     56 degrees of freedom
# Null hypothesis probability =   5.408139e-01

Photon flux (15-150 keV)    in 1 sec: 4.39076 ( -0.31781  0.3178 ) ph/cm2/s
Energy fluence (15-150 keV)             : 3.35901e-07 ( -2.729e-08  2.7241e-08 ) ergs/cm2
Band function

Time interval is from    0.732 sec. to    1.732 sec.

Spectral model in the Band function:
------------------------------------------------------------
Parameters  : value       lower 90%   higher 90%
alpha       : -1.10281   ( -0.333664   0.560901 )
beta        : -10.0000    ( 10   3.55271e-15 )
Epeak [keV] : 126.475      ( -41.734 -126.475 )
Norm@50keV   : 5.46413E-02    ( -0.0197647   0.0377686 )
------------------------------------------------------------
#Fit statistic : Chi-Squared =          54.26 using 59 PHA bins.
# Reduced chi-squared =         0.9866 for     55 degrees of freedom
# Null hypothesis probability =   5.026842e-01

Photon flux (15-150 keV)    in 1 sec: 4.38057 (    ) ph/cm2/s
Energy fluence (15-150 keV)             : 3.35771e-07 ( 0  0 ) ergs/cm2
Single BB

Spectral model blackbody:
------------------------------------------------------------
Parameters  : value    Lower 90%  Upper 90%
kT [keV]    : 16.3487  (-1.37973  1.50562)
R^2/D10^2   : 0.381516  (-0.100228   0.135777)
(R is the radius in km and D10 is the distance to the source in units of 10 kpc)
------------------------------------------------------------
#Fit statistic : Chi-Squared =         102.40 using 59 PHA bins.
# Reduced chi-squared =         1.7965 for     57 degrees of freedom
# Null hypothesis probability =   2.122066e-04

Energy  Fluence     90% Error
[keV]   [erg/cm2]   [erg/cm2]
15- 25  2.098e-08   2.695e-09
25- 50  8.990e-08   8.185e-09
50-150  1.693e-07   2.235e-08
15-150  2.802e-07   2.400e-08
Thermal bremsstrahlung (OTTB)
Spectral model: thermal bremsstrahlung
------------------------------------------------------------
Parameters  : value         Lower 90%    Upper 90%
kT [keV]    : 200.000       (      )
Norm        : 18.2794       (-1.23401     1.23402)
------------------------------------------------------------
#Fit statistic : Chi-Squared =          56.18 using 59 PHA bins.
# Reduced chi-squared =         0.9857 for     57 degrees of freedom
# Null hypothesis probability =   5.057471e-01

Energy  Fluence     90% Error
[keV]   [erg/cm2]   [erg/cm2]
15- 25  4.569e-08   3.535e-09
25- 50  8.789e-08   8.450e-09
50-150  1.928e-07   5.385e-08
15-150  3.263e-07   5.685e-08
Double BB
Spectral model: bbodyrad<1> + bbodyrad<2>
------------------------------------------------------------
Parameters  : value         Lower 90%    Upper 90%
kT1 [keV]   : 5.86705        (-1.25604      1.52149)
R1^2/D10^2  : 7.78228        (-4.37764      12.4171)
kT2 [keV]   : 23.5486        (-3.17012      4.59406)
R2^2/D10^2  : 9.09318E-02    (-0.0437598   0.0646433)
------------------------------------------------------------
#Fit statistic : Chi-Squared =          51.58 using 59 PHA bins.
# Reduced chi-squared =         0.9379 for     55 degrees of freedom
# Null hypothesis probability =   6.059846e-01

Energy  Fluence     90% Error
[keV]   [erg/cm2]   [erg/cm2]
15- 25  4.347e-08   1.832e-08
25- 50  8.235e-08   1.935e-08
50-150  2.082e-07   4.080e-08
15-150  3.340e-07   6.935e-08
Pre-slew spectrum (Pre-slew PHA with pre-slew DRM)
Power-law model

Spectral model in power-law:
------------------------------------------------------------
Parameters  : value       lower 90%   higher 90%
Photon index: 1.49994     ( -0.0910006   0.0915118 )
Norm@50keV  : 1.39624E-02    ( -0.000722956   0.000721074 )
------------------------------------------------------------
#Fit statistic : Chi-Squared =          39.51 using 59 PHA bins.
# Reduced chi-squared =         0.6931 for     57 degrees of freedom
# Null hypothesis probability =   9.624881e-01

Photon flux (15-150 keV)    in 8.276 sec: 1.74303 ( -0.0926083  0.092774 ) ph/cm2/s
Energy fluence (15-150 keV)             : 1.0962e-06 ( -6.15146e-08  6.17655e-08 ) ergs/cm2
Cutoff power-law model

Spectral model in the cutoff power-law:
------------------------------------------------------------
Parameters  : value       lower 90%   higher 90%
Photon index: 1.08906     ( -0.391432   0.359775 )
Epeak [keV] : 116.988      ( -33.3735 356.582 )
Norm@50keV  : 2.19944E-02    ( -0.00706381   0.0114754 )
------------------------------------------------------------
#Fit statistic : Chi-Squared =          35.66 using 59 PHA bins.
# Reduced chi-squared =         0.6368 for     56 degrees of freedom
# Null hypothesis probability =   9.844578e-01

Photon flux (15-150 keV)    in 8.276 sec: 1.70398 ( -0.09847  0.0985 ) ph/cm2/s
Energy fluence (15-150 keV)             : 1.06865e-06 ( -6.67377e-08  6.66135e-08 ) ergs/cm2
Band function

Spectral model in the Band function:
------------------------------------------------------------
Parameters  : value       lower 90%   higher 90%
alpha       : -1.08934   ( -0.340949   0.403442 )
beta        : -10.0000    ( 10   1.77636e-15 )
Epeak [keV] : 117.013      ( -41.5698 355.557 )
Norm@50keV   : 2.19856E-02    ( -0.00705403   0.0114959 )
------------------------------------------------------------
#Fit statistic : Chi-Squared =          35.66 using 59 PHA bins.
# Reduced chi-squared =         0.6484 for     55 degrees of freedom
# Null hypothesis probability =   9.799904e-01

Photon flux (15-150 keV)    in 8.276 sec: 1.70595 (    ) ph/cm2/s
Energy fluence (15-150 keV)             : 1.07156e-06 ( 0  0 ) ergs/cm2
S(25-50 keV) vs. S(50-100 keV) plot
S(25-50 keV)  = 2.71e-07
S(50-100 keV) = 3.83e-07
T90 vs. Hardness ratio plot

T90                                   = 5.17199999094009 sec.
Hardness ratio (energy fluence ratio) = 1.41328
Color vs. Color plot
Count Ratio  (25-50 keV) / (15-25 keV) = 1.27921
Count Ratio (50-100 keV) / (15-25 keV) = 1.12208
Mask shadow pattern

IMX = -2.313940055512647E-01, IMY = 5.666523132785843E-01
TIME vs. PHA plot around the trigger time

Blue+Cyan dotted lines: Time interval of the scaled map
From 0.000000 to 0.256000
TIME vs. DetID plot around the trigger time
Blue+Cyan dotted lines: Time interval of the scaled map
From 0.000000 to 0.256000
100 us light curve (15-350 keV)
Blue+Cyan dotted lines: Time interval of the scaled map
From 0.000000 to 0.256000
Spacecraft aspect plot
Bright source in the pre-burst/pre-slew/post-slew images
Pre-burst image of 15-350 keV band
Time interval of the image:
-643.903400 -554.180200
-239.304000 -0.096000

# RAcent  DECcent POSerr Theta    Phi  PeakCts   SNR AngSep     Name
#  [deg]    [deg]    ['] [deg]  [deg]                   [']
135.5001 -40.5438    1.5  42.5 -173.1   3.0171   7.6    1.5	Vela X-1
169.9362 -60.5096    0.0  39.4 -128.4  -0.6772  -1.5   13.1	Cen X-3
186.4766 -62.7706    2.1  42.2 -116.7   4.6946   5.6    4.9	GX 301-2
 81.7996 -25.6895    2.4  40.9  113.9   4.5988   4.9 ------	UNKNOWN
334.8218 -43.0167    2.9  54.5  -15.2   3.0723   4.0 ------	UNKNOWN
Pre-slew background subtracted image of 15-350 keV band
Time interval of the image:
-0.096000 8.180000

# RAcent  DECcent POSerr Theta    Phi  PeakCts   SNR AngSep     Name
#  [deg]    [deg]    ['] [deg]  [deg]                   [']
135.4765 -40.7024    8.4  42.4 -173.0  -0.0766  -1.4    9.2	Vela X-1
169.9441 -60.5208    4.2  39.4 -128.4   0.2001   2.7   12.6	Cen X-3
186.5182 -62.9264    0.0  42.1 -116.5   0.1809   1.4   10.1	GX 301-2
172.9898 -72.6520    0.4  31.5 -112.2   1.8039  29.3 ------	UNKNOWN
Post-slew image of 15-350 keV band
Time interval of the image:
61.196610 962.757800

# RAcent  DECcent POSerr Theta    Phi  PeakCts   SNR AngSep     Name
#  [deg]    [deg]    ['] [deg]  [deg]                   [']
135.5317 -40.5410    1.2  36.8  153.2   9.8057  10.0    0.8	Vela X-1
170.3601 -60.6302   19.1  12.1 -162.5   0.3136   0.6    1.4	Cen X-3
186.6471 -62.7788    0.5  11.1 -122.2  10.6396  21.2    0.6	GX 301-2
264.7430 -44.4504 2005.8  48.6  -48.6  -0.0157  -0.0    0.0	4U 1735-44
 79.9274 -56.9142    2.7  37.7   86.6   8.0270   4.3 ------	UNKNOWN
336.6646 -52.7851    3.9  54.0   11.4   9.3022   3.0 ------	UNKNOWN
182.2933 -50.3302    2.5  22.7 -140.9   2.5356   4.6 ------	UNKNOWN
242.8604 -44.2622    3.5  42.3  -68.8   9.1513   3.3 ------	UNKNOWN
259.6709 -44.5476    4.0  47.0  -53.1   7.5360   2.9 ------	UNKNOWN
Plot creation:
Sat May 30 23:26:20 EDT 2015