Special notes of this burst
Image
Pre-slew 15.0-350.0 keV image (Event data)

#   RAcent    DECcent   POSerr    Theta     Phi              Peak Cts       SNR   Name
  241.2976    21.9061   0.0069    46.1669   -30.7733         3.2816359     27.952 TRIG_00440285

Foreground time interval of the image:
 -2.960  14.365 (delta_t =  17.325 [sec])
Background time interval of the image:
-239.536  -2.960 (delta_t = 236.576 [sec])
Lightcurves
Notes:
- 1) The mask-weighted light curves are using the flight position.
- 2) Multiple plots of different time binning/intervals are shown to cover all scenarios of short/long GRBs, rate/image triggers, and real/false positives.
- 3) For all the mask-weighted lightcurves, the y-axis units are counts/sec/det where a det is 0.4 x 0.4 = 0.16 sq cm.
- 4) The verticle lines correspond to following: green dotted lines are T50 interval, black dotted lines are T90 interval, blue solid line(s) is a spacecraft slew start time, and orange solid line(s) is a spacecraft slew end time.
- 5) Time of each bin is in the middle of the bin.
1 s binning
From T0-310 s to T0+310 s

From T100_start - 20 s to T100_end + 30 s

Full time interval

64 ms binning
Full time interval
From T100_start to T100_end

From T0-5 sec to T0+5 sec

16 ms binning
From T100_start-5 s to T100_start+5 s

Blue+Cyan dotted lines: Time interval of the scaled map
From 0.000000 to 1.024000
8 ms binning
From T100_start-3 s to T100_start+3 s

Blue+Cyan dotted lines: Time interval of the scaled map
From 0.000000 to 1.024000
2 ms binning
From T100_start-1 s to T100_start+1 s
Blue+Cyan dotted lines: Time interval of the scaled map
From 0.000000 to 1.024000
SN=5 or 10 sec. binning (whichever binning is satisfied first)

SN=5 or 10 sec. binning (T < 200 sec)

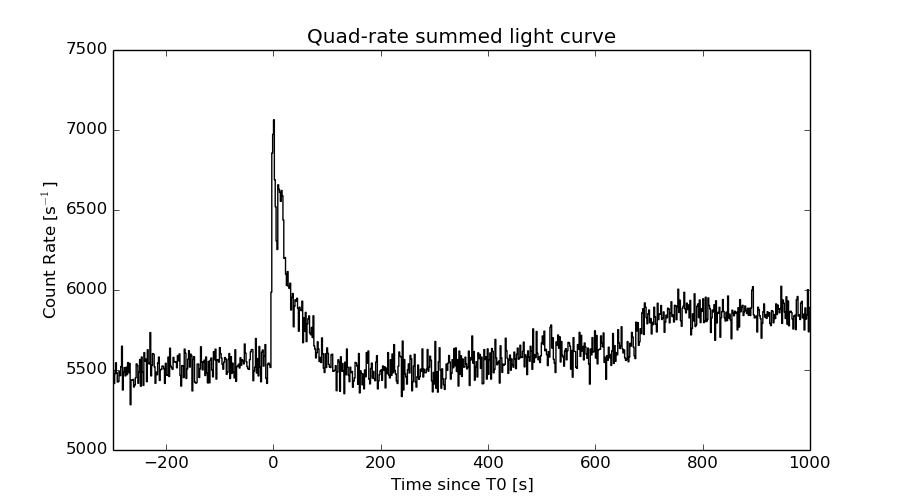
Quad-rate summed light curves (from T0-300s to T0+1000s)
Spectral Evolution

Spectra
Notes:
- 1) The fitting includes the systematic errors.
- 2) When the burst includes telescope slew time periods, the fitting uses an average response file made from multiple 5-s response files through out the slew time plus single time preiod for the non-slew times, and weighted by the total counts in the corresponding time period using addrmf. An average response file is needed becuase a spectral fit using the pre-slew DRM will introduce some errors in both a spectral shape and a normalization if the PHA file contains a lot of the slew/post-slew time interval.
- 3) For fits to more complicated models (e.g. a power-law over a cutoff power-law), the BAT team has decided to require a chi-square improvement of more than 6 for each extra dof.
Time averaged spectrum fit using the average DRM
Power-law model
Time interval is from   -2.960 sec. to  197.056 sec.

Spectral model in power-law:
------------------------------------------------------------
Parameters  : value       lower 90%   higher 90%
Photon index: 1.42561     ( -0.0861292   0.0860033 )
Norm@50keV  : 2.59488E-03    ( -0.000117211   0.000117211 )
------------------------------------------------------------
#Fit statistic : Chi-Squared =          51.13 using 59 PHA bins.
# Reduced chi-squared =         0.8970 for     57 degrees of freedom
# Null hypothesis probability =   6.939395e-01

Photon flux (15-150 keV)    in 200 sec: 0.317894 ( -0.0157079  0.0157632 ) ph/cm2/s
Energy fluence (15-150 keV)             : 4.98916e-06 ( -2.40006e-07  2.41052e-07 ) ergs/cm2
Cutoff power-law model

Time interval is from   -2.960 sec. to  197.056 sec.
Spectral model in the cutoff power-law:
------------------------------------------------------------
Parameters  : value       lower 90%   higher 90%
Photon index: 1.42701     ( -0.0924066   0.0835524 )
Epeak [keV] : 9999.36      ( -9999.36 -9999.36 )
Norm@50keV  : 2.59161E-03    ( -0.000117626   0.000490747 )
------------------------------------------------------------
#Fit statistic : Chi-Squared =          51.20 using 59 PHA bins.
# Reduced chi-squared =         0.9143 for     56 degrees of freedom
# Null hypothesis probability =   6.566751e-01

Photon flux (15-150 keV)    in 200 sec: 0.318472 ( -0.016463  0.015109 ) ph/cm2/s
Energy fluence (15-150 keV)             : 4.98638e-06 ( -2.36e-07  2.3778e-07 ) ergs/cm2
Band function

Time interval is from   -2.960 sec. to  197.056 sec.

Spectral model in the Band function:
------------------------------------------------------------
Parameters  : value       lower 90%   higher 90%
alpha       : -1.98175   ( 0.822498   1.98175 )
beta        : -1.42527    ( -0.0862805   0.0859677 )
Epeak [keV] : 9999.36      ( -9998.59 -9998.59 )
Norm@50keV   : 2.59284E-03    ( 0.822496   -0.00259491 )
------------------------------------------------------------
#Fit statistic : Chi-Squared =          51.13 using 59 PHA bins.
# Reduced chi-squared =         0.9296 for     55 degrees of freedom
# Null hypothesis probability =   6.232964e-01

Photon flux (15-150 keV)    in 200 sec:  (    ) ph/cm2/s
Energy fluence (15-150 keV)             : 0 ( 0  0 ) ergs/cm2
Single BB
Spectral model blackbody:
------------------------------------------------------------
Parameters  : value    Lower 90%  Upper 90%
kT [keV]    : 18.3844  (  )
R^2/D10^2   : 1.74697E-02  (   )
(R is the radius in km and D10 is the distance to the source in units of 10 kpc)
------------------------------------------------------------
#Fit statistic : Chi-Squared =         192.81 using 59 PHA bins.
# Reduced chi-squared =         3.3827 for     57 degrees of freedom
# Null hypothesis probability =   1.199558e-16

Energy  Fluence     90% Error
[keV]   [erg/cm2]   [erg/cm2]
15- 25  2.348e-07   2.430e-08
25- 50  1.103e-06   7.610e-08
50-150  2.720e-06   2.100e-07
15-150  4.058e-06   2.360e-07
Thermal bremsstrahlung (OTTB)
Spectral model: thermal bremsstrahlung
------------------------------------------------------------
Parameters  : value         Lower 90%    Upper 90%
kT [keV]    : 200.000       (      )
Norm        : 1.31940       (-0.0599713     0.0599581)
------------------------------------------------------------
#Fit statistic : Chi-Squared =          66.80 using 59 PHA bins.
# Reduced chi-squared =          1.172 for     57 degrees of freedom
# Null hypothesis probability =   1.757915e-01

Energy  Fluence     90% Error
[keV]   [erg/cm2]   [erg/cm2]
15- 25  6.571e-07   3.370e-08
25- 50  1.264e-06   7.140e-08
50-150  2.772e-06   1.560e-07
15-150  4.693e-06   2.560e-07
Double BB
Spectral model: bbodyrad<1> + bbodyrad<2>
------------------------------------------------------------
Parameters  : value         Lower 90%    Upper 90%
kT1 [keV]   : 6.25544        (-0.969351      1.12784)
R1^2/D10^2  : 0.501601        (-0.23161      0.485479)
kT2 [keV]   : 28.9588        (-3.45434      4.87261)
R2^2/D10^2  : 3.27502E-03    (-0.00131973   0.0017935)
------------------------------------------------------------
#Fit statistic : Chi-Squared =          53.37 using 59 PHA bins.
# Reduced chi-squared =         0.9703 for     55 degrees of freedom
# Null hypothesis probability =   5.371874e-01

Energy  Fluence     90% Error
[keV]   [erg/cm2]   [erg/cm2]
15- 25  6.403e-07   1.013e-07
25- 50  1.136e-06   1.405e-07
50-150  3.268e-06   3.600e-07
15-150  5.044e-06   5.840e-07
Peak spectrum fit
Power-law model
Time interval is from   -0.300 sec. to    0.700 sec.

Spectral model in power-law:
------------------------------------------------------------
Parameters  : value       lower 90%   higher 90%
Photon index: 1.17426     ( -0.249532   0.241877 )
Norm@50keV  : 1.93871E-02    ( -0.00298383   0.00297525 )
------------------------------------------------------------
#Fit statistic : Chi-Squared =          57.90 using 59 PHA bins.
# Reduced chi-squared =          1.016 for     57 degrees of freedom
# Null hypothesis probability =   4.418486e-01

Photon flux (15-150 keV)    in 1 sec: 2.26781 ( -0.364596  0.367303 ) ph/cm2/s
Energy fluence (15-150 keV)             : 1.98141e-07 ( -3.14515e-08  3.16121e-08 ) ergs/cm2
Cutoff power-law model

Time interval is from   -0.300 sec. to    0.700 sec.
Spectral model in the cutoff power-law:
------------------------------------------------------------
Parameters  : value       lower 90%   higher 90%
Photon index: -0.378059     ( -1.75292   1.22555 )
Epeak [keV] : 84.5723      ( -20.523 106.243 )
Norm@50keV  : 9.95294E-02    ( -0.0995323   0.500902 )
------------------------------------------------------------
#Fit statistic : Chi-Squared =          52.91 using 59 PHA bins.
# Reduced chi-squared =         0.9448 for     56 degrees of freedom
# Null hypothesis probability =   5.926838e-01

Photon flux (15-150 keV)    in 1 sec: 2.13824 ( -0.37709  0.38049 ) ph/cm2/s
Energy fluence (15-150 keV)             : 1.84382e-07 ( -3.515e-08  3.4743e-08 ) ergs/cm2
Band function
Time interval is from   -0.300 sec. to    0.700 sec.

Spectral model in the Band function:
------------------------------------------------------------
Parameters  : value       lower 90%   higher 90%
alpha       : 2.48983   ( -1.8676   -1.28096 )
beta        : -1.81137    ( 1.98073   0.718245 )
Epeak [keV] : 54.8733      ( -24.0487 68.321 )
Norm@50keV   : 1.54920    ( -1.54768   23.2724 )
------------------------------------------------------------
#Fit statistic : Chi-Squared =          51.73 using 59 PHA bins.
# Reduced chi-squared =         0.9405 for     55 degrees of freedom
# Null hypothesis probability =   6.003973e-01

Photon flux (15-150 keV)    in 1 sec:  (    ) ph/cm2/s
Energy fluence (15-150 keV)             : 0 ( 0  0 ) ergs/cm2
Single BB
Spectral model blackbody:
------------------------------------------------------------
Parameters  : value    Lower 90%  Upper 90%
kT [keV]    : 18.6496  (-2.88291  3.68642)
R^2/D10^2   : 0.139277  (-0.0639752   0.107709)
(R is the radius in km and D10 is the distance to the source in units of 10 kpc)
------------------------------------------------------------
#Fit statistic : Chi-Squared =          54.31 using 59 PHA bins.
# Reduced chi-squared =         0.9528 for     57 degrees of freedom
# Null hypothesis probability =   5.767103e-01

Energy  Fluence     90% Error
[keV]   [erg/cm2]   [erg/cm2]
15- 25  9.585e-09   2.770e-09
25- 50  4.549e-08   1.037e-08
50-150  1.158e-07   3.093e-08
15-150  1.709e-07   3.470e-08
Thermal bremsstrahlung (OTTB)
Spectral model: thermal bremsstrahlung
------------------------------------------------------------
Parameters  : value         Lower 90%    Upper 90%
kT [keV]    : 200.000       (      )
Norm        : 9.66265       (-1.50157     1.50123)
------------------------------------------------------------
#Fit statistic : Chi-Squared =          62.98 using 59 PHA bins.
# Reduced chi-squared =          1.105 for     57 degrees of freedom
# Null hypothesis probability =   2.730593e-01

Energy  Fluence     90% Error
[keV]   [erg/cm2]   [erg/cm2]
15- 25  2.408e-08   1.374e-08
25- 50  4.631e-08   2.613e-08
50-150  1.016e-07   5.750e-08
15-150  1.720e-07   9.725e-08
Double BB

Spectral model: bbodyrad<1> + bbodyrad<2>
------------------------------------------------------------
Parameters  : value         Lower 90%    Upper 90%
kT1 [keV]   : 14.7852        (-14.8311      4.93067)
R1^2/D10^2  : 0.244638        (-0.13677      -0.242271)
kT2 [keV]   : 64.9746        (-71.3943      -71.3943)
R2^2/D10^2  : 1.40938E-03    (-0.00106207   0.15857)
------------------------------------------------------------
#Fit statistic : Chi-Squared =          51.76 using 59 PHA bins.
# Reduced chi-squared =         0.9410 for     55 degrees of freedom
# Null hypothesis probability =   5.993455e-01

Energy  Fluence     90% Error
[keV]   [erg/cm2]   [erg/cm2]
15- 25  1.175e-08   7.250e-09
25- 50  4.800e-08   2.857e-08
50-150  1.261e-07   6.815e-08
15-150  1.859e-07   1.031e-07
Pre-slew spectrum (Pre-slew PHA with pre-slew DRM)
Power-law model

Spectral model in power-law:
------------------------------------------------------------
Parameters  : value       lower 90%   higher 90%
Photon index: 1.42283     ( -0.102792   0.102734 )
Norm@50keV  : 1.25922E-02    ( -0.000702411   0.000702388 )
------------------------------------------------------------
#Fit statistic : Chi-Squared =          52.98 using 59 PHA bins.
# Reduced chi-squared =         0.9296 for     57 degrees of freedom
# Null hypothesis probability =   6.264220e-01

Photon flux (15-150 keV)    in 17.32 sec: 1.54164 ( -0.0929883  0.0934416 ) ph/cm2/s
Energy fluence (15-150 keV)             : 2.09782e-06 ( -1.24889e-07  1.25317e-07 ) ergs/cm2
Cutoff power-law model

Spectral model in the cutoff power-law:
------------------------------------------------------------
Parameters  : value       lower 90%   higher 90%
Photon index: 1.42381     ( -0.186968   0.100691 )
Epeak [keV] : 9999.36      ( -9999.36 -9999.36 )
Norm@50keV  : 1.26180E-02    ( -0.000697863   0.00472615 )
------------------------------------------------------------
#Fit statistic : Chi-Squared =          53.00 using 59 PHA bins.
# Reduced chi-squared =         0.9465 for     56 degrees of freedom
# Null hypothesis probability =   5.890851e-01

Photon flux (15-150 keV)    in 17.32 sec: 1.54273 ( -0.09567  0.09161 ) ph/cm2/s
Energy fluence (15-150 keV)             : 2.09789e-06 ( -1.22435e-07  1.24306e-07 ) ergs/cm2
Band function
Spectral model in the Band function:
------------------------------------------------------------
Parameters  : value       lower 90%   higher 90%
alpha       : -1.18780   ( 1.1878   1.1878 )
beta        : -1.42283    ( -0.102737   0.102794 )
Epeak [keV] : 24.1929      ( -24.1929 -24.1929 )
Norm@50keV   : 2.52839E-02    ( -0.00971873   1.78164 )
------------------------------------------------------------
#Fit statistic : Chi-Squared =          52.98 using 59 PHA bins.
# Reduced chi-squared =         0.9634 for     55 degrees of freedom
# Null hypothesis probability =   5.519984e-01

Photon flux (15-150 keV)    in 17.32 sec:  (    ) ph/cm2/s
Energy fluence (15-150 keV)             : 0 ( 0  0 ) ergs/cm2
S(25-50 keV) vs. S(50-100 keV) plot

S(25-50 keV)  = 1.19e-06
S(50-100 keV) = 1.77e-06
T90 vs. Hardness ratio plot

T90                                   = 131.120000064373 sec.
Hardness ratio (energy fluence ratio) = 1.48739
Color vs. Color plot

Count Ratio  (25-50 keV) / (15-25 keV) = 1.23862
Count Ratio (50-100 keV) / (15-25 keV) = 1.12157
Mask shadow pattern

IMX = 8.949294185747902E-01, IMY = 5.329194475287095E-01
TIME vs. PHA plot around the trigger time

Blue+Cyan dotted lines: Time interval of the scaled map
From 0.000000 to 1.024000
TIME vs. DetID plot around the trigger time

Blue+Cyan dotted lines: Time interval of the scaled map
From 0.000000 to 1.024000
100 us light curve (15-350 keV)

Blue+Cyan dotted lines: Time interval of the scaled map
From 0.000000 to 1.024000
Spacecraft aspect plot

Bright source in the pre-burst/pre-slew/post-slew images
Pre-burst image of 15-350 keV band
Time interval of the image:
-239.536000 -2.960000

# RAcent  DECcent POSerr Theta    Phi  PeakCts   SNR AngSep     Name
#  [deg]    [deg]    ['] [deg]  [deg]                   [']
254.3175  35.2757    9.7  37.7   -7.6   0.3328   1.2    7.9	Her X-1
268.3534  -1.3978    3.0  26.2  -82.9   1.1428   3.8    3.4	SW J1753.5-0127
274.1010 -14.0536    8.2  32.3 -108.7   0.4441   1.4    5.6	GX 17+2
285.0155 -24.8920    5.6  39.6 -131.1   0.7740   2.1    2.0	HT1900.1-2455
288.8000  10.9410    1.1   3.6 -127.1   1.9509  10.2    0.3	GRS 1915+105
299.4625  35.1904    2.7  22.6   64.3   1.0996   4.3    6.3	Cyg X-1
308.1202  40.9471    3.3  31.1   70.5   1.3480   3.4    0.6	Cyg X-3
335.8272   0.7519    3.3  47.8  145.0   2.9922   3.5 ------	UNKNOWN
323.1938 -23.8253    2.5  50.5 -178.6   2.4002   4.7 ------	UNKNOWN
250.3046  39.5567    3.0  42.4   -3.6   1.1931   3.8 ------	UNKNOWN
293.1751  -9.3813    2.6  24.1 -146.4   0.9217   4.4 ------	UNKNOWN
272.3943   1.5450    3.0  21.2  -83.4   0.8925   3.8 ------	UNKNOWN
263.7553 -18.0129    3.9  41.2  -98.6   2.9455   3.0 ------	UNKNOWN
256.7516 -10.7068    3.0  41.1  -83.5   3.6090   3.8 ------	UNKNOWN
Pre-slew background subtracted image of 15-350 keV band
Time interval of the image:
-2.960000 14.364600

# RAcent  DECcent POSerr Theta    Phi  PeakCts   SNR AngSep     Name
#  [deg]    [deg]    ['] [deg]  [deg]                   [']
254.4664  35.4814   10.6  37.7   -7.2   0.0881   1.1    8.3	Her X-1
268.3410  -1.5237    7.1  26.3  -83.1   0.1206   1.6    4.6	SW J1753.5-0127
274.2194 -14.0332    0.0  32.3 -108.9  -0.1136  -1.3   12.4	GX 17+2
285.0357 -24.9176  249.7  39.6 -131.1   0.0048   0.0    0.2	HT1900.1-2455
288.6615  10.9860    4.6   3.6 -124.8  -0.1287  -2.5    8.4	GRS 1915+105
299.7873  35.2399    6.1  22.7   64.9   0.1316   1.9    9.9	Cyg X-1
308.2372  40.9000    5.6  31.1   70.7  -0.1913  -2.1    6.6	Cyg X-3
299.4663  23.2029    2.6  12.9   88.4   0.2606   4.4 ------	UNKNOWN
247.2288  24.2504    1.8  40.9  -26.9   0.5441   6.3 ------	UNKNOWN
248.4816  22.5823    2.5  39.6  -29.3   0.3844   4.6 ------	UNKNOWN
241.2976  21.9061    0.4  46.2  -30.8   3.2818  28.0 ------	UNKNOWN
Post-slew image of 15-350 keV band
Time interval of the image:
94.164600 651.964600

# RAcent  DECcent POSerr Theta    Phi  PeakCts   SNR AngSep     Name
#  [deg]    [deg]    ['] [deg]  [deg]                   [']
244.9785 -15.6371    0.6  37.7  -71.9  16.9568  18.6    0.2	Sco X-1
254.5756  35.5212    0.0  17.9  151.5  -0.6049  -1.5   12.2	Her X-1
268.3083  -1.4648    2.9  35.2 -118.0   2.8127   4.0    3.7	SW J1753.5-0127
288.7915  10.9283    1.9  46.7 -150.4   4.9617   5.9    1.1	GRS 1915+105
299.4856  35.1212    5.2  52.1  175.7   2.8807   2.2    7.0	Cyg X-1
230.8471  56.4003    3.7  35.4  104.0   2.9843   3.1 ------	UNKNOWN
304.9910  32.0950    4.0  56.9  179.0   7.9233   2.9 ------	UNKNOWN
211.1365   2.9426    3.3  34.8   -4.7   1.7520   3.4 ------	UNKNOWN
241.5542   7.7427    2.5  14.1  -67.2   1.7026   4.6 ------	UNKNOWN
210.3307 -14.7713    2.8  47.6  -23.7   3.0768   4.2 ------	UNKNOWN
258.8019 -15.1756    3.2  40.8  -92.4   6.3885   3.6 ------	UNKNOWN
Plot creation:
Sat May 30 23:24:19 EDT 2015