Special notes of this burst
Image
Pre-slew 15.0-350.0 keV image (Event data)
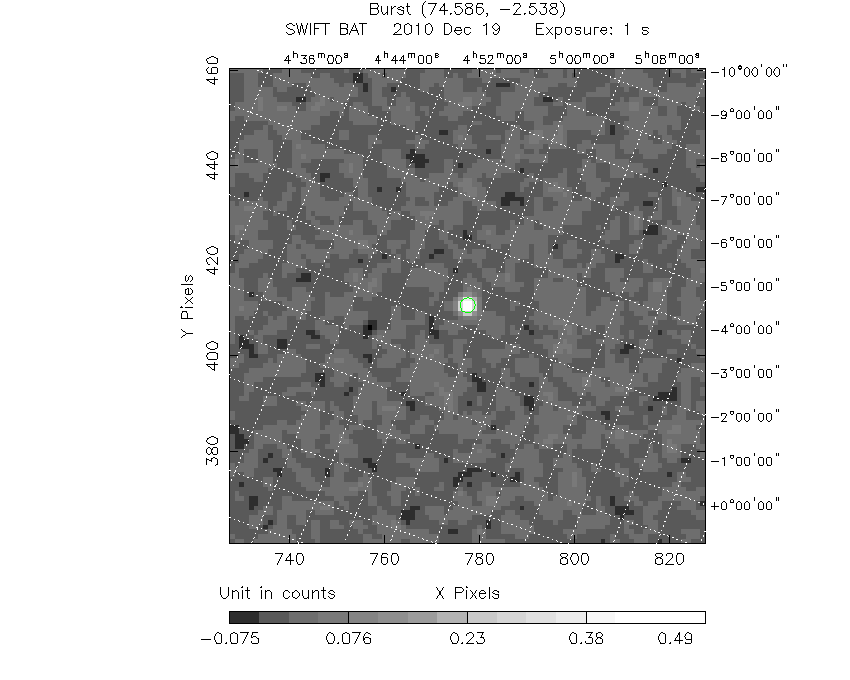
#   RAcent    DECcent   POSerr    Theta     Phi              Peak Cts       SNR   Name
   74.5870    -2.5267   0.0061    14.3278    32.8673         0.5954407     31.689 TRIG_00440606

Foreground time interval of the image:
 -0.016   1.108 (delta_t =   1.124 [sec])
Background time interval of the image:
-97.735  -0.016 (delta_t =  97.719 [sec])
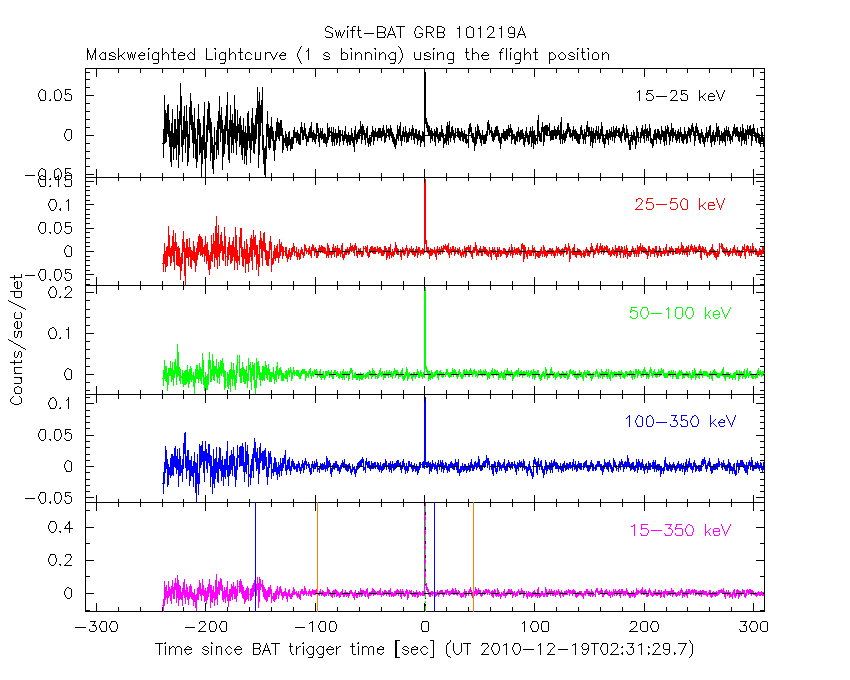
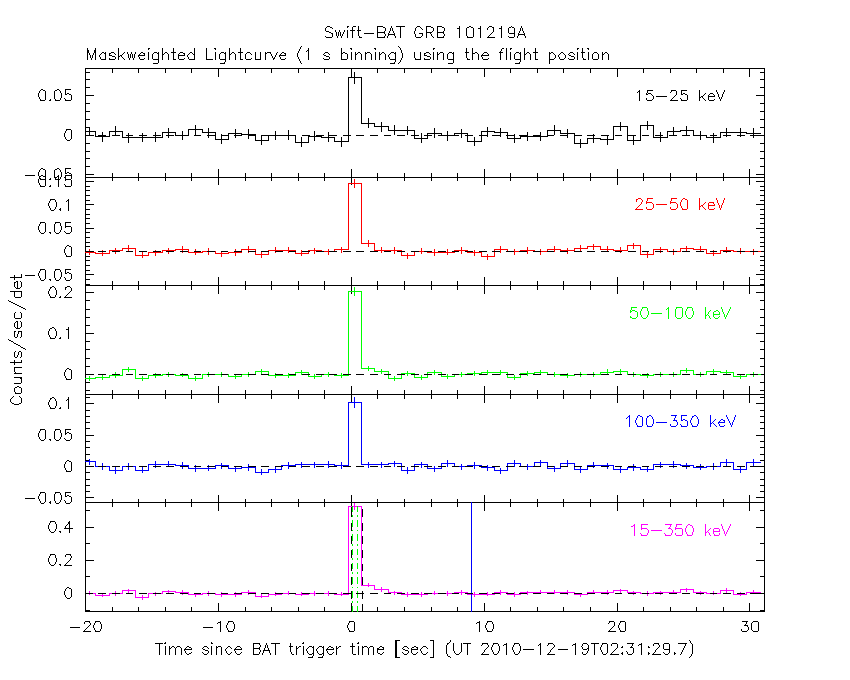
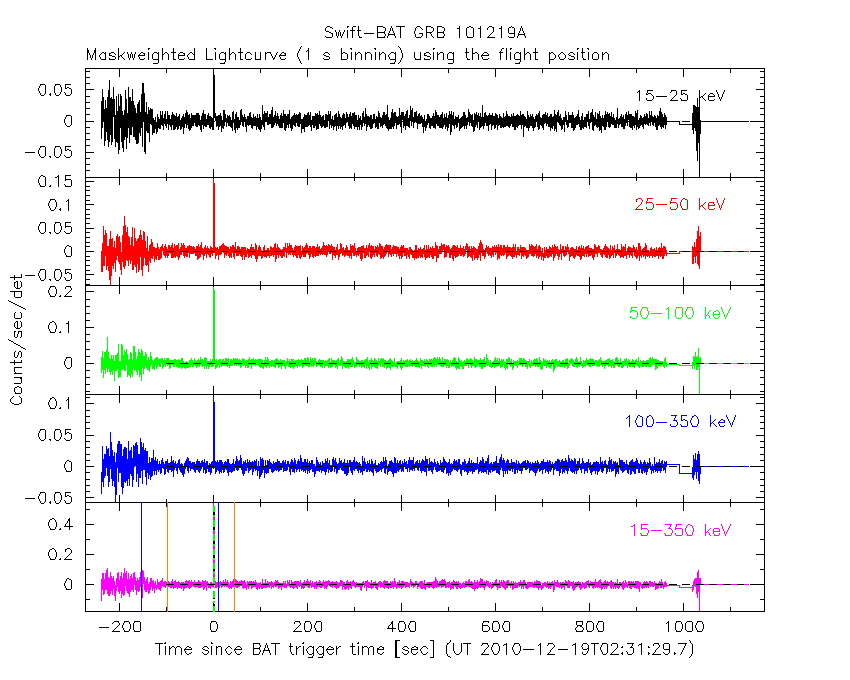
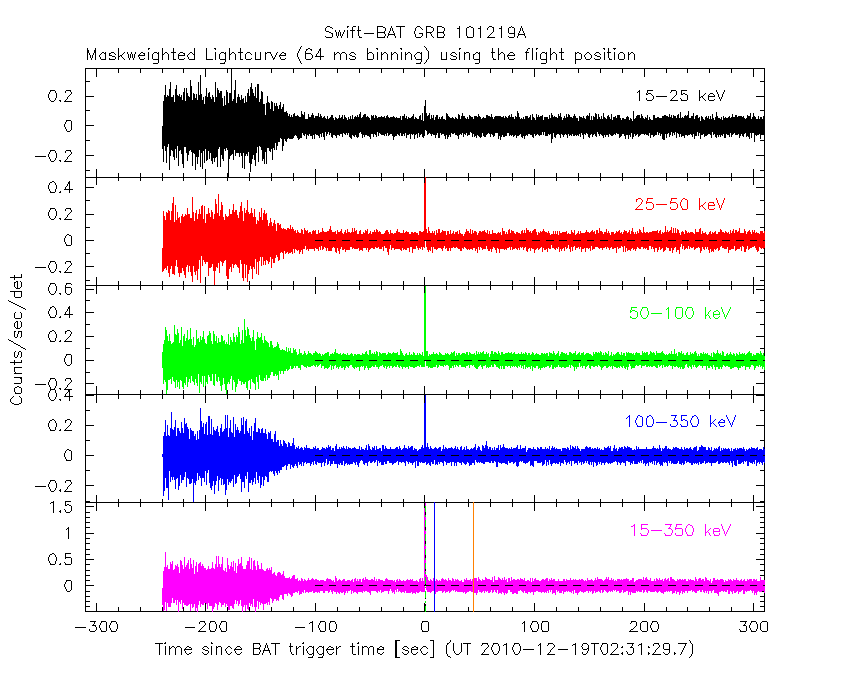
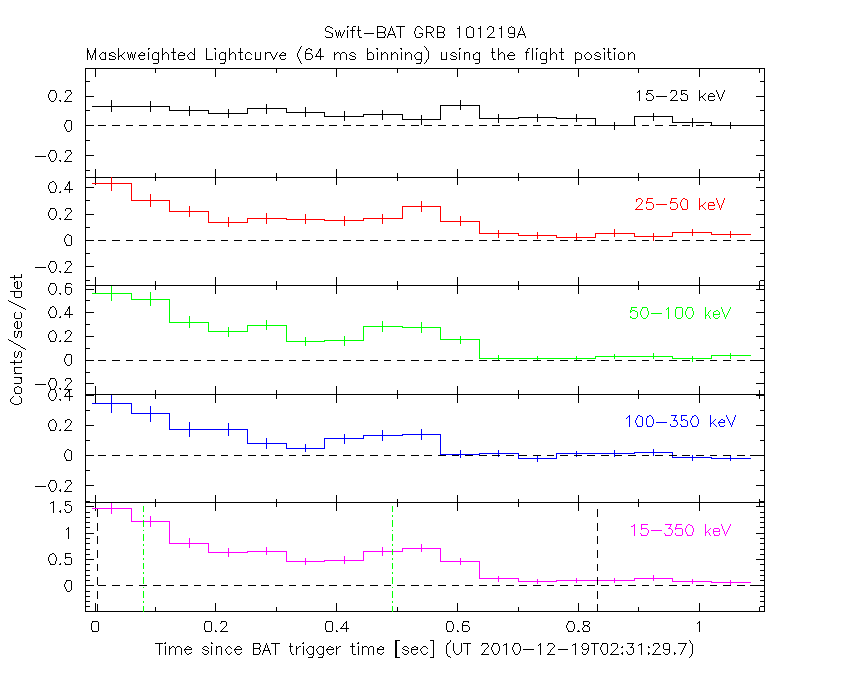
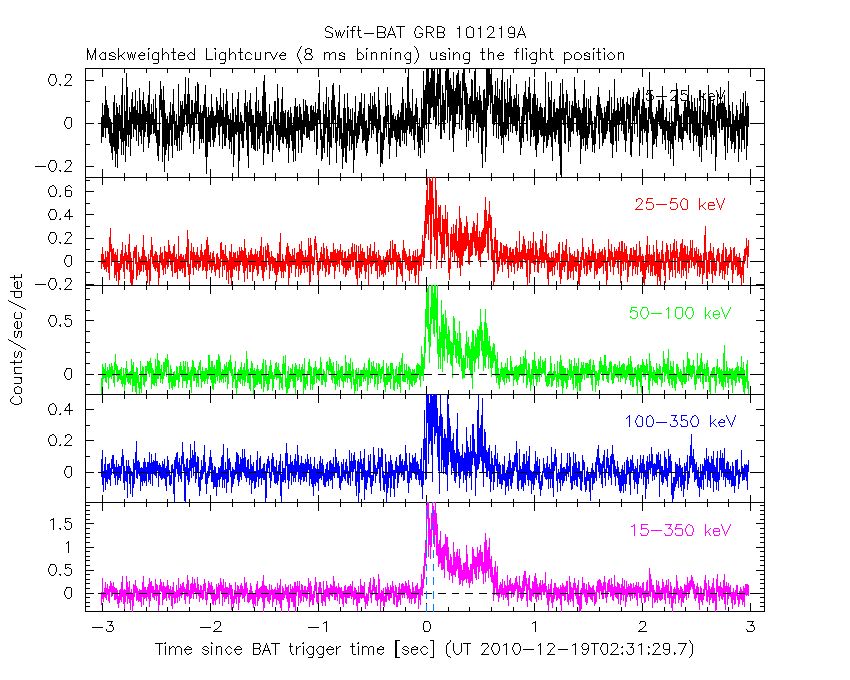
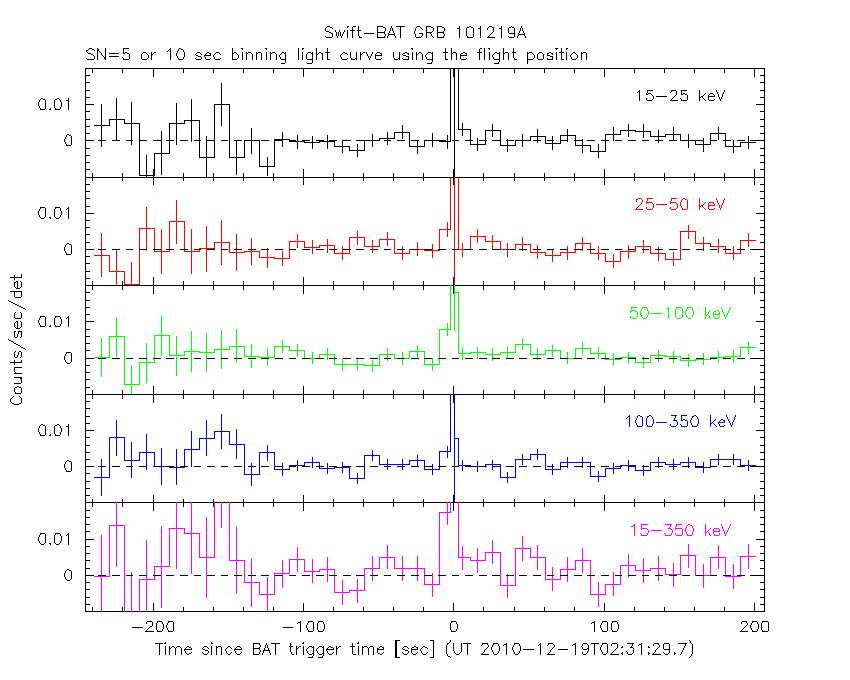
Lightcurves
Notes:
- 1) The mask-weighted light curves are using the flight position.
- 2) Multiple plots of different time binning/intervals are shown to cover all scenarios of short/long GRBs, rate/image triggers, and real/false positives.
- 3) For all the mask-weighted lightcurves, the y-axis units are counts/sec/det where a det is 0.4 x 0.4 = 0.16 sq cm.
- 4) The verticle lines correspond to following: green dotted lines are T50 interval, black dotted lines are T90 interval, blue solid line(s) is a spacecraft slew start time, and orange solid line(s) is a spacecraft slew end time.
- 5) Time of each bin is in the middle of the bin.
1 s binning
From T0-310 s to T0+310 s
From T100_start - 20 s to T100_end + 30 s
Full time interval
64 ms binning
Full time interval
From T100_start to T100_end
From T0-5 sec to T0+5 sec

16 ms binning
From T100_start-5 s to T100_start+5 s

Blue+Cyan dotted lines: Time interval of the scaled map
From 0.000000 to 0.064000
8 ms binning
From T100_start-3 s to T100_start+3 s
Blue+Cyan dotted lines: Time interval of the scaled map
From 0.000000 to 0.064000
2 ms binning
From T100_start-1 s to T100_start+1 s

Blue+Cyan dotted lines: Time interval of the scaled map
From 0.000000 to 0.064000
SN=5 or 10 sec. binning (whichever binning is satisfied first)
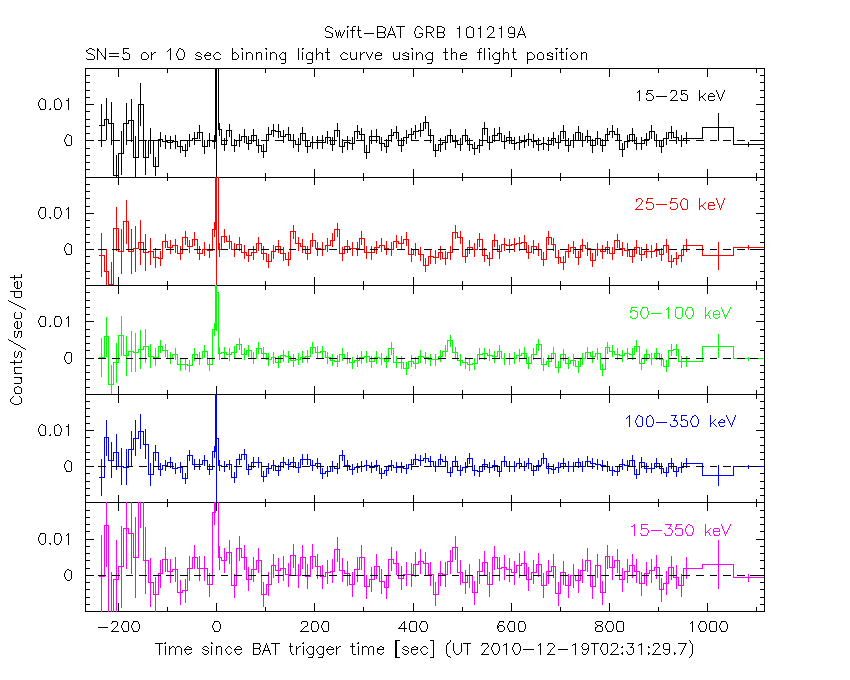
SN=5 or 10 sec. binning (T < 200 sec)
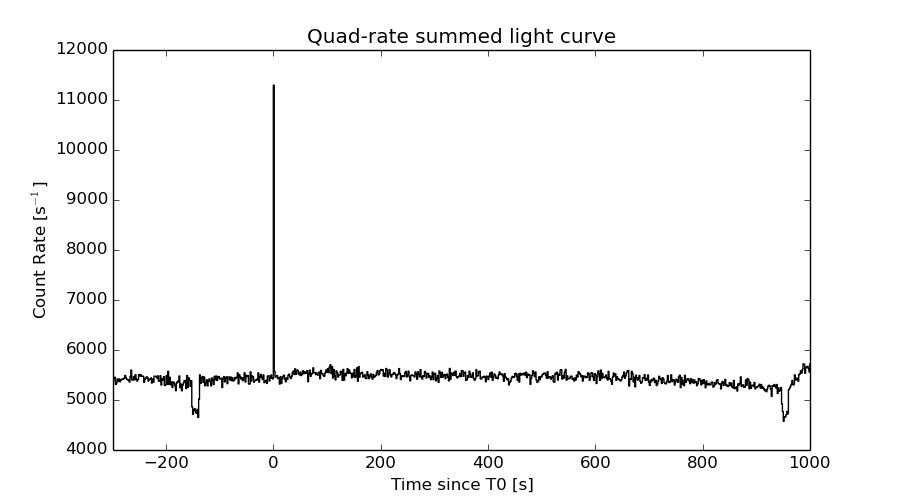
Quad-rate summed light curves (from T0-300s to T0+1000s)
The mask-weighted light curves based on cleaned DPHs

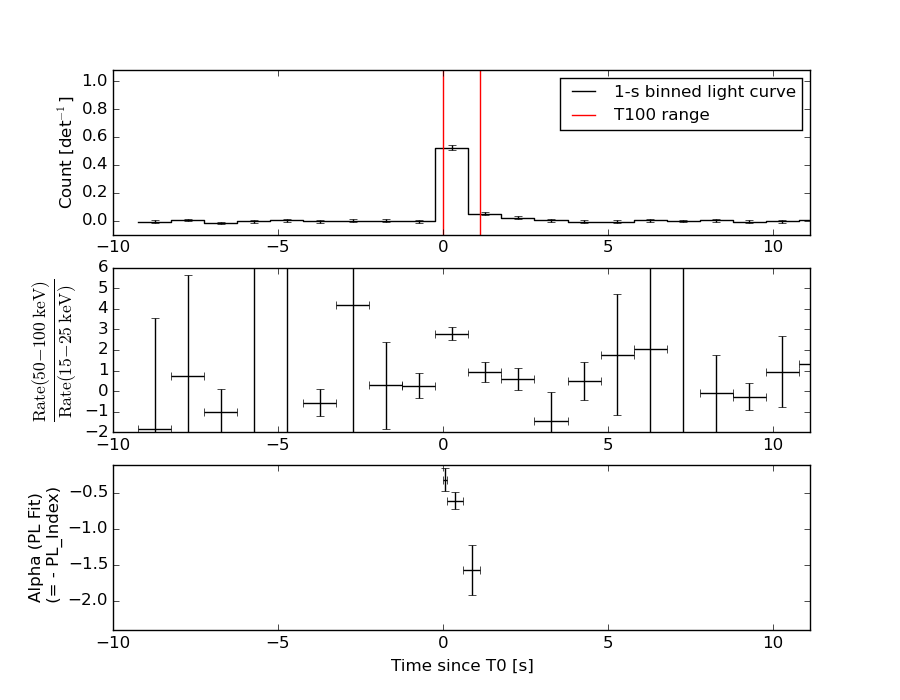
Spectral Evolution
Spectra
Notes:
- 1) The fitting includes the systematic errors.
- 2) When the burst includes telescope slew time periods, the fitting uses an average response file made from multiple 5-s response files through out the slew time plus single time preiod for the non-slew times, and weighted by the total counts in the corresponding time period using addrmf. An average response file is needed becuase a spectral fit using the pre-slew DRM will introduce some errors in both a spectral shape and a normalization if the PHA file contains a lot of the slew/post-slew time interval.
- 3) For fits to more complicated models (e.g. a power-law over a cutoff power-law), the BAT team has decided to require a chi-square improvement of more than 6 for each extra dof.
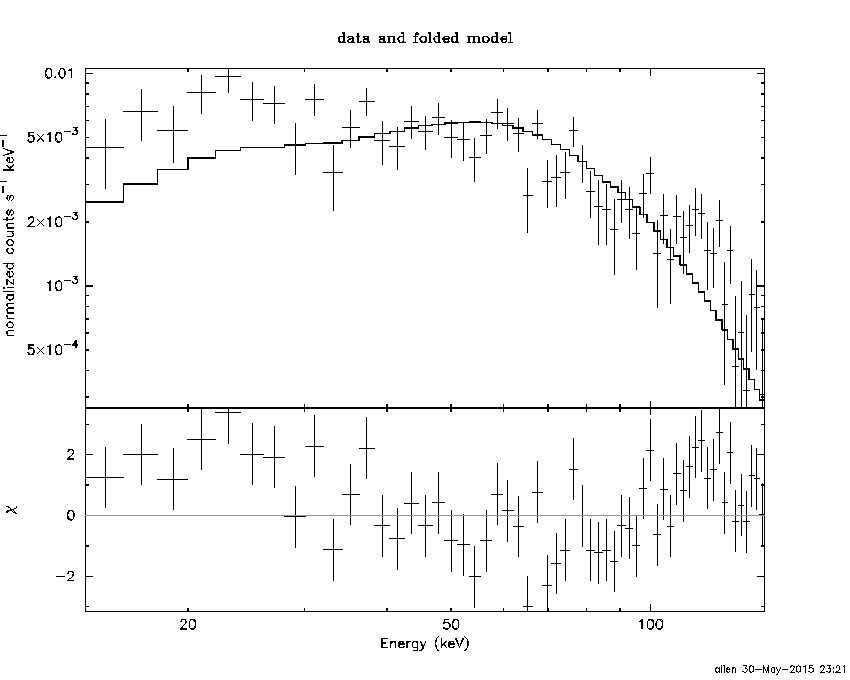
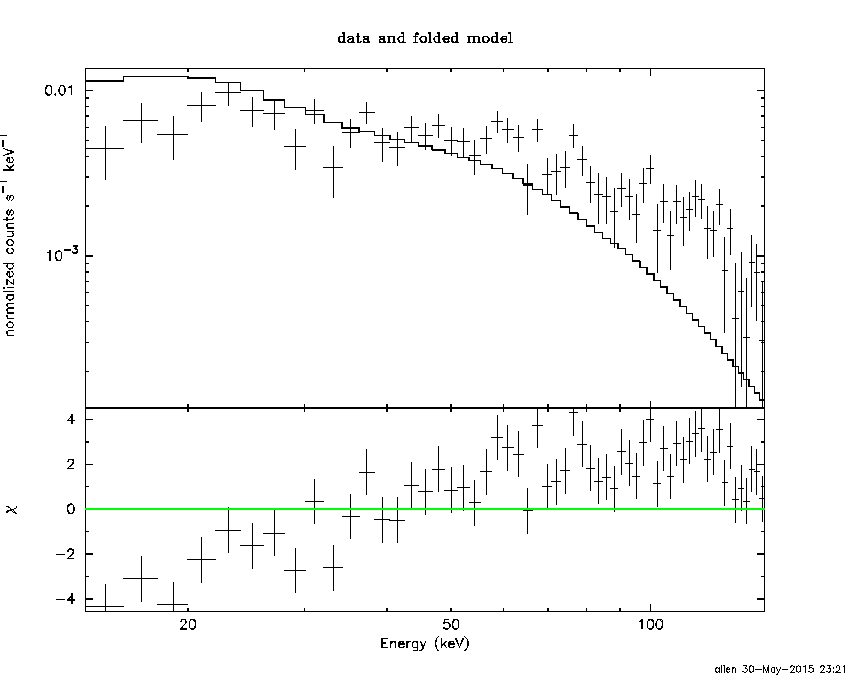
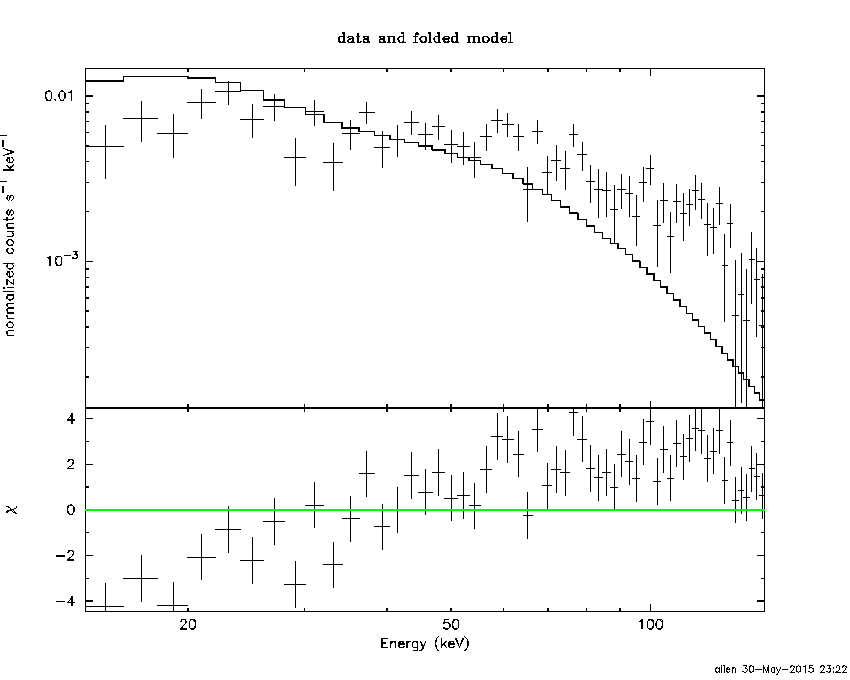
Time averaged spectrum fit using the average DRM
Power-law model

Time interval is from   -0.016 sec. to    1.108 sec.

Spectral model in power-law:
------------------------------------------------------------
Parameters  : value       lower 90%   higher 90%
Photon index: 0.625101     ( -0.100831   0.0982707 )
Norm@50keV  : 3.05638E-02    ( -0.00170826   0.00169297 )
------------------------------------------------------------
#Fit statistic : Chi-Squared =          65.44 using 59 PHA bins.
# Reduced chi-squared =          1.148 for     57 degrees of freedom
# Null hypothesis probability =   2.070765e-01

Photon flux (15-150 keV)    in 1.124 sec: 3.55809 ( -0.186181  0.186405 ) ph/cm2/s
Energy fluence (15-150 keV)             : 4.34094e-07 ( -2.47942e-08  2.49464e-08 ) ergs/cm2
Cutoff power-law model

Time interval is from   -0.016 sec. to    1.108 sec.
Spectral model in the cutoff power-law:
------------------------------------------------------------
Parameters  : value       lower 90%   higher 90%
Photon index: 0.620663     ( -0.105935   0.0958313 )
Epeak [keV] : 9999.36      ( -9999.36 -9999.36 )
Norm@50keV  : 3.08096E-02    ( -0.00162168   0.00728118 )
------------------------------------------------------------
#Fit statistic : Chi-Squared =          65.51 using 59 PHA bins.
# Reduced chi-squared =          1.170 for     56 degrees of freedom
# Null hypothesis probability =   1.801357e-01

Photon flux (15-150 keV)    in 1.124 sec: 3.55857 ( -0.18771  0.18501 ) ph/cm2/s
Energy fluence (15-150 keV)             : 4.34071e-07 ( -2.46999e-08  2.47494e-08 ) ergs/cm2
Band function

Time interval is from   -0.016 sec. to    1.108 sec.

Spectral model in the Band function:
------------------------------------------------------------
Parameters  : value       lower 90%   higher 90%
alpha       : 5.00000   ( -5   -5 )
beta        : -0.625380    ( -0.0982556   0.101062 )
Epeak [keV] : 17.4241      ( -17.4241 666.723 )
Norm@50keV   : 1.09107E+04    ( -559.794   2.32264e+06 )
------------------------------------------------------------
#Fit statistic : Chi-Squared =          65.43 using 59 PHA bins.
# Reduced chi-squared =          1.190 for     55 degrees of freedom
# Null hypothesis probability =   1.585037e-01

Photon flux (15-150 keV)    in 1.124 sec:  (    ) ph/cm2/s
Energy fluence (15-150 keV)             : 0 ( 0  0 ) ergs/cm2
Single BB
Spectral model blackbody:
------------------------------------------------------------
Parameters  : value    Lower 90%  Upper 90%
kT [keV]    : 29.5548  (  )
R^2/D10^2   : 5.71798E-02  (   )
(R is the radius in km and D10 is the distance to the source in units of 10 kpc)
------------------------------------------------------------
#Fit statistic : Chi-Squared =         123.00 using 59 PHA bins.
# Reduced chi-squared =         2.1579 for     57 degrees of freedom
# Null hypothesis probability =   9.432422e-07

Energy  Fluence     90% Error
[keV]   [erg/cm2]   [erg/cm2]
15- 25  8.864e-09   9.869e-10
25- 50  5.434e-08   4.423e-09
50-150  3.372e-07   2.788e-08
15-150  4.004e-07   2.900e-08
Thermal bremsstrahlung (OTTB)
Spectral model: thermal bremsstrahlung
------------------------------------------------------------
Parameters  : value         Lower 90%    Upper 90%
kT [keV]    : 199.363       (      )
Norm        : 12.9085       (     )
------------------------------------------------------------
#Fit statistic : Chi-Squared =         296.73 using 59 PHA bins.
# Reduced chi-squared =         5.2058 for     57 degrees of freedom
# Null hypothesis probability =   4.049208e-34

Energy  Fluence     90% Error
[keV]   [erg/cm2]   [erg/cm2]
15- 25  3.613e-08   2.450e-09
25- 50  6.950e-08   6.508e-09
50-150  1.524e-07   3.815e-08
15-150  2.580e-07   4.305e-08
Double BB
Spectral model: bbodyrad<1> + bbodyrad<2>
------------------------------------------------------------
Parameters  : value         Lower 90%    Upper 90%
kT1 [keV]   : 10.8933        (-2.55449      3.03038)
R1^2/D10^2  : 0.558905        (-0.25933      0.603576)
kT2 [keV]   : 63.6982        (-18.8653      83.4345)
R2^2/D10^2  : 7.06898E-03    (-0.00417976   0.00967732)
------------------------------------------------------------
#Fit statistic : Chi-Squared =          63.69 using 59 PHA bins.
# Reduced chi-squared =          1.158 for     55 degrees of freedom
# Null hypothesis probability =   1.973773e-01

Energy  Fluence     90% Error
[keV]   [erg/cm2]   [erg/cm2]
15- 25  1.844e-08   4.416e-09
25- 50  6.538e-08   1.581e-08
50-150  3.594e-07   1.560e-07
15-150  4.432e-07   1.727e-07
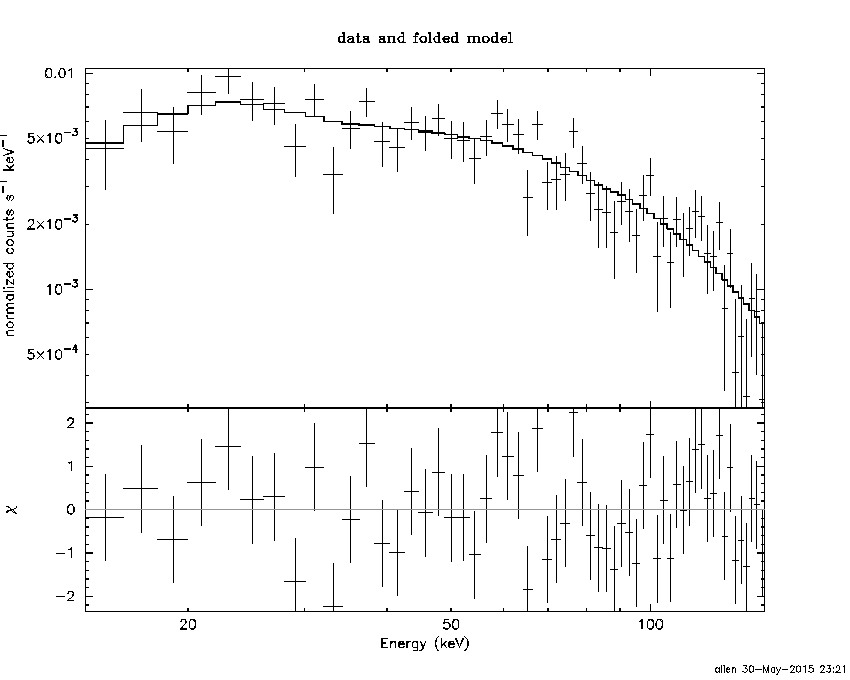
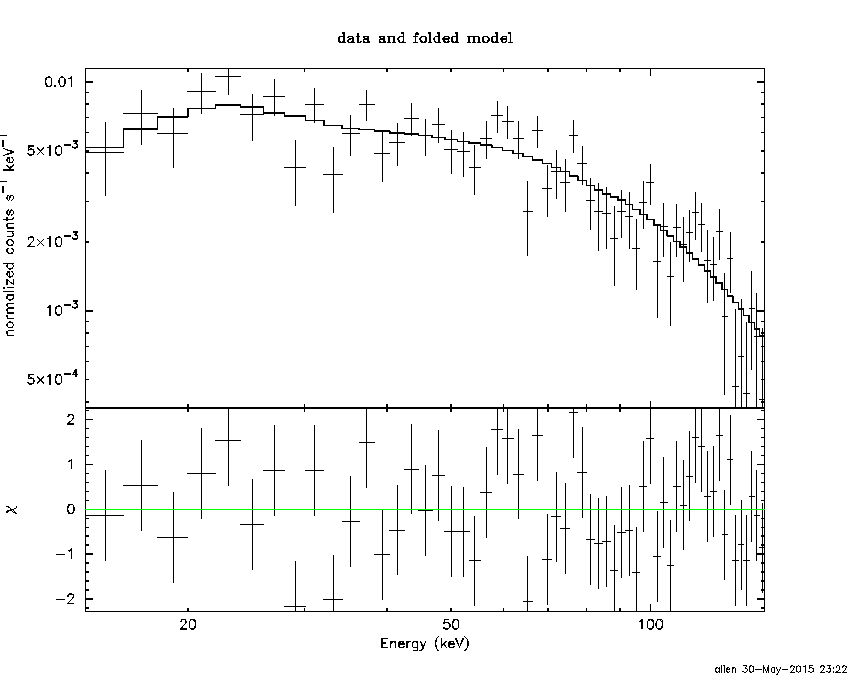
Peak spectrum fit
Power-law model

Time interval is from   -0.016 sec. to    0.984 sec.

Spectral model in power-law:
------------------------------------------------------------
Parameters  : value       lower 90%   higher 90%
Photon index: 0.603045     ( -0.102267   0.0995965 )
Norm@50keV  : 3.31863E-02    ( -0.00187942   0.00186145 )
------------------------------------------------------------
#Fit statistic : Chi-Squared =          67.64 using 59 PHA bins.
# Reduced chi-squared =          1.187 for     57 degrees of freedom
# Null hypothesis probability =   1.581903e-01

Photon flux (15-150 keV)    in 1 sec: 3.87326 ( -0.204071  0.204297 ) ph/cm2/s
Energy fluence (15-150 keV)             : 4.23768e-07 ( -2.44395e-08  2.45888e-08 ) ergs/cm2
Cutoff power-law model

Time interval is from   -0.016 sec. to    0.984 sec.
Spectral model in the cutoff power-law:
------------------------------------------------------------
Parameters  : value       lower 90%   higher 90%
Photon index: 0.599544     ( -0.107598   0.0963193 )
Epeak [keV] : 9999.36      ( -9999.36 -9999.36 )
Norm@50keV  : 3.34587E-02    ( -0.00178391   0.00717078 )
------------------------------------------------------------
#Fit statistic : Chi-Squared =          67.73 using 59 PHA bins.
# Reduced chi-squared =          1.209 for     56 degrees of freedom
# Null hypothesis probability =   1.354385e-01

Photon flux (15-150 keV)    in 1 sec: 3.87477 ( -0.20565  0.20203 ) ph/cm2/s
Energy fluence (15-150 keV)             : 4.24078e-07 ( -2.4638e-08  2.3892e-08 ) ergs/cm2
Band function
Time interval is from   -0.016 sec. to    0.984 sec.

Spectral model in the Band function:
------------------------------------------------------------
Parameters  : value       lower 90%   higher 90%
alpha       : -0.894806   ( 0.894806   0.894806 )
beta        : -0.603050    ( -0.0995012   0.102447 )
Epeak [keV] : 16.0922      ( -16.0922 -16.0922 )
Norm@50keV   : 4.65017E-02    ( -0.0151641   505153 )
------------------------------------------------------------
#Fit statistic : Chi-Squared =          67.64 using 59 PHA bins.
# Reduced chi-squared =          1.230 for     55 degrees of freedom
# Null hypothesis probability =   1.178362e-01

Photon flux (15-150 keV)    in 1 sec:  (    ) ph/cm2/s
Energy fluence (15-150 keV)             : 0 ( 0  0 ) ergs/cm2
Single BB
Spectral model blackbody:
------------------------------------------------------------
Parameters  : value    Lower 90%  Upper 90%
kT [keV]    : 30.2137  (  )
R^2/D10^2   : 5.88726E-02  (   )
(R is the radius in km and D10 is the distance to the source in units of 10 kpc)
------------------------------------------------------------
#Fit statistic : Chi-Squared =         124.61 using 59 PHA bins.
# Reduced chi-squared =         2.1862 for     57 degrees of freedom
# Null hypothesis probability =   5.967211e-07

Energy  Fluence     90% Error
[keV]   [erg/cm2]   [erg/cm2]
15- 25  8.371e-09   8.860e-10
25- 50  5.179e-08   4.600e-09
50-150  3.330e-07   2.810e-08
15-150  3.932e-07   2.870e-08
Thermal bremsstrahlung (OTTB)
Spectral model: thermal bremsstrahlung
------------------------------------------------------------
Parameters  : value         Lower 90%    Upper 90%
kT [keV]    : 199.363       (      )
Norm        : 13.9120       (     )
------------------------------------------------------------
#Fit statistic : Chi-Squared =         302.89 using 59 PHA bins.
# Reduced chi-squared =         5.3138 for     57 degrees of freedom
# Null hypothesis probability =   3.260961e-35

Energy  Fluence     90% Error
[keV]   [erg/cm2]   [erg/cm2]
15- 25  3.464e-08   2.060e-09
25- 50  6.664e-08   6.675e-09
50-150  1.461e-07   3.913e-08
15-150  2.474e-07   4.185e-08
Double BB
Spectral model: bbodyrad<1> + bbodyrad<2>
------------------------------------------------------------
Parameters  : value         Lower 90%    Upper 90%
kT1 [keV]   : 10.4755        (-2.62454      3.21481)
R1^2/D10^2  : 0.654480        (-0.301503      0.731521)
kT2 [keV]   : 61.1030        (-18.4673      78.8155)
R2^2/D10^2  : 8.55688E-03    (-0.0047079   0.0104553)
------------------------------------------------------------
#Fit statistic : Chi-Squared =          66.30 using 59 PHA bins.
# Reduced chi-squared =          1.205 for     55 degrees of freedom
# Null hypothesis probability =   1.413767e-01

Energy  Fluence     90% Error
[keV]   [erg/cm2]   [erg/cm2]
15- 25  1.781e-08   6.039e-09
25- 50  6.170e-08   1.753e-08
50-150  3.494e-07   1.605e-07
15-150  4.289e-07   1.680e-07
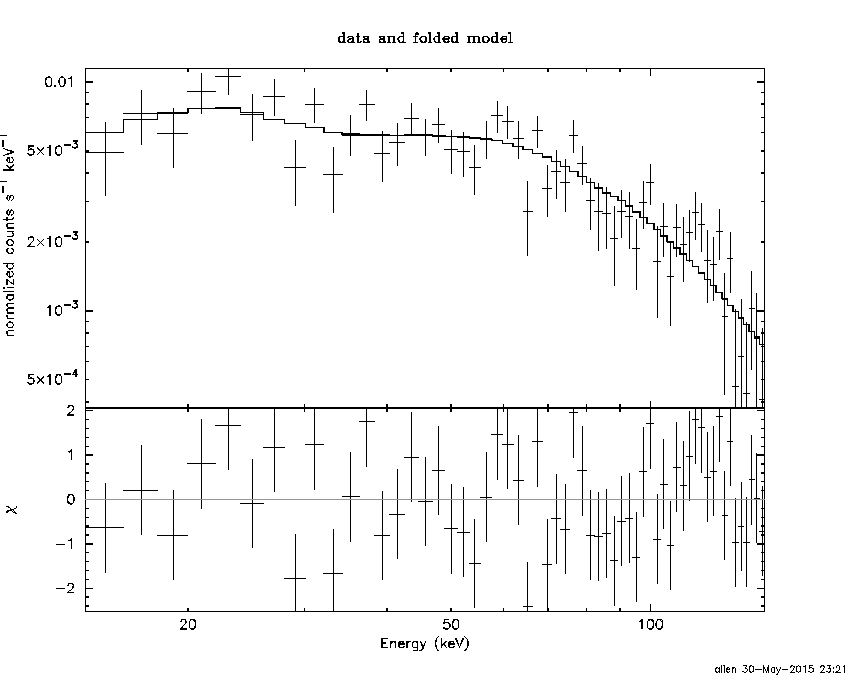
Pre-slew spectrum (Pre-slew PHA with pre-slew DRM)
Power-law model
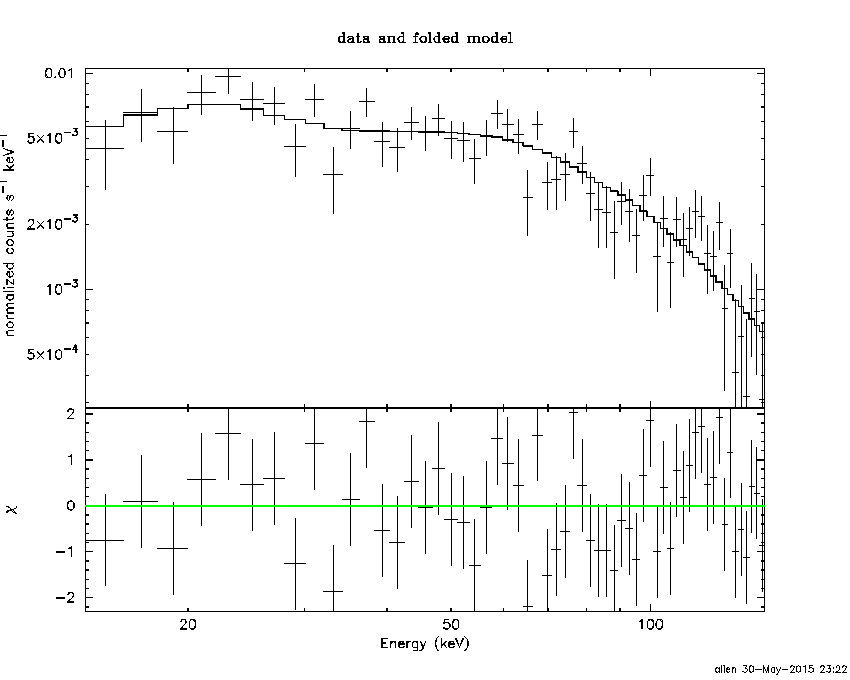
Spectral model in power-law:
------------------------------------------------------------
Parameters  : value       lower 90%   higher 90%
Photon index: 0.625101     ( -0.100831   0.0982707 )
Norm@50keV  : 3.05638E-02    ( -0.00170826   0.00169297 )
------------------------------------------------------------
#Fit statistic : Chi-Squared =          65.44 using 59 PHA bins.
# Reduced chi-squared =          1.148 for     57 degrees of freedom
# Null hypothesis probability =   2.070765e-01

Photon flux (15-150 keV)    in 1.124 sec: 3.55809 ( -0.186181  0.186405 ) ph/cm2/s
Energy fluence (15-150 keV)             : 4.34094e-07 ( -2.47942e-08  2.49464e-08 ) ergs/cm2
Cutoff power-law model

Spectral model in the cutoff power-law:
------------------------------------------------------------
Parameters  : value       lower 90%   higher 90%
Photon index: 0.620663     ( -0.105935   0.0958313 )
Epeak [keV] : 9999.36      ( -9999.36 -9999.36 )
Norm@50keV  : 3.08096E-02    ( -0.00162168   0.00728118 )
------------------------------------------------------------
#Fit statistic : Chi-Squared =          65.51 using 59 PHA bins.
# Reduced chi-squared =          1.170 for     56 degrees of freedom
# Null hypothesis probability =   1.801357e-01

Photon flux (15-150 keV)    in 1.124 sec: 3.55857 ( -0.18771  0.18501 ) ph/cm2/s
Energy fluence (15-150 keV)             : 4.34071e-07 ( -2.46999e-08  2.47494e-08 ) ergs/cm2
Band function

Spectral model in the Band function:
------------------------------------------------------------
Parameters  : value       lower 90%   higher 90%
alpha       : 5.00000   ( -5   -5 )
beta        : -0.625380    ( -0.0982556   0.101062 )
Epeak [keV] : 17.4241      ( -17.4241 666.723 )
Norm@50keV   : 1.09107E+04    ( -559.794   2.32264e+06 )
------------------------------------------------------------
#Fit statistic : Chi-Squared =          65.43 using 59 PHA bins.
# Reduced chi-squared =          1.190 for     55 degrees of freedom
# Null hypothesis probability =   1.585037e-01

Photon flux (15-150 keV)    in 1.124 sec:  (    ) ph/cm2/s
Energy fluence (15-150 keV)             : 0 ( 0  0 ) ergs/cm2
S(25-50 keV) vs. S(50-100 keV) plot
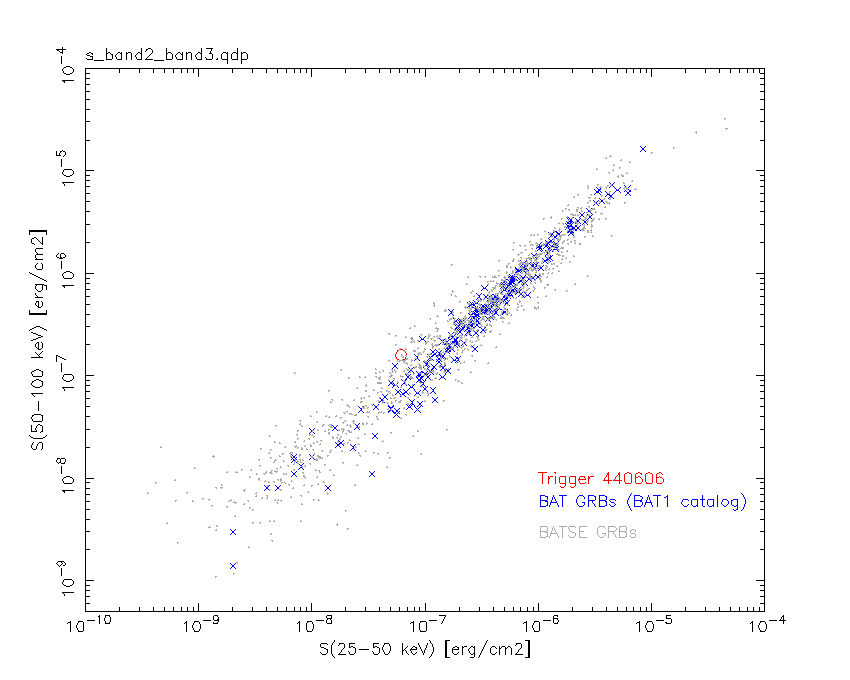
S(25-50 keV)  = 6.15e-08
S(50-100 keV) = 1.59e-07
T90 vs. Hardness ratio plot
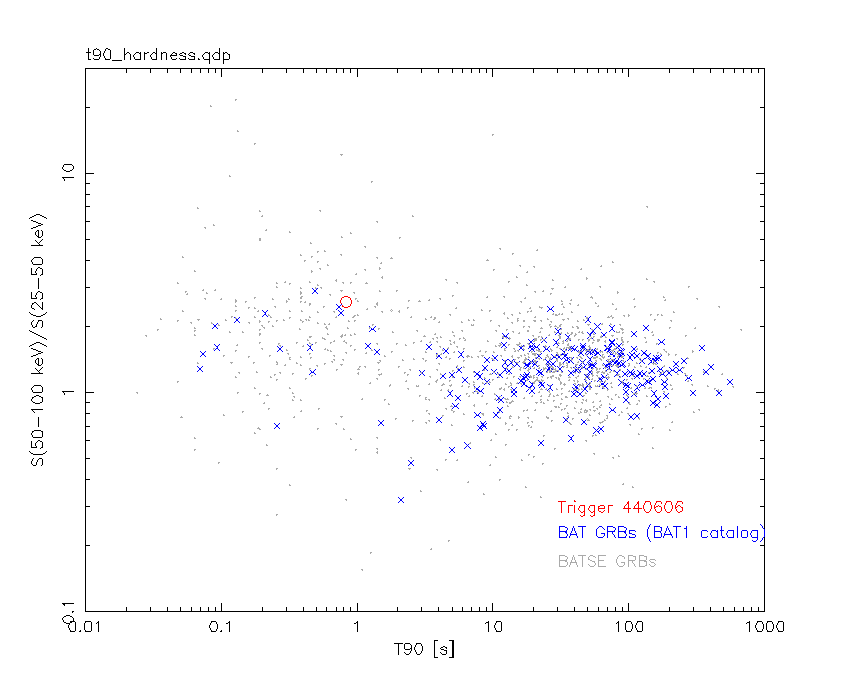
T90                                   = 0.827999949455261 sec.
Hardness ratio (energy fluence ratio) = 2.58537
Color vs. Color plot
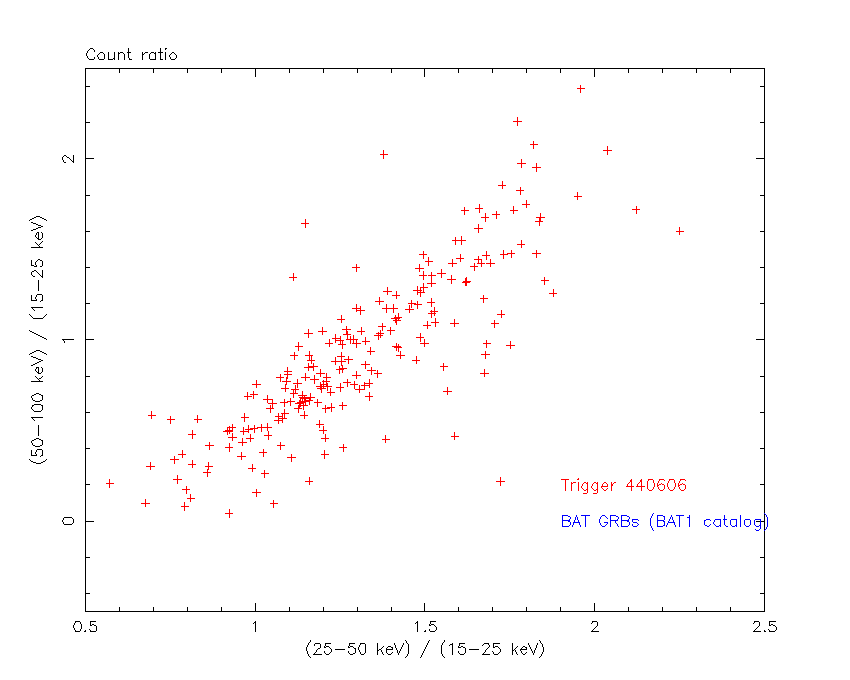
Count Ratio  (25-50 keV) / (15-25 keV) = 2.01643
Count Ratio (50-100 keV) / (15-25 keV) = 2.58869
Mask shadow pattern
IMX = 2.145298307916920E-01, IMY = -1.386118796284431E-01
TIME vs. PHA plot around the trigger time
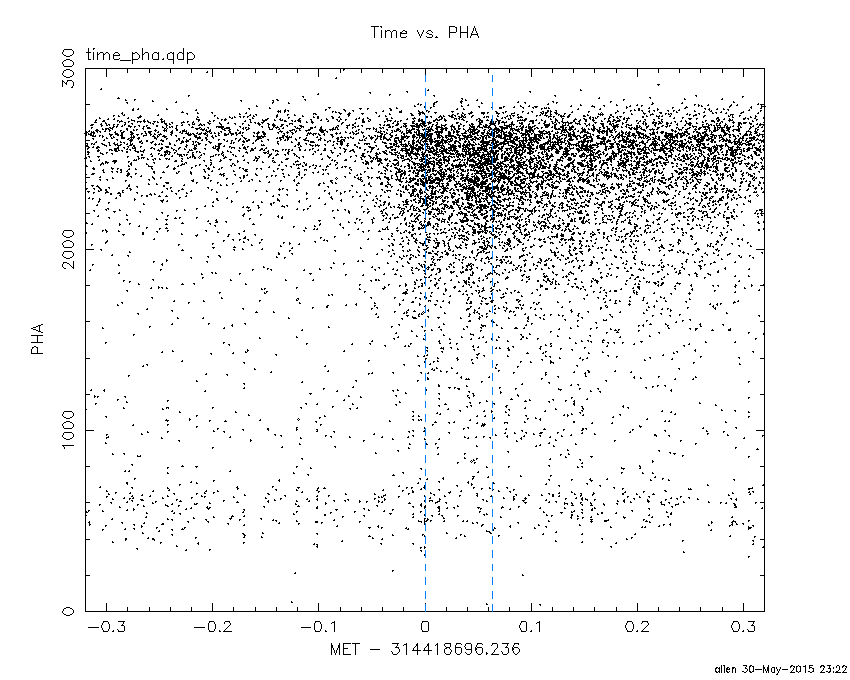
Blue+Cyan dotted lines: Time interval of the scaled map
From 0.000000 to 0.064000
TIME vs. DetID plot around the trigger time
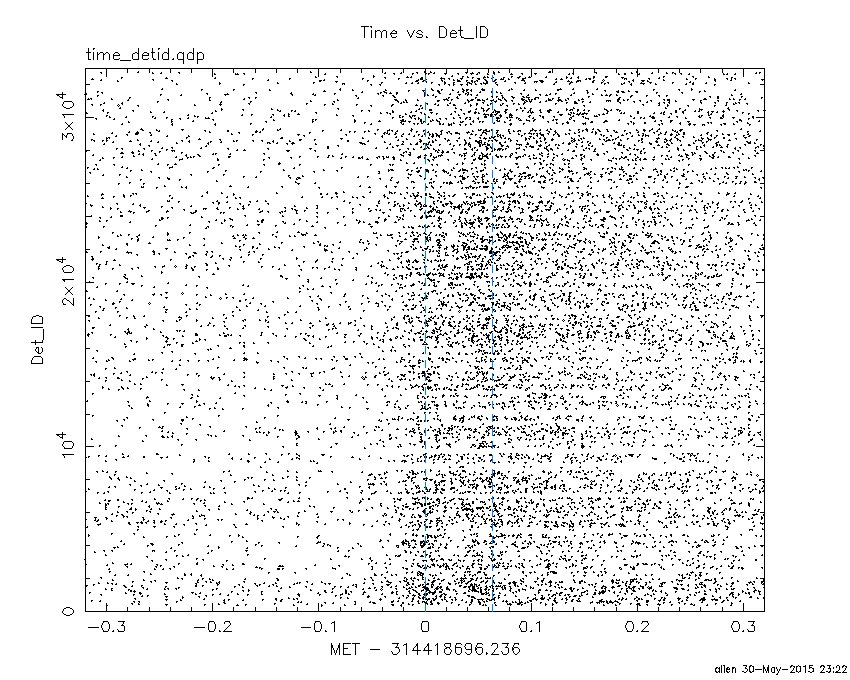
Blue+Cyan dotted lines: Time interval of the scaled map
From 0.000000 to 0.064000
100 us light curve (15-350 keV)
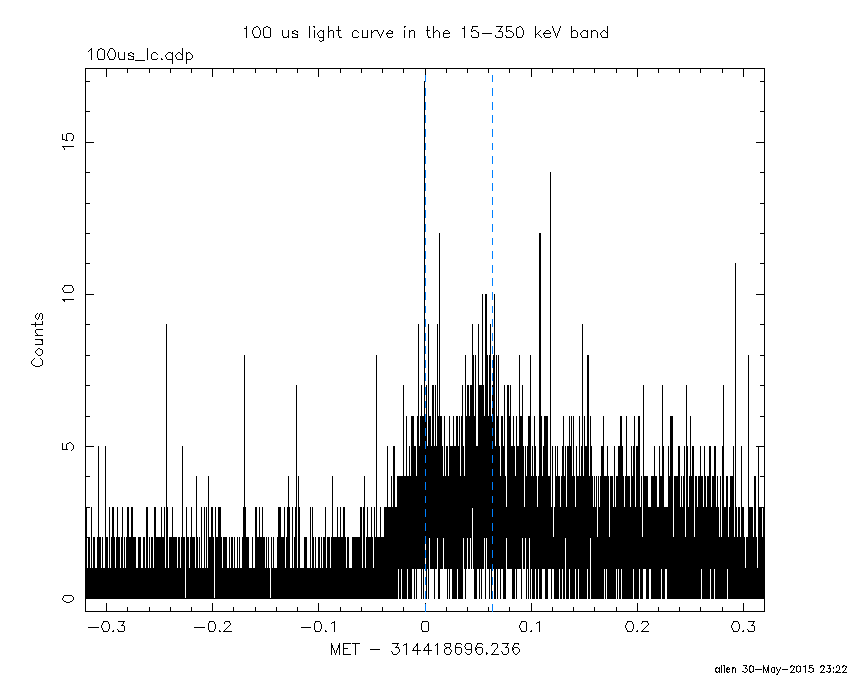
Blue+Cyan dotted lines: Time interval of the scaled map
From 0.000000 to 0.064000
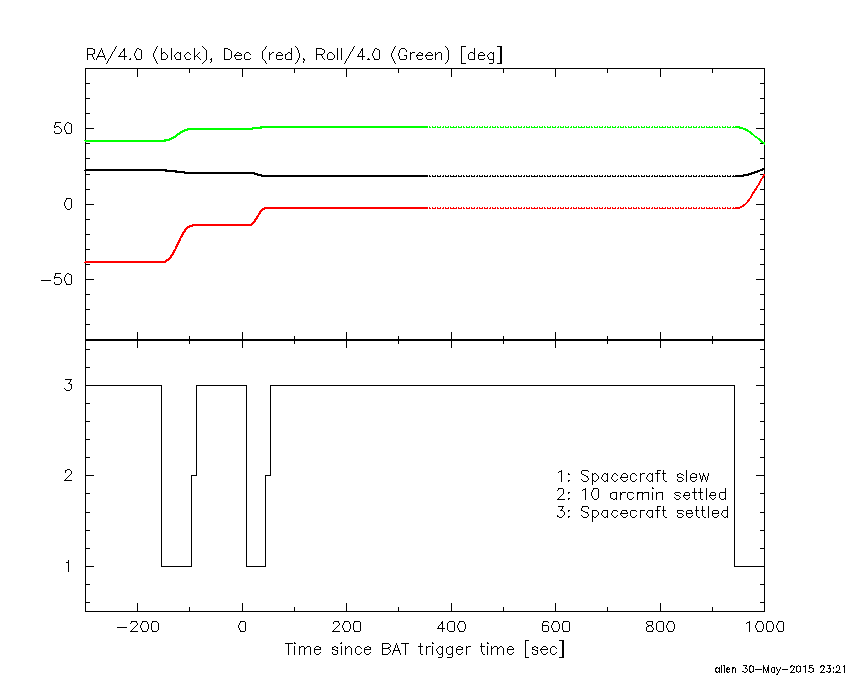
Spacecraft aspect plot
Bright source in the pre-burst/pre-slew/post-slew images
Pre-burst image of 15-350 keV band
Time interval of the image:
-97.735400 -0.016000

# RAcent  DECcent POSerr Theta    Phi  PeakCts   SNR AngSep     Name
#  [deg]    [deg]    ['] [deg]  [deg]                   [']
 83.6292  22.0135    0.8  36.1   70.7   4.3625  14.7    0.2	Crab
135.4922 -40.5295    2.3  52.5 -159.3   1.6319   4.9    2.2	Vela X-1
 49.5539 -16.8971    2.6  32.5  -29.5   0.5537   4.4 ------	UNKNOWN
Pre-slew background subtracted image of 15-350 keV band
Time interval of the image:
-0.016000 1.108000

# RAcent  DECcent POSerr Theta    Phi  PeakCts   SNR AngSep     Name
#  [deg]    [deg]    ['] [deg]  [deg]                   [']
 83.5213  21.9142    5.4  36.0   70.5  -0.0922  -2.2    8.7	Crab
135.7136 -40.6047    6.2  52.7 -159.2  -0.1006  -1.9    9.0	Vela X-1
 75.6639  24.2504    2.3  39.0   59.1   0.2661   5.0 ------	UNKNOWN
 74.5870  -2.5267    0.4  14.3   32.9   0.5955  31.7 ------	UNKNOWN
 41.8667  -0.0328    2.8  43.2   -4.6   0.1204   4.1 ------	UNKNOWN
 25.7403   1.0082    2.0  58.8  -10.0   0.5727   5.6 ------	UNKNOWN
118.0326 -47.6781    2.0  44.3 -143.4   0.1945   5.8 ------	UNKNOWN
 57.9937 -37.8916    2.4  32.7  -71.5   0.1344   4.7 ------	UNKNOWN
114.3862 -51.7391    2.2  45.2 -136.9   0.2088   5.2 ------	UNKNOWN
 51.4257 -40.3851    2.4  38.2  -69.6   0.2011   4.9 ------	UNKNOWN
Post-slew image of 15-350 keV band
Time interval of the image:
44.264630 941.564590

# RAcent  DECcent POSerr Theta    Phi  PeakCts   SNR AngSep     Name
#  [deg]    [deg]    ['] [deg]  [deg]                   [']
 83.6332  22.0176    0.3  26.1   85.6  37.4536  41.1    0.2	Crab
122.6020   6.9819    2.5  48.8  144.7  13.0251   4.7 ------	UNKNOWN
 79.6160  20.3299    3.0  23.4   78.2   2.9948   3.8 ------	UNKNOWN
 30.8312 -22.8492    4.8  47.0  -53.1   8.4787   2.4 ------	UNKNOWN
 23.5306 -16.0534    4.1  52.0  -42.2  10.6704   2.8 ------	UNKNOWN
Plot creation:
Sat May 30 23:22:46 EDT 2015