Special notes of this burst
Image
Pre-slew 15.0-350.0 keV image (Event data)

#   RAcent    DECcent   POSerr    Theta     Phi              Peak Cts       SNR   Name
   79.2888    64.1913   0.0196    44.2350   173.5517         0.3888617      9.822 TRIG_00441664

Foreground time interval of the image:
 -0.752   2.248 (delta_t =   3.000 [sec])
Background time interval of the image:
-515.551 -488.687 (delta_t =  26.864 [sec])
-239.752  -0.752 (delta_t = 239.000 [sec])
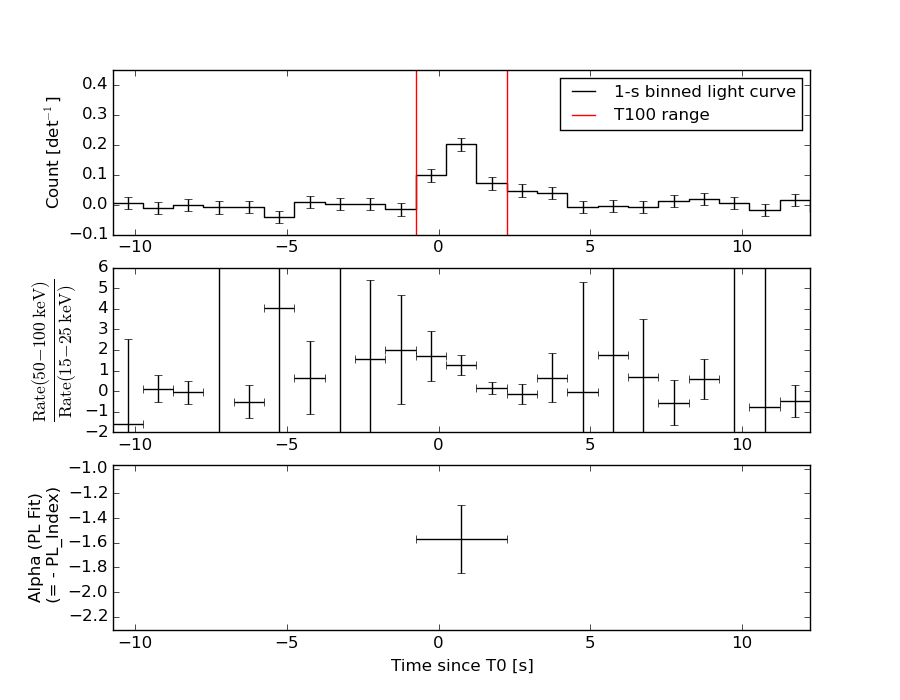
Lightcurves
Notes:
- 1) The mask-weighted light curves are using the flight position.
- 2) Multiple plots of different time binning/intervals are shown to cover all scenarios of short/long GRBs, rate/image triggers, and real/false positives.
- 3) For all the mask-weighted lightcurves, the y-axis units are counts/sec/det where a det is 0.4 x 0.4 = 0.16 sq cm.
- 4) The verticle lines correspond to following: green dotted lines are T50 interval, black dotted lines are T90 interval, blue solid line(s) is a spacecraft slew start time, and orange solid line(s) is a spacecraft slew end time.
- 5) Time of each bin is in the middle of the bin.
1 s binning
From T0-310 s to T0+310 s

From T100_start - 20 s to T100_end + 30 s

Full time interval

64 ms binning
Full time interval

From T100_start to T100_end

From T0-5 sec to T0+5 sec
16 ms binning
From T100_start-5 s to T100_start+5 s
Blue+Cyan dotted lines: Time interval of the scaled map
From 0.000000 to 1.024000
8 ms binning
From T100_start-3 s to T100_start+3 s

Blue+Cyan dotted lines: Time interval of the scaled map
From 0.000000 to 1.024000
2 ms binning
From T100_start-1 s to T100_start+1 s
Blue+Cyan dotted lines: Time interval of the scaled map
From 0.000000 to 1.024000
SN=5 or 10 sec. binning (whichever binning is satisfied first)

SN=5 or 10 sec. binning (T < 200 sec)

Quad-rate summed light curves (from T0-300s to T0+1000s)

The mask-weighted light curves based on cleaned DPHs

Spectral Evolution
Spectra
Notes:
- 1) The fitting includes the systematic errors.
- 2) When the burst includes telescope slew time periods, the fitting uses an average response file made from multiple 5-s response files through out the slew time plus single time preiod for the non-slew times, and weighted by the total counts in the corresponding time period using addrmf. An average response file is needed becuase a spectral fit using the pre-slew DRM will introduce some errors in both a spectral shape and a normalization if the PHA file contains a lot of the slew/post-slew time interval.
- 3) For fits to more complicated models (e.g. a power-law over a cutoff power-law), the BAT team has decided to require a chi-square improvement of more than 6 for each extra dof.
Time averaged spectrum fit using the average DRM
Power-law model

Time interval is from   -0.752 sec. to    2.248 sec.

Spectral model in power-law:
------------------------------------------------------------
Parameters  : value       lower 90%   higher 90%
Photon index: 1.56921     ( -0.27414   0.277141 )
Norm@50keV  : 8.46202E-03    ( -0.00142392   0.00141301 )
------------------------------------------------------------
#Fit statistic : Chi-Squared =          64.86 using 59 PHA bins.
# Reduced chi-squared =          1.138 for     57 degrees of freedom
# Null hypothesis probability =   2.215323e-01

Photon flux (15-150 keV)    in 3 sec: 1.07730 ( -0.181746  0.182254 ) ph/cm2/s
Energy fluence (15-150 keV)             : 2.38352e-07 ( -4.24614e-08  4.28925e-08 ) ergs/cm2
Cutoff power-law model

Time interval is from   -0.752 sec. to    2.248 sec.
Spectral model in the cutoff power-law:
------------------------------------------------------------
Parameters  : value       lower 90%   higher 90%
Photon index: 1.23550     ( -1.26684   1.16357 )
Epeak [keV] : 110.845      ( -110.959 -110.959 )
Norm@50keV  : 1.26885E-02    ( -0.00523266   0.0470187 )
------------------------------------------------------------
#Fit statistic : Chi-Squared =          64.56 using 59 PHA bins.
# Reduced chi-squared =          1.153 for     56 degrees of freedom
# Null hypothesis probability =   2.023060e-01

Photon flux (15-150 keV)    in 3 sec: 1.06693 ( -0.184431  0.18479 ) ph/cm2/s
Energy fluence (15-150 keV)             : 2.33019e-07 ( -4.7154e-08  4.58511e-08 ) ergs/cm2
Band function
Time interval is from   -0.752 sec. to    2.248 sec.

Spectral model in the Band function:
------------------------------------------------------------
Parameters  : value       lower 90%   higher 90%
alpha       : 4.91457   ( -13.9651   -4.91457 )
beta        : -1.84372    ( -0.685867   0.367447 )
Epeak [keV] : 29.9290      ( -10.3846 8.07148 )
Norm@50keV   : 291.152    ( -46.8729   4144.36 )
------------------------------------------------------------
#Fit statistic : Chi-Squared =          61.97 using 59 PHA bins.
# Reduced chi-squared =          1.127 for     55 degrees of freedom
# Null hypothesis probability =   2.414499e-01

Photon flux (15-150 keV)    in 3 sec:  (    ) ph/cm2/s
Energy fluence (15-150 keV)             : 0 ( 0  0 ) ergs/cm2
Single BB

Spectral model blackbody:
------------------------------------------------------------
Parameters  : value    Lower 90%  Upper 90%
kT [keV]    : 12.5449  (-2.49007  3.54883)
R^2/D10^2   : 0.229611  (-0.136484   0.287303)
(R is the radius in km and D10 is the distance to the source in units of 10 kpc)
------------------------------------------------------------
#Fit statistic : Chi-Squared =          73.35 using 59 PHA bins.
# Reduced chi-squared =          1.287 for     57 degrees of freedom
# Null hypothesis probability =   7.127902e-02

Energy  Fluence     90% Error
[keV]   [erg/cm2]   [erg/cm2]
15- 25  2.299e-08   7.590e-09
25- 50  7.612e-08   2.062e-08
50-150  7.412e-08   2.835e-08
15-150  1.732e-07   4.237e-08
Thermal bremsstrahlung (OTTB)

Spectral model: thermal bremsstrahlung
------------------------------------------------------------
Parameters  : value         Lower 90%    Upper 90%
kT [keV]    : 198.775       (-108.857      -198.622)
Norm        : 4.40182       (-0.721015     0.952323)
------------------------------------------------------------
#Fit statistic : Chi-Squared =          64.52 using 59 PHA bins.
# Reduced chi-squared =          1.132 for     57 degrees of freedom
# Null hypothesis probability =   2.304677e-01

Energy  Fluence     90% Error
[keV]   [erg/cm2]   [erg/cm2]
15- 25  3.289e-08   1.911e-08
25- 50  6.326e-08   3.567e-08
50-150  1.386e-07   7.714e-08
15-150  2.348e-07   1.305e-07
Double BB

Spectral model: bbodyrad<1> + bbodyrad<2>
------------------------------------------------------------
Parameters  : value         Lower 90%    Upper 90%
kT1 [keV]   : 8.66647        (-2.12993      2.58703)
R1^2/D10^2  : 0.707696        (-0.418575      0.636936)
kT2 [keV]   : 44.2748        (-21.4651      -44.1813)
R2^2/D10^2  : 2.18917E-03    (-0.00212142   0.0157864)
------------------------------------------------------------
#Fit statistic : Chi-Squared =          60.61 using 59 PHA bins.
# Reduced chi-squared =          1.102 for     55 degrees of freedom
# Null hypothesis probability =   2.805426e-01

Energy  Fluence     90% Error
[keV]   [erg/cm2]   [erg/cm2]
15- 25  3.195e-08   1.826e-08
25- 50  7.168e-08   4.048e-08
50-150  1.371e-07   7.769e-08
15-150  2.408e-07   1.217e-07
Peak spectrum fit
Power-law model
Time interval is from    0.248 sec. to    1.248 sec.

Spectral model in power-law:
------------------------------------------------------------
Parameters  : value       lower 90%   higher 90%
Photon index: 1.64572     ( -0.303448   0.312895 )
Norm@50keV  : 1.28451E-02    ( -0.00259323   0.00255811 )
------------------------------------------------------------
#Fit statistic : Chi-Squared =          70.85 using 59 PHA bins.
# Reduced chi-squared =          1.243 for     57 degrees of freedom
# Null hypothesis probability =   1.027483e-01

Photon flux (15-150 keV)    in 1 sec: 1.67490 ( -0.325325  0.325941 ) ph/cm2/s
Energy fluence (15-150 keV)             : 1.19514e-07 ( -2.50918e-08  2.54356e-08 ) ergs/cm2
Cutoff power-law model

Time interval is from    0.248 sec. to    1.248 sec.
Spectral model in the cutoff power-law:
------------------------------------------------------------
Parameters  : value       lower 90%   higher 90%
Photon index: 0.635984     ( -2.25297   1.31407 )
Epeak [keV] : 61.0571      ( -13.6721 -61.036 )
Norm@50keV  : 4.63956E-02    ( -0.046448   0.968973 )
------------------------------------------------------------
#Fit statistic : Chi-Squared =          69.35 using 59 PHA bins.
# Reduced chi-squared =          1.238 for     56 degrees of freedom
# Null hypothesis probability =   1.084300e-01

Photon flux (15-150 keV)    in 1 sec: 1.63846 ( -0.33077  0.33054 ) ph/cm2/s
Energy fluence (15-150 keV)             : 1.10868e-07 ( -2.91823e-08  2.8608e-08 ) ergs/cm2
Band function

Time interval is from    0.248 sec. to    1.248 sec.

Spectral model in the Band function:
------------------------------------------------------------
Parameters  : value       lower 90%   higher 90%
alpha       : 4.94653   ( -5.14172   -4.94653 )
beta        : -2.40733    ( -0.94712   0.594139 )
Epeak [keV] : 35.0541      ( -7.38048 5.35251 )
Norm@50keV   : 209.044    ( -38.2587   719.5 )
------------------------------------------------------------
#Fit statistic : Chi-Squared =          64.50 using 59 PHA bins.
# Reduced chi-squared =          1.173 for     55 degrees of freedom
# Null hypothesis probability =   1.784809e-01

Photon flux (15-150 keV)    in 1 sec:  (    ) ph/cm2/s
Energy fluence (15-150 keV)             : 1.10713e-07 ( 0  0 ) ergs/cm2
Single BB

Spectral model blackbody:
------------------------------------------------------------
Parameters  : value    Lower 90%  Upper 90%
kT [keV]    : 11.6364  (-2.31439  3.15157)
R^2/D10^2   : 0.484733  (-0.287046   0.616361)
(R is the radius in km and D10 is the distance to the source in units of 10 kpc)
------------------------------------------------------------
#Fit statistic : Chi-Squared =          72.32 using 59 PHA bins.
# Reduced chi-squared =          1.269 for     57 degrees of freedom
# Null hypothesis probability =   8.315699e-02

Energy  Fluence     90% Error
[keV]   [erg/cm2]   [erg/cm2]
15- 25  1.384e-08   5.201e-09
25- 50  4.198e-08   1.282e-08
50-150  3.347e-08   1.515e-08
15-150  8.928e-08   2.703e-08
Thermal bremsstrahlung (OTTB)
Spectral model: thermal bremsstrahlung
------------------------------------------------------------
Parameters  : value         Lower 90%    Upper 90%
kT [keV]    : 145.493       (-75.0254      -142.965)
Norm        : 7.00807       (-1.46159     2.06111)
------------------------------------------------------------
#Fit statistic : Chi-Squared =          69.84 using 59 PHA bins.
# Reduced chi-squared =          1.225 for     57 degrees of freedom
# Null hypothesis probability =   1.182383e-01

Energy  Fluence     90% Error
[keV]   [erg/cm2]   [erg/cm2]
15- 25  1.804e-08   1.045e-08
25- 50  3.330e-08   1.897e-08
50-150  6.489e-08   3.949e-08
15-150  1.162e-07   6.910e-08
Double BB

Spectral model: bbodyrad<1> + bbodyrad<2>
------------------------------------------------------------
Parameters  : value         Lower 90%    Upper 90%
kT1 [keV]   : 9.12107        (-2.6498      2.92614)
R1^2/D10^2  : 1.00915        (-0.629374      1.81972)
kT2 [keV]   : 48.8799        (-31.448      -48.8799)
R2^2/D10^2  : 2.06902E-03    (-0.00189316   0.071355)
------------------------------------------------------------
#Fit statistic : Chi-Squared =          66.00 using 59 PHA bins.
# Reduced chi-squared =          1.200 for     55 degrees of freedom
# Null hypothesis probability =   1.470807e-01

Energy  Fluence     90% Error
[keV]   [erg/cm2]   [erg/cm2]
15- 25  1.701e-08   1.005e-08
25- 50  3.966e-08   2.308e-08
50-150  6.138e-08   3.007e-08
15-150  1.180e-07   5.539e-08
Pre-slew spectrum (Pre-slew PHA with pre-slew DRM)
Power-law model

Spectral model in power-law:
------------------------------------------------------------
Parameters  : value       lower 90%   higher 90%
Photon index: 1.56921     ( -0.27414   0.277141 )
Norm@50keV  : 8.46202E-03    ( -0.00142392   0.00141301 )
------------------------------------------------------------
#Fit statistic : Chi-Squared =          64.86 using 59 PHA bins.
# Reduced chi-squared =          1.138 for     57 degrees of freedom
# Null hypothesis probability =   2.215323e-01

Photon flux (15-150 keV)    in 3 sec: 1.07730 ( -0.181746  0.182254 ) ph/cm2/s
Energy fluence (15-150 keV)             : 2.38352e-07 ( -4.24614e-08  4.28925e-08 ) ergs/cm2
Cutoff power-law model

Spectral model in the cutoff power-law:
------------------------------------------------------------
Parameters  : value       lower 90%   higher 90%
Photon index: 1.23550     ( -1.26684   1.16357 )
Epeak [keV] : 110.845      ( -110.959 -110.959 )
Norm@50keV  : 1.26885E-02    ( -0.00523266   0.0470187 )
------------------------------------------------------------
#Fit statistic : Chi-Squared =          64.56 using 59 PHA bins.
# Reduced chi-squared =          1.153 for     56 degrees of freedom
# Null hypothesis probability =   2.023060e-01

Photon flux (15-150 keV)    in 3 sec: 1.06693 ( -0.184431  0.18479 ) ph/cm2/s
Energy fluence (15-150 keV)             : 2.33019e-07 ( -4.7154e-08  4.58511e-08 ) ergs/cm2
Band function

Spectral model in the Band function:
------------------------------------------------------------
Parameters  : value       lower 90%   higher 90%
alpha       : 4.91457   ( -13.6314   -4.91457 )
beta        : -1.84372    ( -0.685867   0.367447 )
Epeak [keV] : 29.9290      ( -13.7618 8.07155 )
Norm@50keV   : 291.152    ( -46.8729   4144.36 )
------------------------------------------------------------
#Fit statistic : Chi-Squared =          61.97 using 59 PHA bins.
# Reduced chi-squared =          1.127 for     55 degrees of freedom
# Null hypothesis probability =   2.414499e-01

Photon flux (15-150 keV)    in 3 sec:  (    ) ph/cm2/s
Energy fluence (15-150 keV)             : 0 ( 0  0 ) ergs/cm2
S(25-50 keV) vs. S(50-100 keV) plot

S(25-50 keV)  = 6.09e-08
S(50-100 keV) = 8.21e-08
T90 vs. Hardness ratio plot

T90                                   = 3 sec.
Hardness ratio (energy fluence ratio) = 1.34811
Color vs. Color plot

Count Ratio  (25-50 keV) / (15-25 keV) = 1.79206
Count Ratio (50-100 keV) / (15-25 keV) = 0.936237
Mask shadow pattern

IMX = -9.674886340401854E-01, IMY = -1.093474487486454E-01
TIME vs. PHA plot around the trigger time
Blue+Cyan dotted lines: Time interval of the scaled map
From 0.000000 to 1.024000
TIME vs. DetID plot around the trigger time

Blue+Cyan dotted lines: Time interval of the scaled map
From 0.000000 to 1.024000
100 us light curve (15-350 keV)

Blue+Cyan dotted lines: Time interval of the scaled map
From 0.000000 to 1.024000
Spacecraft aspect plot

Bright source in the pre-burst/pre-slew/post-slew images
Pre-burst image of 15-350 keV band
Time interval of the image:
-515.551400 -488.687000
-239.752000 -0.752000

# RAcent  DECcent POSerr Theta    Phi  PeakCts   SNR AngSep     Name
#  [deg]    [deg]    ['] [deg]  [deg]                   [']
101.1183  30.2729    2.2  40.4  118.2   3.8992   5.3 ------	UNKNOWN
160.3167  14.1197    2.3  29.9    8.7   1.1662   4.9 ------	UNKNOWN
165.6803  67.3611    2.9  26.2 -136.6   0.9062   4.0 ------	UNKNOWN
194.5105  -0.3249    3.6  58.7  -25.9   4.9541   3.2 ------	UNKNOWN
200.0597  13.6426    3.8  51.9  -42.2   3.6259   3.1 ------	UNKNOWN
205.9678  38.1128    3.0  42.3  -74.0   3.4147   3.9 ------	UNKNOWN
Pre-slew background subtracted image of 15-350 keV band
Time interval of the image:
-0.752000 2.248000

# RAcent  DECcent POSerr Theta    Phi  PeakCts   SNR AngSep     Name
#  [deg]    [deg]    ['] [deg]  [deg]                   [']
108.7013  43.9098    2.3  29.6  136.4   0.1363   4.9 ------	UNKNOWN
 79.2888  64.1913    1.2  44.2  173.6   0.3888   9.8 ------	UNKNOWN
199.8807  43.7206    2.4  36.0  -79.8   0.1884   4.8 ------	UNKNOWN
217.8520  73.5540    2.7  43.4 -127.9   0.2160   4.3 ------	UNKNOWN
203.4457  43.2254    2.6  38.6  -80.3   0.2575   4.5 ------	UNKNOWN
Post-slew image of 15-350 keV band
Time interval of the image:
89.948610 162.348600

# RAcent  DECcent POSerr Theta    Phi  PeakCts   SNR AngSep     Name
#  [deg]    [deg]    ['] [deg]  [deg]                   [']
 83.6444  22.0207    1.7  42.3  121.7   3.0729   6.9    0.7	Crab
138.6816  34.5345    2.7  46.1   48.1   2.2163   4.2 ------	UNKNOWN
117.5867  56.6089    2.4  20.0   42.0   0.5222   4.8 ------	UNKNOWN
 51.0625  49.0457    2.2  21.4 -174.0   0.5239   5.2 ------	UNKNOWN
 54.7942  55.7085    2.2  14.8 -166.0   0.4933   5.3 ------	UNKNOWN
 38.2370  66.2748    2.1  17.0 -117.1   0.5402   5.5 ------	UNKNOWN
207.0103  52.4134    2.4  56.5  -17.0   1.8488   4.9 ------	UNKNOWN
217.5078  76.6975    2.3  36.7  -37.5   0.7066   4.9 ------	UNKNOWN
241.2071  63.0794    2.9  52.0  -42.1   2.2137   3.9 ------	UNKNOWN
  0.6559  41.5585    2.6  48.6 -130.4   2.1207   4.5 ------	UNKNOWN
Plot creation:
Sat May 30 23:13:51 EDT 2015