Special notes of this burst
Image
Pre-slew 15.0-350.0 keV image (Event data)

#   RAcent    DECcent   POSerr    Theta     Phi              Peak Cts       SNR   Name
  329.9315    26.4719   0.0252    18.9451   147.6612         0.0677049      7.655 TRIG_00442039

Foreground time interval of the image:
 -0.072   0.504 (delta_t =   0.576 [sec])
Background time interval of the image:
-239.024  -0.072 (delta_t = 238.952 [sec])
Lightcurves
Notes:
- 1) The mask-weighted light curves are using the flight position.
- 2) Multiple plots of different time binning/intervals are shown to cover all scenarios of short/long GRBs, rate/image triggers, and real/false positives.
- 3) For all the mask-weighted lightcurves, the y-axis units are counts/sec/det where a det is 0.4 x 0.4 = 0.16 sq cm.
- 4) The verticle lines correspond to following: green dotted lines are T50 interval, black dotted lines are T90 interval, blue solid line(s) is a spacecraft slew start time, and orange solid line(s) is a spacecraft slew end time.
- 5) Time of each bin is in the middle of the bin.
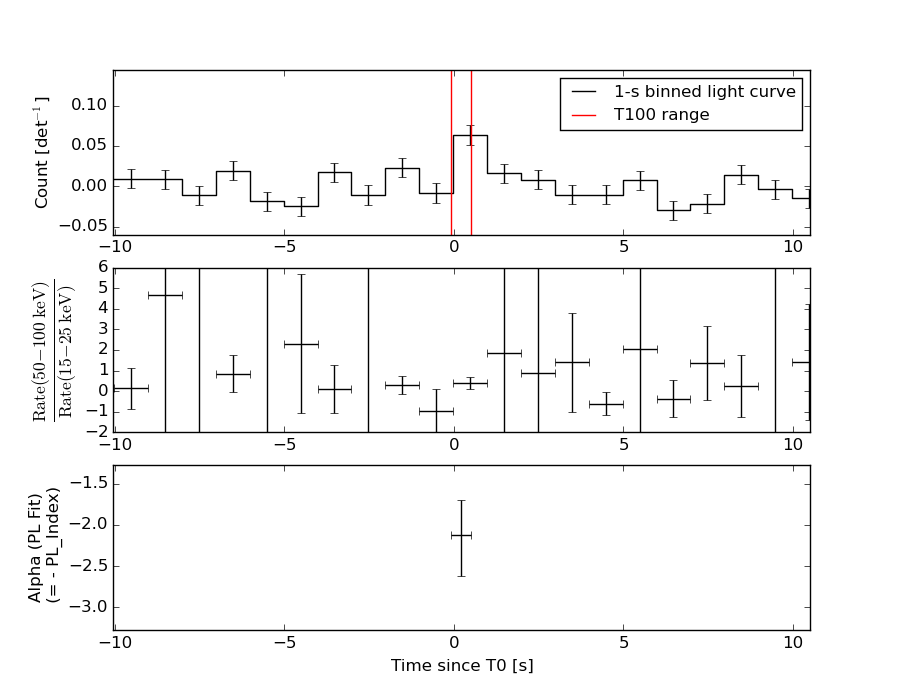
1 s binning
From T0-310 s to T0+310 s

From T100_start - 20 s to T100_end + 30 s

Full time interval

64 ms binning
Full time interval

From T100_start to T100_end

From T0-5 sec to T0+5 sec

16 ms binning
From T100_start-5 s to T100_start+5 s

Blue+Cyan dotted lines: Time interval of the scaled map
From 0.000000 to 0.512000
8 ms binning
From T100_start-3 s to T100_start+3 s

Blue+Cyan dotted lines: Time interval of the scaled map
From 0.000000 to 0.512000
2 ms binning
From T100_start-1 s to T100_start+1 s

Blue+Cyan dotted lines: Time interval of the scaled map
From 0.000000 to 0.512000
SN=5 or 10 sec. binning (whichever binning is satisfied first)

SN=5 or 10 sec. binning (T < 200 sec)

Quad-rate summed light curves (from T0-300s to T0+1000s)

The mask-weighted light curves based on cleaned DPHs

Spectral Evolution
Spectra
Notes:
- 1) The fitting includes the systematic errors.
- 2) When the burst includes telescope slew time periods, the fitting uses an average response file made from multiple 5-s response files through out the slew time plus single time preiod for the non-slew times, and weighted by the total counts in the corresponding time period using addrmf. An average response file is needed becuase a spectral fit using the pre-slew DRM will introduce some errors in both a spectral shape and a normalization if the PHA file contains a lot of the slew/post-slew time interval.
- 3) For fits to more complicated models (e.g. a power-law over a cutoff power-law), the BAT team has decided to require a chi-square improvement of more than 6 for each extra dof.
Time averaged spectrum fit using the average DRM
Power-law model

Time interval is from   -0.072 sec. to    0.504 sec.

Spectral model in power-law:
------------------------------------------------------------
Parameters  : value       lower 90%   higher 90%
Photon index: 2.12372     ( -0.423852   0.496848 )
Norm@50keV  : 5.54291E-03    ( -0.00189762   0.00183566 )
------------------------------------------------------------
#Fit statistic : Chi-Squared =          46.64 using 59 PHA bins.
# Reduced chi-squared =         0.8182 for     57 degrees of freedom
# Null hypothesis probability =   8.347757e-01

Photon flux (15-150 keV)    in 0.576 sec: 0.882392 ( -0.207488  0.207597 ) ph/cm2/s
Energy fluence (15-150 keV)             : 2.97361e-08 ( -8.72582e-09  9.34675e-09 ) ergs/cm2
Cutoff power-law model

Time interval is from   -0.072 sec. to    0.504 sec.
Spectral model in the cutoff power-law:
------------------------------------------------------------
Parameters  : value       lower 90%   higher 90%
Photon index: 0.882811     ( -3.33248   1.26705 )
Epeak [keV] : 33.7015      (   )
Norm@50keV  : 3.25731E-02    (     )
------------------------------------------------------------
#Fit statistic : Chi-Squared =          45.47 using 59 PHA bins.
# Reduced chi-squared =         0.8120 for     56 degrees of freedom
# Null hypothesis probability =   8.415608e-01

Photon flux (15-150 keV)    in 0.576 sec: 0.857625 ( -0.205038  0.209455 ) ph/cm2/s
Energy fluence (15-150 keV)             : 2.63934e-08 ( -8.17344e-09  1.0511e-08 ) ergs/cm2
Band function

Time interval is from   -0.072 sec. to    0.504 sec.

Spectral model in the Band function:
------------------------------------------------------------
Parameters  : value       lower 90%   higher 90%
alpha       : -0.950647   ( -2.31702   5.85433 )
beta        : -10.0000    ( 10   1.24345e-13 )
Epeak [keV] : 33.6443      ( -20.0084 -33.6434 )
Norm@50keV   : 2.94725E-02    ( -0.0294744   4.70984 )
------------------------------------------------------------
#Fit statistic : Chi-Squared =          45.47 using 59 PHA bins.
# Reduced chi-squared =         0.8268 for     55 degrees of freedom
# Null hypothesis probability =   8.164871e-01

Photon flux (15-150 keV)    in 0.576 sec:  (    ) ph/cm2/s
Energy fluence (15-150 keV)             : 0 ( 0  0 ) ergs/cm2
Single BB

Spectral model blackbody:
------------------------------------------------------------
Parameters  : value    Lower 90%  Upper 90%
kT [keV]    : 8.68177  (-2.01362  2.62037)
R^2/D10^2   : 0.729682  (-0.469886   1.31359)
(R is the radius in km and D10 is the distance to the source in units of 10 kpc)
------------------------------------------------------------
#Fit statistic : Chi-Squared =          47.23 using 59 PHA bins.
# Reduced chi-squared =         0.8287 for     57 degrees of freedom
# Null hypothesis probability =   8.184590e-01

Energy  Fluence     90% Error
[keV]   [erg/cm2]   [erg/cm2]
15- 25  6.047e-09   2.661e-09
25- 50  1.214e-08   6.119e-09
50-150  4.142e-09   2.843e-09
15-150  2.233e-08   1.191e-08
Thermal bremsstrahlung (OTTB)

Spectral model: thermal bremsstrahlung
------------------------------------------------------------
Parameters  : value         Lower 90%    Upper 90%
kT [keV]    : 49.6004       (-22.7366      62.2219)
Norm        : 5.09581       (-1.69127     2.80402)
------------------------------------------------------------
#Fit statistic : Chi-Squared =          45.58 using 59 PHA bins.
# Reduced chi-squared =         0.7997 for     57 degrees of freedom
# Null hypothesis probability =   8.615013e-01

Energy  Fluence     90% Error
[keV]   [erg/cm2]   [erg/cm2]
15- 25  7.164e-09   2.435e-09
25- 50  1.026e-08   4.315e-09
50-150  9.885e-09   6.868e-09
15-150  2.731e-08   1.371e-08
Double BB

Spectral model: bbodyrad<1> + bbodyrad<2>
------------------------------------------------------------
Parameters  : value         Lower 90%    Upper 90%
kT1 [keV]   : 4.55403        (-4.55699      80.3742)
R1^2/D10^2  : 4.69150        (-4.67649      -4.67649)
kT2 [keV]   : 12.2877        (-12.2964      -12.2964)
R2^2/D10^2  : 0.139993    (-0.139406   1.2335)
------------------------------------------------------------
#Fit statistic : Chi-Squared =          45.58 using 59 PHA bins.
# Reduced chi-squared =         0.8287 for     55 degrees of freedom
# Null hypothesis probability =   8.135190e-01

Energy  Fluence     90% Error
[keV]   [erg/cm2]   [erg/cm2]
15- 25  7.033e-09   3.747e-09
25- 50  1.064e-08   5.803e-09
50-150  7.751e-09   4.524e-09
15-150  2.542e-08   1.372e-08
Peak spectrum fit
Power-law model

Time interval is from   -0.284 sec. to    0.716 sec.

Spectral model in power-law:
------------------------------------------------------------
Parameters  : value       lower 90%   higher 90%
Photon index: 1.84172     ( -0.499921   0.561888 )
Norm@50keV  : 3.61406E-03    ( -0.00135356   0.00130995 )
------------------------------------------------------------
#Fit statistic : Chi-Squared =          74.66 using 59 PHA bins.
# Reduced chi-squared =          1.310 for     57 degrees of freedom
# Null hypothesis probability =   5.821682e-02

Photon flux (15-150 keV)    in 1 sec: 0.506297 ( -0.1528  0.152809 ) ph/cm2/s
Energy fluence (15-150 keV)             : 3.32493e-08 ( -1.18952e-08  1.27971e-08 ) ergs/cm2
Cutoff power-law model

Time interval is from   -0.284 sec. to    0.716 sec.
Spectral model in the cutoff power-law:
------------------------------------------------------------
Parameters  : value       lower 90%   higher 90%
Photon index: -0.126382     ( -5.18749   2.37922 )
Epeak [keV] : 42.1805      (   )
Norm@50keV  : 5.49870E-02    (     )
------------------------------------------------------------
#Fit statistic : Chi-Squared =          72.64 using 59 PHA bins.
# Reduced chi-squared =          1.297 for     56 degrees of freedom
# Null hypothesis probability =   6.673188e-02

Photon flux (15-150 keV)    in 1 sec: 0.480110 ( -0.150055  0.152958 ) ph/cm2/s
Energy fluence (15-150 keV)             : 2.74127e-08 ( -1.0071e-08  1.37189e-08 ) ergs/cm2
Band function

Time interval is from   -0.284 sec. to    0.716 sec.

Spectral model in the Band function:
------------------------------------------------------------
Parameters  : value       lower 90%   higher 90%
alpha       : 4.94524   ( -4.94524   -4.94524 )
beta        : -2.29295    ( 2.29295   0.721358 )
Epeak [keV] : 27.1515      ( -27.1515 11.3112 )
Norm@50keV   : 313.701    ( -91.6701   4.19187e+06 )
------------------------------------------------------------
#Fit statistic : Chi-Squared =          72.69 using 59 PHA bins.
# Reduced chi-squared =          1.322 for     55 degrees of freedom
# Null hypothesis probability =   5.527500e-02

Photon flux (15-150 keV)    in 1 sec:  (    ) ph/cm2/s
Energy fluence (15-150 keV)             : 0 ( 0  0 ) ergs/cm2
Single BB
Spectral model blackbody:
------------------------------------------------------------
Parameters  : value    Lower 90%  Upper 90%
kT [keV]    : 10.1835  (-2.73976  3.97644)
R^2/D10^2   : 0.237447  (-0.237384   0.532152)
(R is the radius in km and D10 is the distance to the source in units of 10 kpc)
------------------------------------------------------------
#Fit statistic : Chi-Squared =          73.02 using 59 PHA bins.
# Reduced chi-squared =          1.281 for     57 degrees of freedom
# Null hypothesis probability =   7.489696e-02

Energy  Fluence     90% Error
[keV]   [erg/cm2]   [erg/cm2]
15- 25  5.045e-09   3.115e-09
25- 50  1.287e-08   7.449e-09
50-150  7.077e-09   5.400e-09
15-150  2.499e-08   1.539e-08
Thermal bremsstrahlung (OTTB)

Spectral model: thermal bremsstrahlung
------------------------------------------------------------
Parameters  : value         Lower 90%    Upper 90%
kT [keV]    : 74.6932       (-42.0611      -74.6673)
Norm        : 2.47951       (-0.861058     1.4333)
------------------------------------------------------------
#Fit statistic : Chi-Squared =          73.58 using 59 PHA bins.
# Reduced chi-squared =          1.291 for     57 degrees of freedom
# Null hypothesis probability =   6.885087e-02

Energy  Fluence     90% Error
[keV]   [erg/cm2]   [erg/cm2]
15- 25  6.401e-09   3.934e-09
25- 50  1.036e-08   6.370e-09
50-150  1.395e-08   1.225e-08
15-150  3.071e-08   2.164e-08
Double BB

------------------------------------------------------------
Parameters  : value         Lower 90%    Upper 90%
kT1 [keV]   : 6.98757        (-6.18009      -6.18009)
R1^2/D10^2  : 0.529928        (      )
kT2 [keV]   : 14.9788        (-15.1742      -15.1742)
R2^2/D10^2  : 3.32967E-02    (-0.0294741   0.655696)
------------------------------------------------------------
#Fit statistic : Chi-Squared =          72.63 using 59 PHA bins.
#Fit statistic : Chi-Squared =          72.53 using 59 PHA bins.
# Reduced chi-squared =          1.320 for     55 degrees of freedom
# Reduced chi-squared =          1.319 for     55 degrees of freedom
# Null hypothesis probability =   5.583161e-02
# Null hypothesis probability =   5.674458e-02

Energy  Fluence     90% Error
[keV]   [erg/cm2]   [erg/cm2]
15- 25  5.716e-09   3.367e-09
25- 50  1.197e-08   7.915e-09
50-150  9.283e-09   6.470e-09
15-150  2.697e-08   1.938e-08
Pre-slew spectrum (Pre-slew PHA with pre-slew DRM)
Power-law model
Spectral model in power-law:
------------------------------------------------------------
Parameters  : value       lower 90%   higher 90%
Photon index: 2.12372     ( -0.423852   0.496848 )
Norm@50keV  : 5.54291E-03    ( -0.00189762   0.00183566 )
------------------------------------------------------------
#Fit statistic : Chi-Squared =          46.64 using 59 PHA bins.
# Reduced chi-squared =         0.8182 for     57 degrees of freedom
# Null hypothesis probability =   8.347757e-01

Photon flux (15-150 keV)    in 0.576 sec: 0.882392 ( -0.207488  0.207597 ) ph/cm2/s
Energy fluence (15-150 keV)             : 2.97361e-08 ( -8.72582e-09  9.34675e-09 ) ergs/cm2
Cutoff power-law model
Spectral model in the cutoff power-law:
------------------------------------------------------------
Parameters  : value       lower 90%   higher 90%
Photon index: 0.882811     ( -3.33248   1.26705 )
Epeak [keV] : 33.7015      (   )
Norm@50keV  : 3.25731E-02    (     )
------------------------------------------------------------
#Fit statistic : Chi-Squared =          45.47 using 59 PHA bins.
# Reduced chi-squared =         0.8120 for     56 degrees of freedom
# Null hypothesis probability =   8.415608e-01

Photon flux (15-150 keV)    in 0.576 sec: 0.857625 ( -0.205038  0.209455 ) ph/cm2/s
Energy fluence (15-150 keV)             : 2.63934e-08 ( -8.17344e-09  1.0511e-08 ) ergs/cm2
Band function
Spectral model in the Band function:
------------------------------------------------------------
Parameters  : value       lower 90%   higher 90%
alpha       : -0.950647   ( -2.00764   5.85436 )
beta        : -10.0000    ( 10   7.10543e-15 )
Epeak [keV] : 33.6443      ( -20.0085 -33.6434 )
Norm@50keV   : 2.94725E-02    ( -0.0294744   4.70984 )
------------------------------------------------------------
#Fit statistic : Chi-Squared =          45.47 using 59 PHA bins.
# Reduced chi-squared =         0.8268 for     55 degrees of freedom
# Null hypothesis probability =   8.164871e-01

Photon flux (15-150 keV)    in 0.576 sec:  (    ) ph/cm2/s
Energy fluence (15-150 keV)             : 0 ( 0  0 ) ergs/cm2
S(25-50 keV) vs. S(50-100 keV) plot

S(25-50 keV)  = 9.25e-09
S(50-100 keV) = 8.49e-09
T90 vs. Hardness ratio plot

T90                                   = 0.523999989032745 sec.
Hardness ratio (energy fluence ratio) = 0.917838
Color vs. Color plot

Count Ratio  (25-50 keV) / (15-25 keV) = 1.01967
Count Ratio (50-100 keV) / (15-25 keV) = 0.488667
Mask shadow pattern

IMX = -2.900177082464261E-01, IMY = -1.836163409222701E-01
TIME vs. PHA plot around the trigger time

Blue+Cyan dotted lines: Time interval of the scaled map
From 0.000000 to 0.512000
TIME vs. DetID plot around the trigger time

Blue+Cyan dotted lines: Time interval of the scaled map
From 0.000000 to 0.512000
100 us light curve (15-350 keV)

Blue+Cyan dotted lines: Time interval of the scaled map
From 0.000000 to 0.512000
Spacecraft aspect plot
Bright source in the pre-burst/pre-slew/post-slew images
Pre-burst image of 15-350 keV band
Time interval of the image:
-239.024000 -0.072000

# RAcent  DECcent POSerr Theta    Phi  PeakCts   SNR AngSep     Name
#  [deg]    [deg]    ['] [deg]  [deg]                   [']
254.4926  35.4460    4.9  47.0   -1.4  -0.9177  -2.4    6.4	Her X-1
288.7876  10.9416    1.7  24.2  -61.8   1.7802   6.7    0.7	GRS 1915+105
299.5984  35.1981    1.0  12.0   24.6   2.1719  11.2    0.5	Cyg X-1
308.0999  40.9591    3.0  14.8   61.4   0.9219   3.9    0.6	Cyg X-3
326.1595  38.1987    7.3  19.0  109.6  -0.3884  -1.6    7.4	Cyg X-2
298.0526 -13.7506    3.2  41.2 -100.7   3.9448   3.6 ------	UNKNOWN
Pre-slew background subtracted image of 15-350 keV band
Time interval of the image:
-0.072000 0.504000

# RAcent  DECcent POSerr Theta    Phi  PeakCts   SNR AngSep     Name
#  [deg]    [deg]    ['] [deg]  [deg]                   [']
254.4994  35.2441    4.7  47.0   -1.7   0.0439   2.5    6.2	Her X-1
288.7513  11.0131    4.6  24.2  -61.6  -0.0259  -2.5    4.9	GRS 1915+105
299.4413  35.0912    4.7  12.0   23.8   0.0207   2.4    9.9	Cyg X-1
307.8460  40.8826    0.0  14.8   60.6  -0.0162  -1.7   12.7	Cyg X-3
326.2081  38.1135    0.0  18.9  109.9  -0.0109  -1.1   12.6	Cyg X-2
329.9314  26.4717    1.5  18.9  147.7   0.0677   7.7 ------	UNKNOWN
349.8246   7.4302    2.3  43.3  171.5   0.0867   5.1 ------	UNKNOWN
271.0699  35.9951    2.1  33.5   -0.2   0.0620   5.5 ------	UNKNOWN
246.0876  31.9977    2.7  54.4   -4.6   0.1243   4.3 ------	UNKNOWN
304.9515  -7.4822    2.7  33.8 -109.8   0.0662   4.3 ------	UNKNOWN
Post-slew image of 15-350 keV band
Time interval of the image:
59.276600 303.083600
360.976000 860.276580

# RAcent  DECcent POSerr Theta    Phi  PeakCts   SNR AngSep     Name
#  [deg]    [deg]    ['] [deg]  [deg]                   [']
288.8495  10.9351    6.2  41.7  -53.6   2.9795   1.9    3.1	GRS 1915+105
299.5744  35.2029    0.8  27.3  -13.6   6.8711  14.7    0.8	Cyg X-1
308.1354  40.9722    1.8  23.1    4.7   2.9676   6.3    1.6	Cyg X-3
326.0961  38.2878    4.4  12.2   36.0   1.2905   2.6    4.1	Cyg X-2
297.6299  49.1086    2.6  33.6   11.2   2.5792   4.4 ------	UNKNOWN
283.8361   8.5832    4.7  47.1  -53.3   6.3728   2.5 ------	UNKNOWN
306.3748  -7.4569    5.1  40.9  -92.4   5.5785   2.3 ------	UNKNOWN
Plot creation:
Sat May 30 23:10:19 EDT 2015