Click here for the BAT GCN circular template
Image
Pre-slew 15-350 keV image (Event data; bkg subtracted)

#   RAcent  DECcent POSerr  Theta    Phi     Peak Cts     SNR  Name
    2.3396 -40.9791 0.0511   23.0  168.6       0.0555     3.8  TRIG_00442771
------------------------------------------

Foreground time interval of the image:
  0.000   1.024 (delta_t =   1.024 [sec])
Background time interval of the image:
-60.232  -7.232 (delta_t =  53.000 [sec])
Lightcurves
Notes:
- 1) All plots contain as much data as has been downloaded to date.
- 2) The mask-weighted light curves are using the flight position.
- 3) Multiple plots of different time binning/intervals are shown to cover all scenarios of short/long GRBs, rate/image triggers, and real/false positives.
- 4) For all the mask-weighted lightcurves, the y-axis units are counts/sec/det where a det is 0.4 x 0.4 = 0.16 sq cm.
- 5) The verticle lines correspond to following: green dotted lines are T50 interval, black dotted lines are T90 interval, blue solid line(s) is a spacecraft slew start time, and orange solid line(s) is a spacecraft slew end time.
- 6) Time of each bin is in the middle of the bin.
1 s binning
From T0-310 s to T0+310 s

From T100_start - 20 s to T100_end + 30 s

Full time interval

64 ms binning
Full time interval

From T100_start to T100_end

From T0-5 sec to T0+5 sec

16 ms binning
From T100_start-5 s to T100_start+5 s

8 ms binning
From T100_start-3 s to T100_start+3 s

2 ms binning
From T100_start-1 s to T100_start+1 s

SN=5 or 10 sec. binning (whichever binning is satisfied first)

SN=5 or 10 sec. binning (T < 200 sec)

Flight mask-tagged light curves
Caution: Mask-weight map is always using the same on-axis map


Quad-rate summed light curves (from T0-300 to T0+1000)

The mask-weighted light curves based on cleaned DPHs

Spectra
Notes:
- 1) The fitting includes the systematic errors.
- 2) For long bursts, a spectral fit of the pre-slew DRM will introduce some errors in both a spectral shape and a normalization if the PHA file contains a lot of the slew/post-slew time interval.
- 3) For fits to more complicated models (e.g. a power-law over a cutoff power-law), the BAT team has decided to require a chi-square improvement of more than 6 for each extra dof.
- 4) For short bursts (T90<1sec), the specrtum is also fit with Blackbody, OTTB, and Double Blackbody.
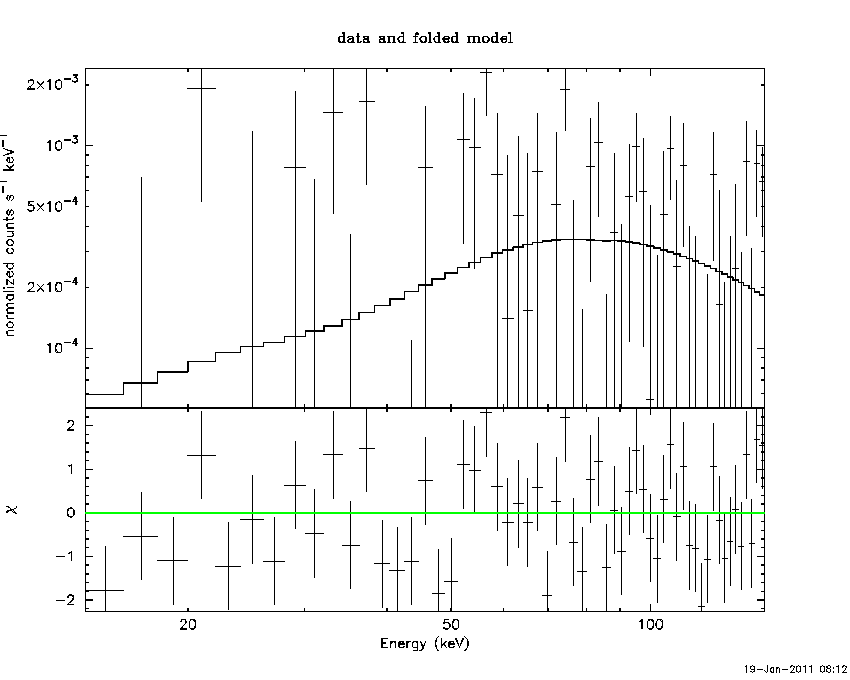
Time averaged spectrum fit using the pre-slew DRM
Power-law model

Time interval is from    0.000 sec. to    1.024 sec.

Spectral model in power-law:
------------------------------------------------------------
Parameters  : value       lower 90%   higher 90%
Photon index: -1.17774     ( -0.793099   1.09719 )
Norm@50keV  : 9.44116E-04    ( -0.000942832   0.00133337 )
------------------------------------------------------------
# Chi-Squared =          73.93 using 59 PHA bins.
# Reduced chi-squared =          1.297 for     57 degrees of freedom
# Null hypothesis probability =   6.526663e-02

Photon flux (15-150 keV)    in 1.024 sec: 0.235089 ( -0.138509  0.131278 ) ph/cm2/s
Energy fluence (15-150 keV)             : 3.99176e-08 ( -2.22347e-08  1.89697e-08 ) ergs/cm2
Cutoff power-law model

Time interval is from    0.000 sec. to    1.024 sec.
Spectral model in the cutoff power-law:
------------------------------------------------------------
Parameters  : value       lower 90%   higher 90%
Photon index: -2.25994     (     )
Epeak [keV] : 506.200      ( -509.16 -509.16 )
Norm@50keV  : 1.10585E-03    ( -0.00110288   0.0113146 )
------------------------------------------------------------
# Chi-Squared =          73.68 using 59 PHA bins.
# Reduced chi-squared =          1.316 for     56 degrees of freedom
# Null hypothesis probability =   5.668013e-02

Photon flux (15-150 keV)    in 1.024 sec: 0.235158 (    ) ph/cm2/s
Energy fluence (15-150 keV)             : 4.01721e-08 ( -2.26008e-08  1.8945e-08 ) ergs/cm2
Band function

Time interval is from    0.000 sec. to    1.024 sec.

Spectral model in the Band function:
------------------------------------------------------------
Parameters  : value       lower 90%   higher 90%
alpha       : 4.35882   ( -2.31166   -2.31166 )
beta        : 0.864390    ( -1.06018   0.886786 )
Epeak [keV] : 173.192      ( -173.111 9805.03 )
Norm@50keV   : 4.63425E-03    ( -0.00462173   0.024678 )
------------------------------------------------------------
# Chi-Squared =          73.50 using 59 PHA bins.
# Reduced chi-squared =          1.336 for     55 degrees of freedom
# Null hypothesis probability =   4.851221e-02

Photon flux (15-150 keV)    in 1.024 sec:  (    ) ph/cm2/s
Energy fluence (15-150 keV)             : 0 ( 0  0 ) ergs/cm2
Single BB

Spectral model blackbody:
------------------------------------------------------------
Parameters  : value    Lower 90%  Upper 90%
kT [keV]    :   (  )
R^2/D10^2   :   (   )
(R is the radius in km and D10 is the distance to the source in units of 10 kpc)
------------------------------------------------------------

Energy  Fluence     90% Error
[keV]   [erg/cm2]   [erg/cm2]
15- 25
25- 50
50-150
15-150
Thermal bremsstrahlung (OTTB)

Spectral model: thermal bremsstrahlung
------------------------------------------------------------
Parameters  : value         Lower 90%    Upper 90%
kT [keV]    :        (      )
Norm        :        (     )
------------------------------------------------------------

Energy  Fluence     90% Error
[keV]   [erg/cm2]   [erg/cm2]
15- 25
25- 50
50-150
15-150
Double BB

Spectral model: bbodyrad<1> + bbodyrad<2>
------------------------------------------------------------
Parameters  : value         Lower 90%    Upper 90%
kT1 [keV]   :         (      )
R1^2/D10^2  :         (      )
kT2 [keV]   :         (      )
R2^2/D10^2  :     (   )
------------------------------------------------------------

Energy  Fluence     90% Error
[keV]   [erg/cm2]   [erg/cm2]
15- 25
25- 50
50-150
15-150
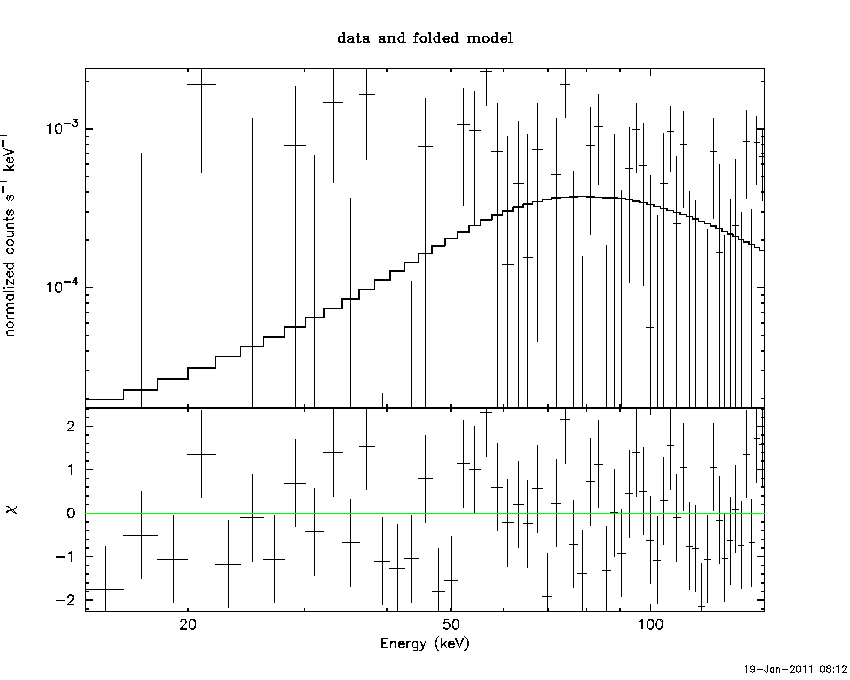
Peak spectrum fit
Power-law model

Time interval is from    0.000 sec. to    1.024 sec.

Spectral model in power-law:
------------------------------------------------------------
Parameters  : value       lower 90%   higher 90%
Photon index: -1.17774     ( -0.793099   1.09719 )
Norm@50keV  : 9.44116E-04    ( -0.000942832   0.00133337 )
------------------------------------------------------------
# Chi-Squared =          73.93 using 59 PHA bins.
# Reduced chi-squared =          1.297 for     57 degrees of freedom
# Null hypothesis probability =   6.526663e-02

Photon flux (15-150 keV)    in 1.024 sec: 0.235089 ( -0.138509  0.131278 ) ph/cm2/s
Energy fluence (15-150 keV)             : 3.99176e-08 ( -2.22347e-08  1.89697e-08 ) ergs/cm2
Cutoff power-law model

Time interval is from    0.000 sec. to    1.024 sec.
Spectral model in the cutoff power-law:
------------------------------------------------------------
Parameters  : value       lower 90%   higher 90%
Photon index: -2.25994     (     )
Epeak [keV] : 506.200      ( -509.16 -509.16 )
Norm@50keV  : 1.10585E-03    ( -0.00110288   0.0113146 )
------------------------------------------------------------
# Chi-Squared =          73.68 using 59 PHA bins.
# Reduced chi-squared =          1.316 for     56 degrees of freedom
# Null hypothesis probability =   5.668013e-02

Photon flux (15-150 keV)    in 1.024 sec: 0.235158 (    ) ph/cm2/s
Energy fluence (15-150 keV)             : 4.01721e-08 ( -2.26008e-08  1.8945e-08 ) ergs/cm2
Band function

Time interval is from    0.000 sec. to    1.024 sec.

Spectral model in the Band function:
------------------------------------------------------------
Parameters  : value       lower 90%   higher 90%
alpha       : 4.35882   ( -2.31166   -2.31166 )
beta        : 0.864390    ( -1.06018   0.886786 )
Epeak [keV] : 173.192      ( -173.111 9805.02 )
Norm@50keV   : 4.63425E-03    ( -0.00462173   0.024678 )
------------------------------------------------------------
# Chi-Squared =          73.50 using 59 PHA bins.
# Reduced chi-squared =          1.336 for     55 degrees of freedom
# Null hypothesis probability =   4.851221e-02

Photon flux (15-150 keV)    in 1.024 sec:  (    ) ph/cm2/s
Energy fluence (15-150 keV)             : 0 ( 0  0 ) ergs/cm2
Single BB

Spectral model blackbody:
------------------------------------------------------------
Parameters  : value    Lower 90%  Upper 90%
kT [keV]    :   (  )
R^2/D10^2   :   (   )
(R is the radius in km and D10 is the distance to the source in units of 10 kpc)
------------------------------------------------------------

Energy  Fluence     90% Error
[keV]   [erg/cm2]   [erg/cm2]
15- 25
25- 50
50-150
15-150
Thermal bremsstrahlung (OTTB)

Spectral model: thermal bremsstrahlung
------------------------------------------------------------
Parameters  : value         Lower 90%    Upper 90%
kT [keV]    :        (      )
Norm        :        (     )
------------------------------------------------------------

Energy  Fluence     90% Error
[keV]   [erg/cm2]   [erg/cm2]
15- 25
25- 50
50-150
15-150
Double BB

Spectral model: bbodyrad<1> + bbodyrad<2>
------------------------------------------------------------
Parameters  : value         Lower 90%    Upper 90%
kT1 [keV]   :         (      )
R1^2/D10^2  :         (      )
kT2 [keV]   :         (      )
R2^2/D10^2  :     (   )
------------------------------------------------------------

Energy  Fluence     90% Error
[keV]   [erg/cm2]   [erg/cm2]
15- 25
25- 50
50-150
15-150
Pre-slew spectrum (Pre-slew PHA with pre-slew DRM)
Power-law model
Spectral model in power-law:
------------------------------------------------------------
Parameters  : value       lower 90%   higher 90%
Photon index: -1.17774     ( -0.793099   1.09719 )
Norm@50keV  : 9.44116E-04    ( -0.000942832   0.00133337 )
------------------------------------------------------------
# Chi-Squared =          73.93 using 59 PHA bins.
# Reduced chi-squared =          1.297 for     57 degrees of freedom
# Null hypothesis probability =   6.526663e-02

Photon flux (15-150 keV)    in 1.024 sec: 0.235089 ( -0.138509  0.131278 ) ph/cm2/s
Energy fluence (15-150 keV)             : 3.99176e-08 ( -2.22347e-08  1.89697e-08 ) ergs/cm2
Cutoff power-law model

Spectral model in the cutoff power-law:
------------------------------------------------------------
Parameters  : value       lower 90%   higher 90%
Photon index: -2.25994     (     )
Epeak [keV] : 506.200      ( -509.16 -509.16 )
Norm@50keV  : 1.10585E-03    ( -0.00110288   0.00813841 )
------------------------------------------------------------
# Chi-Squared =          73.68 using 59 PHA bins.
# Reduced chi-squared =          1.316 for     56 degrees of freedom
# Null hypothesis probability =   5.668013e-02

Photon flux (15-150 keV)    in 1.024 sec: 0.235158 (    ) ph/cm2/s
Energy fluence (15-150 keV)             : 4.01721e-08 ( -2.26008e-08  1.8945e-08 ) ergs/cm2
Band function
Spectral model in the Band function:
------------------------------------------------------------
Parameters  : value       lower 90%   higher 90%
alpha       : 4.35882   ( -2.31166   -2.31166 )
beta        : 0.864390    ( -1.06018   0.886786 )
Epeak [keV] : 173.192      ( -173.111 9805.01 )
Norm@50keV   : 4.63425E-03    ( -0.00462173   0.0251398 )
------------------------------------------------------------
# Chi-Squared =          73.50 using 59 PHA bins.
# Reduced chi-squared =          1.336 for     55 degrees of freedom
# Null hypothesis probability =   4.851221e-02

Photon flux (15-150 keV)    in 1.024 sec:  (    ) ph/cm2/s
Energy fluence (15-150 keV)             : 0 ( 0  0 ) ergs/cm2
S(25-50 keV) vs. S(50-100 keV) plot

S(25-50 keV)  = 1.07502e-09
S(50-100 keV) = 9.77521e-09
T90 vs. Hardness ratio plot

T90                                   = 1.02399998903275 sec.
Hardness ratio (energy fluence ratio) = 9.09305
Color vs. Color plot

Count Ratio  (25-50 keV) / (15-25 keV) = 1.16216
Count Ratio (50-100 keV) / (15-25 keV) = -6.43339
Mask shadow pattern

IMX = -4.170439006275052E-01, IMY = -8.434530439105566E-02
TIME vs. PHA plot around the trigger time

TIME vs. DetID plot around the trigger time

100 us light curve (15-350 keV)

Spacecraft aspect plot

Bright source in the pre-burst/pre-slew/post-slew images
Pre-burst image of 15-350 keV band
Time interval of the image:
-60.232000 -7.232000

# RAcent  DECcent POSerr Theta    Phi  PeakCts   SNR AngSep     Name
#  [deg]    [deg]    ['] [deg]  [deg]                   [']
347.2104 -56.2738    2.6  36.4 -165.8   0.8521   4.4 ------	UNKNOWN
323.8533  27.2466    2.7  54.1  -19.8   1.7053   4.2 ------	UNKNOWN
Pre-slew background subtracted image of 15-350 keV band
Time interval of the image:
0.000000 1.024000

# RAcent  DECcent POSerr Theta    Phi  PeakCts   SNR AngSep     Name
#  [deg]    [deg]    ['] [deg]  [deg]                   [']
317.9528  -9.3240    2.6  33.8  -66.1   0.0848   4.4 ------	UNKNOWN
315.2074 -38.3552    2.3  36.1 -118.1   0.1034   4.9 ------	UNKNOWN
Post-slew image of 15-350 keV band
Time interval of the image:
62.668600 119.958000
120.768000 302.818000

# RAcent  DECcent POSerr Theta    Phi  PeakCts   SNR AngSep     Name
#  [deg]    [deg]    ['] [deg]  [deg]                   [']
 79.4500 -63.1034    3.6  48.5  142.5   8.2488   3.2 ------	UNKNOWN
344.3364 -44.8019    2.4  13.7 -113.3   2.2145   4.8 ------	UNKNOWN
Plot creation:
Wed Jan 19 08:13:36 EST 2011