Special notes of this burst
Image
Pre-slew 15.0-350.0 keV image (Event data)

#   RAcent    DECcent   POSerr    Theta     Phi              Peak Cts       SNR   Name
  348.5833     5.9862   0.0104    10.0018  -119.7654         2.0383631     18.591 TRIG_00442978

Foreground time interval of the image:
-86.260  11.141 (delta_t =  97.401 [sec])
Background time interval of the image:
-239.960 -86.260 (delta_t = 153.700 [sec])
Lightcurves
Notes:
- 1) The mask-weighted light curves are using the flight position.
- 2) Multiple plots of different time binning/intervals are shown to cover all scenarios of short/long GRBs, rate/image triggers, and real/false positives.
- 3) For all the mask-weighted lightcurves, the y-axis units are counts/sec/det where a det is 0.4 x 0.4 = 0.16 sq cm.
- 4) The verticle lines correspond to following: green dotted lines are T50 interval, black dotted lines are T90 interval, blue solid line(s) is a spacecraft slew start time, and orange solid line(s) is a spacecraft slew end time.
- 5) Time of each bin is in the middle of the bin.
1 s binning
From T0-310 s to T0+310 s

From T100_start - 20 s to T100_end + 30 s

Full time interval

64 ms binning
Full time interval

From T100_start to T100_end

From T0-5 sec to T0+5 sec
16 ms binning
From T100_start-5 s to T100_start+5 s

Blue+Cyan dotted lines: Time interval of the scaled map
From 0.000000 to 0.512000
8 ms binning
From T100_start-3 s to T100_start+3 s

Blue+Cyan dotted lines: Time interval of the scaled map
From 0.000000 to 0.512000
2 ms binning
From T100_start-1 s to T100_start+1 s

Blue+Cyan dotted lines: Time interval of the scaled map
From 0.000000 to 0.512000
SN=5 or 10 sec. binning (whichever binning is satisfied first)

SN=5 or 10 sec. binning (T < 200 sec)

Quad-rate summed light curves (from T0-300s to T0+1000s)
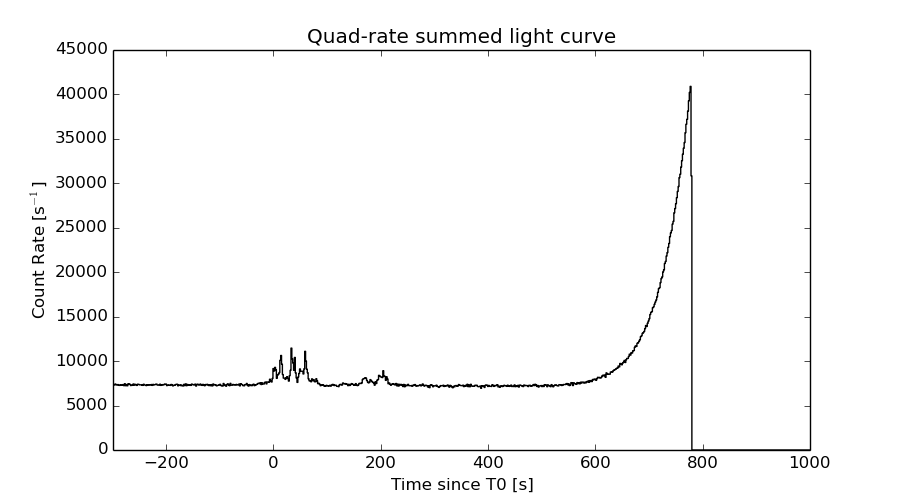
The mask-weighted light curves based on cleaned DPHs

Spectral Evolution

Spectra
Notes:
- 1) The fitting includes the systematic errors.
- 2) When the burst includes telescope slew time periods, the fitting uses an average response file made from multiple 5-s response files through out the slew time plus single time preiod for the non-slew times, and weighted by the total counts in the corresponding time period using addrmf. An average response file is needed becuase a spectral fit using the pre-slew DRM will introduce some errors in both a spectral shape and a normalization if the PHA file contains a lot of the slew/post-slew time interval.
- 3) For fits to more complicated models (e.g. a power-law over a cutoff power-law), the BAT team has decided to require a chi-square improvement of more than 6 for each extra dof.
Time averaged spectrum fit using the average DRM
Power-law model

Time interval is from  -86.260 sec. to  239.708 sec.

Spectral model in power-law:
------------------------------------------------------------
Parameters  : value       lower 90%   higher 90%
Photon index: 1.47710     ( -0.0525543   0.052583 )
Norm@50keV  : 2.34078E-03    ( -6.27817e-05   6.27612e-05 )
------------------------------------------------------------
#Fit statistic : Chi-Squared =          50.72 using 59 PHA bins.
# Reduced chi-squared =         0.8899 for     57 degrees of freedom
# Null hypothesis probability =   7.080570e-01

Photon flux (15-150 keV)    in 326 sec: 0.290459 ( -0.00842416  0.0084468 ) ph/cm2/s
Energy fluence (15-150 keV)             : 7.26703e-06 ( -2.10657e-07  2.1119e-07 ) ergs/cm2
Cutoff power-law model

Time interval is from  -86.260 sec. to  239.708 sec.
Spectral model in the cutoff power-law:
------------------------------------------------------------
Parameters  : value       lower 90%   higher 90%
Photon index: 1.38243     ( -0.209354   0.124614 )
Epeak [keV] : 347.451      ( -347.458 -347.458 )
Norm@50keV  : 2.59294E-03    ( -0.000299739   0.000638449 )
------------------------------------------------------------
#Fit statistic : Chi-Squared =          50.09 using 59 PHA bins.
# Reduced chi-squared =         0.8944 for     56 degrees of freedom
# Null hypothesis probability =   6.970847e-01

Photon flux (15-150 keV)    in 326 sec: 0.288316 ( -0.009474  0.009498 ) ph/cm2/s
Energy fluence (15-150 keV)             : 7.21246e-06 ( -2.44044e-07  2.42577e-07 ) ergs/cm2
Band function

Time interval is from  -86.260 sec. to  239.708 sec.

Spectral model in the Band function:
------------------------------------------------------------
Parameters  : value       lower 90%   higher 90%
alpha       : 0.757372   ( -2.01806   -0.755176 )
beta        : -1.51490    ( -0.0681511   0.0632757 )
Epeak [keV] : 32.9410      ( -8.77297 112.815 )
Norm@50keV   : 9.18280E-02    ( -0.090436   84.9994 )
------------------------------------------------------------
#Fit statistic : Chi-Squared =          47.32 using 59 PHA bins.
# Reduced chi-squared =         0.8604 for     55 degrees of freedom
# Null hypothesis probability =   7.595505e-01

Photon flux (15-150 keV)    in 326 sec:  (    ) ph/cm2/s
Energy fluence (15-150 keV)             : 0 ( 0  0 ) ergs/cm2
Single BB

Spectral model blackbody:
------------------------------------------------------------
Parameters  : value    Lower 90%  Upper 90%
kT [keV]    : 16.3070  (  )
R^2/D10^2   : 2.35768E-02  (   )
(R is the radius in km and D10 is the distance to the source in units of 10 kpc)
------------------------------------------------------------
#Fit statistic : Chi-Squared =         333.28 using 59 PHA bins.
# Reduced chi-squared =         5.8469 for     57 degrees of freedom
# Null hypothesis probability =   1.116945e-40

Energy  Fluence     90% Error
[keV]   [erg/cm2]   [erg/cm2]
15- 25  4.207e-07   2.412e-08
25- 50  1.799e-06   7.139e-08
50-150  3.368e-06   1.710e-07
15-150  5.588e-06   1.842e-07
Thermal bremsstrahlung (OTTB)

Spectral model: thermal bremsstrahlung
------------------------------------------------------------
Parameters  : value         Lower 90%    Upper 90%
kT [keV]    : 200.000       (      )
Norm        : 1.19016       (-0.0318495     0.0318489)
------------------------------------------------------------
#Fit statistic : Chi-Squared =          62.01 using 59 PHA bins.
# Reduced chi-squared =          1.088 for     57 degrees of freedom
# Null hypothesis probability =   3.022842e-01

Energy  Fluence     90% Error
[keV]   [erg/cm2]   [erg/cm2]
15- 25  9.663e-07   2.690e-08
25- 50  1.859e-06   5.444e-08
50-150  4.077e-06   1.157e-07
15-150  6.902e-06   1.956e-07
Double BB

Spectral model: bbodyrad<1> + bbodyrad<2>
------------------------------------------------------------
Parameters  : value         Lower 90%    Upper 90%
kT1 [keV]   : 7.54239        (-0.767577      0.837966)
R1^2/D10^2  : 0.226219        (-0.0659641      0.100885)
kT2 [keV]   : 29.1737        (-3.12427      4.37046)
R2^2/D10^2  : 2.58437E-03    (-0.000977432   0.0012742)
------------------------------------------------------------
#Fit statistic : Chi-Squared =          56.55 using 59 PHA bins.
# Reduced chi-squared =          1.028 for     55 degrees of freedom
# Null hypothesis probability =   4.168427e-01

Energy  Fluence     90% Error
[keV]   [erg/cm2]   [erg/cm2]
15- 25  8.377e-07   7.563e-08
25- 50  1.836e-06   1.058e-07
50-150  4.472e-06   3.668e-07
15-150  7.146e-06   4.906e-07
Peak spectrum fit
Power-law model

Time interval is from   33.160 sec. to   34.160 sec.

Spectral model in power-law:
------------------------------------------------------------
Parameters  : value       lower 90%   higher 90%
Photon index: 0.895547     ( -0.117749   0.115654 )
Norm@50keV  : 1.93111E-02    ( -0.00127135   0.00126788 )
------------------------------------------------------------
#Fit statistic : Chi-Squared =          63.87 using 59 PHA bins.
# Reduced chi-squared =          1.121 for     57 degrees of freedom
# Null hypothesis probability =   2.479031e-01

Photon flux (15-150 keV)    in 1 sec: 2.21640 ( -0.145957  0.146131 ) ph/cm2/s
Energy fluence (15-150 keV)             : 2.171e-07 ( -1.56688e-08  1.57588e-08 ) ergs/cm2
Cutoff power-law model

Time interval is from   33.160 sec. to   34.160 sec.
Spectral model in the cutoff power-law:
------------------------------------------------------------
Parameters  : value       lower 90%   higher 90%
Photon index: 0.889002     ( -0.482455   0.151718 )
Epeak [keV] : 9999.96      (   )
Norm@50keV  : 1.94396E-02    ( -0.00127591   0.00125391 )
------------------------------------------------------------
#Fit statistic : Chi-Squared =          63.86 using 59 PHA bins.
# Reduced chi-squared =          1.140 for     56 degrees of freedom
# Null hypothesis probability =   2.198620e-01

Photon flux (15-150 keV)    in 1 sec: 2.21153 ( -0.14943  0.14889 ) ph/cm2/s
Energy fluence (15-150 keV)             : 2.16665e-07 ( -1.6188e-08  8.13e-09 ) ergs/cm2
Band function
Time interval is from   33.160 sec. to   34.160 sec.

Spectral model in the Band function:
------------------------------------------------------------
Parameters  : value       lower 90%   higher 90%
alpha       : 5.00000   ( -5   -5 )
beta        : -0.896456    ( -0.115861   0.118252 )
Epeak [keV] : 17.2588      ( -17.2598 9981.45 )
Norm@50keV   : 1.02325E+04    ( -569.688   2.69576e+06 )
------------------------------------------------------------
#Fit statistic : Chi-Squared =          63.83 using 59 PHA bins.
# Reduced chi-squared =          1.161 for     55 degrees of freedom
# Null hypothesis probability =   1.938624e-01

Photon flux (15-150 keV)    in 1 sec:  (    ) ph/cm2/s
Energy fluence (15-150 keV)             : 0 ( 0  0 ) ergs/cm2
Single BB

Spectral model blackbody:
------------------------------------------------------------
Parameters  : value    Lower 90%  Upper 90%
kT [keV]    : 24.2087  (-2.26032  2.59898)
R^2/D10^2   : 6.03424E-02  (-0.0158264   0.0208053)
(R is the radius in km and D10 is the distance to the source in units of 10 kpc)
------------------------------------------------------------
#Fit statistic : Chi-Squared =         105.05 using 59 PHA bins.
# Reduced chi-squared =         1.8430 for     57 degrees of freedom
# Null hypothesis probability =   1.110356e-04

Energy  Fluence     90% Error
[keV]   [erg/cm2]   [erg/cm2]
15- 25  6.247e-09   8.735e-10
25- 50  3.485e-08   3.450e-09
50-150  1.521e-07   1.630e-08
15-150  1.932e-07   1.585e-08
Thermal bremsstrahlung (OTTB)

Spectral model: thermal bremsstrahlung
------------------------------------------------------------
Parameters  : value         Lower 90%    Upper 90%
kT [keV]    : 199.363       (      )
Norm        : 8.66214       (     )
------------------------------------------------------------
#Fit statistic : Chi-Squared =         147.14 using 59 PHA bins.
# Reduced chi-squared =         2.5815 for     57 degrees of freedom
# Null hypothesis probability =   6.638558e-10

Energy  Fluence     90% Error
[keV]   [erg/cm2]   [erg/cm2]
15- 25  2.157e-08   1.800e-09
25- 50  4.149e-08   5.670e-09
50-150  9.100e-08   3.365e-08
15-150  1.541e-07   2.745e-08
Double BB

Spectral model: bbodyrad<1> + bbodyrad<2>
------------------------------------------------------------
Parameters  : value         Lower 90%    Upper 90%
kT1 [keV]   : 7.94479        (-2.17714      2.97747)
R1^2/D10^2  : 0.963709        (-0.578898      1.83655)
kT2 [keV]   : 37.1373        (-7.10351      16.0728)
R2^2/D10^2  : 1.49954E-02    (-0.00956334   0.0137632)
------------------------------------------------------------
#Fit statistic : Chi-Squared =          63.99 using 59 PHA bins.
# Reduced chi-squared =          1.163 for     55 degrees of freedom
# Null hypothesis probability =   1.901849e-01

Energy  Fluence     90% Error
[keV]   [erg/cm2]   [erg/cm2]
15- 25  1.375e-08   5.258e-09
25- 50  3.767e-08   1.067e-08
50-150  1.679e-07   5.378e-08
15-150  2.193e-07   4.995e-08
Pre-slew spectrum (Pre-slew PHA with pre-slew DRM)
Power-law model

Spectral model in power-law:
------------------------------------------------------------
Parameters  : value       lower 90%   higher 90%
Photon index: 1.34400     ( -0.131787   0.13199 )
Norm@50keV  : 1.25708E-03    ( -9.82411e-05   9.80185e-05 )
------------------------------------------------------------
#Fit statistic : Chi-Squared =          65.00 using 59 PHA bins.
# Reduced chi-squared =          1.140 for     57 degrees of freedom
# Null hypothesis probability =   2.180615e-01

Photon flux (15-150 keV)    in 97.4 sec: 0.151257 ( -0.0117348  0.0117438 ) ph/cm2/s
Energy fluence (15-150 keV)             : 1.19746e-06 ( -1.05521e-07  1.06648e-07 ) ergs/cm2
Cutoff power-law model

Spectral model in the cutoff power-law:
------------------------------------------------------------
Parameters  : value       lower 90%   higher 90%
Photon index: 0.269632     ( -0.719853   0.618009 )
Epeak [keV] : 79.4104      ( -14.8749 42.0545 )
Norm@50keV  : 4.38819E-03    ( -0.00221512   0.0055412 )
------------------------------------------------------------
#Fit statistic : Chi-Squared =          55.32 using 59 PHA bins.
# Reduced chi-squared =         0.9879 for     56 degrees of freedom
# Null hypothesis probability =   5.004651e-01

Photon flux (15-150 keV)    in 97.4 sec: 0.143624 ( -0.012486  0.012482 ) ph/cm2/s
Energy fluence (15-150 keV)             : 1.08861e-06 ( -1.18838e-07  1.22023e-07 ) ergs/cm2
Band function

Spectral model in the Band function:
------------------------------------------------------------
Parameters  : value       lower 90%   higher 90%
alpha       : -0.272449   ( -0.594775   3.05436 )
beta        : -2.42372    ( 2.39006   0.854479 )
Epeak [keV] : 78.7415      ( -38.1641 41.542 )
Norm@50keV   : 4.40558E-03    ( -0.00259499   0.484001 )
------------------------------------------------------------
#Fit statistic : Chi-Squared =          55.13 using 59 PHA bins.
# Reduced chi-squared =          1.002 for     55 degrees of freedom
# Null hypothesis probability =   4.695755e-01

Photon flux (15-150 keV)    in 97.4 sec:  (    ) ph/cm2/s
Energy fluence (15-150 keV)             : 0 ( 0  0 ) ergs/cm2
S(25-50 keV) vs. S(50-100 keV) plot

S(25-50 keV)  = 1.78e-06
S(50-100 keV) = 2.55e-06
T90 vs. Hardness ratio plot

T90                                   = 213.927999973297 sec.
Hardness ratio (energy fluence ratio) = 1.43258
Color vs. Color plot

Count Ratio  (25-50 keV) / (15-25 keV) = 1.38479
Count Ratio (50-100 keV) / (15-25 keV) = 1.04707
Mask shadow pattern

IMX = -8.755345310674198E-02, IMY = 1.530911219523165E-01
TIME vs. PHA plot around the trigger time

Blue+Cyan dotted lines: Time interval of the scaled map
From 0.000000 to 0.512000
TIME vs. DetID plot around the trigger time

Blue+Cyan dotted lines: Time interval of the scaled map
From 0.000000 to 0.512000
100 us light curve (15-350 keV)

Blue+Cyan dotted lines: Time interval of the scaled map
From 0.000000 to 0.512000
Spacecraft aspect plot

Bright source in the pre-burst/pre-slew/post-slew images
Pre-burst image of 15-350 keV band
Time interval of the image:
-239.960000 -86.260000

# RAcent  DECcent POSerr Theta    Phi  PeakCts   SNR AngSep     Name
#  [deg]    [deg]    ['] [deg]  [deg]                   [']
299.6151  35.1837    2.9  50.5  -15.6   1.2204   4.0    1.6	Cyg X-1
308.0714  40.9569    2.5  45.5   -5.8   1.1753   4.5    1.8	Cyg X-3
325.9567  38.2886    3.3  32.2    1.3   0.5810   3.5   10.3	Cyg X-2
348.9831  52.7371    2.7  37.3   38.4   1.2027   4.2 ------	UNKNOWN
328.6939  42.2884    3.3  33.4    9.3   0.5694   3.5 ------	UNKNOWN
335.1062 -10.7007    2.2  31.0 -105.4   1.0631   5.4 ------	UNKNOWN
Pre-slew background subtracted image of 15-350 keV band
Time interval of the image:
-86.260000 11.140600

# RAcent  DECcent POSerr Theta    Phi  PeakCts   SNR AngSep     Name
#  [deg]    [deg]    ['] [deg]  [deg]                   [']
299.7099  35.2580   12.1  50.4  -15.5  -0.2715  -1.0    6.8	Cyg X-1
308.1128  41.0725    9.3  45.6   -5.7  -0.2933  -1.2    7.2	Cyg X-3
326.2206  38.4512    8.3  32.2    1.7   0.2031   1.4    8.1	Cyg X-2
348.5832   5.9862    0.6  10.0 -119.8   2.0387  18.6 ------	UNKNOWN
303.2187  33.3498    2.8  47.3  -17.4   1.0317   4.1 ------	UNKNOWN
359.2273 -32.1079    2.4  48.1 -147.2   1.3332   4.8 ------	UNKNOWN
325.4373 -15.7449    1.8  40.7  -97.7   3.1098   6.6 ------	UNKNOWN
Post-slew image of 15-350 keV band
Time interval of the image:
45.740610 722.076800
780.040000 842.200000

# RAcent  DECcent POSerr Theta    Phi  PeakCts   SNR AngSep     Name
#  [deg]    [deg]    ['] [deg]  [deg]                   [']
299.5482  35.1798    3.1  53.6  -18.8   3.4177   3.7    2.4	Cyg X-1
308.1667  40.9602    3.2  50.2   -8.4   3.0321   3.6    2.6	Cyg X-3
326.3099  38.3358    3.8  38.1    2.4   1.6044   3.1    6.6	Cyg X-2
348.5803   5.9845    0.5   0.0  156.3   6.8794  21.5 ------	UNKNOWN
335.4330  -0.8778    3.1  14.8  -86.0   1.1469   3.7 ------	UNKNOWN
 14.8857 -47.9707    3.4  58.7 -169.1   6.8478   3.4 ------	UNKNOWN
341.2761 -47.0038    2.8  53.4 -142.6   8.7452   4.1 ------	UNKNOWN
311.0722 -11.0903    3.0  41.0  -83.3   6.2568   3.8 ------	UNKNOWN
Plot creation:
Sat May 30 23:08:45 EDT 2015