Special notes of this burst
Image
Pre-slew 15.0-350.0 keV image (Event data)

#   RAcent    DECcent   POSerr    Theta     Phi              Peak Cts       SNR   Name
  193.8758    28.0983   0.0150    41.8420   166.5338         0.8845074     12.781 TRIG_00443861

Foreground time interval of the image:
 -2.536  14.020 (delta_t =  16.556 [sec])
Background time interval of the image:
-239.616  -2.536 (delta_t = 237.080 [sec])
Lightcurves
Notes:
- 1) The mask-weighted light curves are using the flight position.
- 2) Multiple plots of different time binning/intervals are shown to cover all scenarios of short/long GRBs, rate/image triggers, and real/false positives.
- 3) For all the mask-weighted lightcurves, the y-axis units are counts/sec/det where a det is 0.4 x 0.4 = 0.16 sq cm.
- 4) The verticle lines correspond to following: green dotted lines are T50 interval, black dotted lines are T90 interval, blue solid line(s) is a spacecraft slew start time, and orange solid line(s) is a spacecraft slew end time.
- 5) Time of each bin is in the middle of the bin.
1 s binning
From T0-310 s to T0+310 s

From T100_start - 20 s to T100_end + 30 s

Full time interval

64 ms binning
Full time interval
From T100_start to T100_end

From T0-5 sec to T0+5 sec

16 ms binning
From T100_start-5 s to T100_start+5 s

Blue+Cyan dotted lines: Time interval of the scaled map
From 0.000000 to 8.192000
8 ms binning
From T100_start-3 s to T100_start+3 s

Blue+Cyan dotted lines: Time interval of the scaled map
From 0.000000 to 8.192000
2 ms binning
From T100_start-1 s to T100_start+1 s

Blue+Cyan dotted lines: Time interval of the scaled map
From 0.000000 to 8.192000
SN=5 or 10 sec. binning (whichever binning is satisfied first)

SN=5 or 10 sec. binning (T < 200 sec)

Quad-rate summed light curves (from T0-300s to T0+1000s)
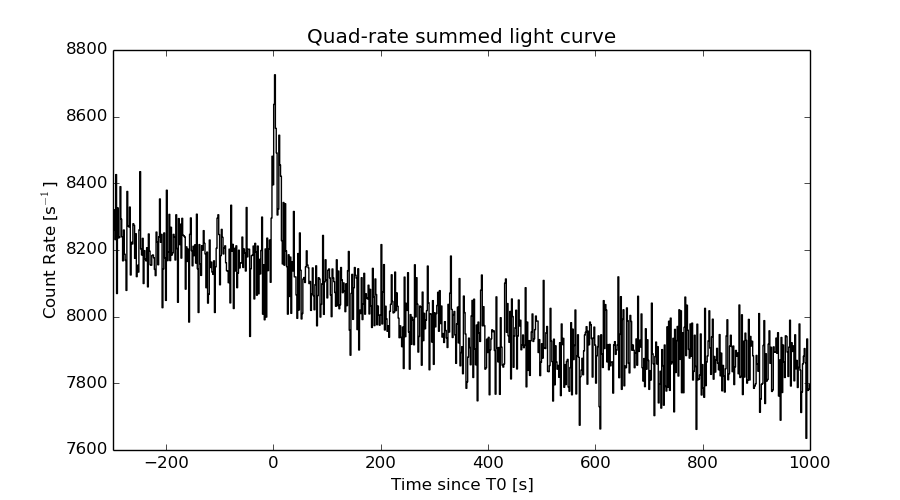
The mask-weighted light curves based on cleaned DPHs

Spectral Evolution

Spectra
Notes:
- 1) The fitting includes the systematic errors.
- 2) When the burst includes telescope slew time periods, the fitting uses an average response file made from multiple 5-s response files through out the slew time plus single time preiod for the non-slew times, and weighted by the total counts in the corresponding time period using addrmf. An average response file is needed becuase a spectral fit using the pre-slew DRM will introduce some errors in both a spectral shape and a normalization if the PHA file contains a lot of the slew/post-slew time interval.
- 3) For fits to more complicated models (e.g. a power-law over a cutoff power-law), the BAT team has decided to require a chi-square improvement of more than 6 for each extra dof.
Time averaged spectrum fit using the average DRM
Power-law model
Time interval is from   -2.536 sec. to   14.020 sec.

Spectral model in power-law:
------------------------------------------------------------
Parameters  : value       lower 90%   higher 90%
Photon index: 1.06018     ( -0.253343   0.24043 )
Norm@50keV  : 3.29543E-03    ( -0.000462276   0.000457476 )
------------------------------------------------------------
#Fit statistic : Chi-Squared =          50.64 using 59 PHA bins.
# Reduced chi-squared =         0.8884 for     57 degrees of freedom
# Null hypothesis probability =   7.110122e-01

Photon flux (15-150 keV)    in 16.56 sec: 0.380926 ( -0.0552738  0.0556265 ) ph/cm2/s
Energy fluence (15-150 keV)             : 5.78028e-07 ( -8.18498e-08  8.22953e-08 ) ergs/cm2
Cutoff power-law model
Time interval is from   -2.536 sec. to   14.020 sec.
Spectral model in the cutoff power-law:
------------------------------------------------------------
Parameters  : value       lower 90%   higher 90%
Photon index: 2.42829     ( -1.02195   0.2833 )
Epeak [keV] : 135.432      ( -999.746 -999.746 )
Norm@50keV  : 2.37551E-04    (     )
------------------------------------------------------------
#Fit statistic : Chi-Squared =          49.73 using 59 PHA bins.
# Reduced chi-squared =         0.8881 for     56 degrees of freedom
# Null hypothesis probability =   7.096093e-01

Photon flux (15-150 keV)    in 16.56 sec: 0.380816 ( -0.057313  0.055603 ) ph/cm2/s
Energy fluence (15-150 keV)             : 5.76778e-07 ( -8.51018e-08  8.33879e-08 ) ergs/cm2
Band function

Time interval is from   -2.536 sec. to   14.020 sec.

Spectral model in the Band function:
------------------------------------------------------------
Parameters  : value       lower 90%   higher 90%
alpha       : 0.229155   ( 0.182809   0.182809 )
beta        : -1.21162    ( 1.19632   0.358157 )
Epeak [keV] : 69.5125      ( -68.4041 224.606 )
Norm@50keV   : 1.74056E-02    ( -0.0187357   34.8407 )
------------------------------------------------------------
#Fit statistic : Chi-Squared =          49.98 using 59 PHA bins.
# Reduced chi-squared =         0.9087 for     55 degrees of freedom
# Null hypothesis probability =   6.664842e-01

Photon flux (15-150 keV)    in 16.56 sec:  (    ) ph/cm2/s
Energy fluence (15-150 keV)             : 0 ( 0  0 ) ergs/cm2
Single BB
Spectral model blackbody:
------------------------------------------------------------
Parameters  : value    Lower 90%  Upper 90%
kT [keV]    : 21.3360  (-3.89749  5.29916)
R^2/D10^2   : 1.45367E-02  (-0.00739243   0.0136891)
(R is the radius in km and D10 is the distance to the source in units of 10 kpc)
------------------------------------------------------------
#Fit statistic : Chi-Squared =          61.57 using 59 PHA bins.
# Reduced chi-squared =          1.080 for     57 degrees of freedom
# Null hypothesis probability =   3.158571e-01

Energy  Fluence     90% Error
[keV]   [erg/cm2]   [erg/cm2]
15- 25  2.056e-08   6.148e-09
25- 50  1.067e-07   2.629e-08
50-150  3.625e-07   9.555e-08
15-150  4.898e-07   9.845e-08
Thermal bremsstrahlung (OTTB)
Spectral model: thermal bremsstrahlung
------------------------------------------------------------
Parameters  : value         Lower 90%    Upper 90%
kT [keV]    : 200.000       (      )
Norm        : 1.62025       (-0.227292     0.22726)
------------------------------------------------------------
#Fit statistic : Chi-Squared =          62.48 using 59 PHA bins.
# Reduced chi-squared =          1.096 for     57 degrees of freedom
# Null hypothesis probability =   2.877349e-01

Energy  Fluence     90% Error
[keV]   [erg/cm2]   [erg/cm2]
15- 25  6.684e-08   3.823e-08
25- 50  1.286e-07   7.135e-08
50-150  2.820e-07   1.581e-07
15-150  4.774e-07   2.704e-07
Double BB
Spectral model: bbodyrad<1> + bbodyrad<2>
------------------------------------------------------------
Parameters  : value         Lower 90%    Upper 90%
kT1 [keV]   : 11.4740        (-3.78681      4.09326)
R1^2/D10^2  : 7.65174E-02        (-0.0390055      0.120227)
kT2 [keV]   : 65.6017        (-63.2898      -97.2689)
R2^2/D10^2  : 4.32079E-04    (-0.000140523   0.00285119)
------------------------------------------------------------
#Fit statistic : Chi-Squared =          48.45 using 59 PHA bins.
# Reduced chi-squared =         0.8810 for     55 degrees of freedom
# Null hypothesis probability =   7.212307e-01

Energy  Fluence     90% Error
[keV]   [erg/cm2]   [erg/cm2]
15- 25  3.781e-08   2.232e-08
25- 50  1.253e-07   7.047e-08
50-150  3.968e-07   2.135e-07
15-150  5.598e-07   2.908e-07
Peak spectrum fit
Power-law model

Time interval is from    3.576 sec. to    4.576 sec.

Spectral model in power-law:
------------------------------------------------------------
Parameters  : value       lower 90%   higher 90%
Photon index: 1.23935     ( -0.489686   0.472291 )
Norm@50keV  : 6.40771E-03    ( -0.00186579   0.00186426 )
------------------------------------------------------------
#Fit statistic : Chi-Squared =          56.60 using 59 PHA bins.
# Reduced chi-squared =         0.9930 for     57 degrees of freedom
# Null hypothesis probability =   4.899129e-01

Photon flux (15-150 keV)    in 1 sec: 0.756587 ( -0.227937  0.230702 ) ph/cm2/s
Energy fluence (15-150 keV)             : 6.43066e-08 ( -1.97794e-08  2.00788e-08 ) ergs/cm2
Cutoff power-law model
Time interval is from    3.576 sec. to    4.576 sec.
Spectral model in the cutoff power-law:
------------------------------------------------------------
Parameters  : value       lower 90%   higher 90%
Photon index: 5.50251E-02     ( -2.90969   1.52166 )
Epeak [keV] : 92.0753      (   )
Norm@50keV  : 2.21075E-02    (     )
------------------------------------------------------------
#Fit statistic : Chi-Squared =          55.37 using 59 PHA bins.
# Reduced chi-squared =         0.9887 for     56 degrees of freedom
# Null hypothesis probability =   4.986681e-01

Photon flux (15-150 keV)    in 1 sec: 0.722948 ( -0.233199  0.236207 ) ph/cm2/s
Energy fluence (15-150 keV)             : 6.14719e-08 ( -2.01762e-08  2.07694e-08 ) ergs/cm2
Band function
Time interval is from    3.576 sec. to    4.576 sec.

Spectral model in the Band function:
------------------------------------------------------------
Parameters  : value       lower 90%   higher 90%
alpha       : -0.135822   ( -0.979319   3.39287 )
beta        : -10.00000    ( 10   20 )
Epeak [keV] : 93.3799      ( -36.1362 555.087 )
Norm@50keV   : 2.07226E-02    ( -0.0207226   0.00614509 )
------------------------------------------------------------
#Fit statistic : Chi-Squared =          55.37 using 59 PHA bins.
# Reduced chi-squared =          1.007 for     55 degrees of freedom
# Null hypothesis probability =   4.604855e-01

Photon flux (15-150 keV)    in 1 sec: 0.740915 (    ) ph/cm2/s
Energy fluence (15-150 keV)             : 6.34294e-08 ( 0  0 ) ergs/cm2
Single BB
Spectral model blackbody:
------------------------------------------------------------
Parameters  : value    Lower 90%  Upper 90%
kT [keV]    : 19.8275  (-5.70224  8.38582)
R^2/D10^2   : 3.70361E-02  (-0.0370361   0.0775653)
(R is the radius in km and D10 is the distance to the source in units of 10 kpc)
------------------------------------------------------------
#Fit statistic : Chi-Squared =          56.27 using 59 PHA bins.
# Reduced chi-squared =         0.9872 for     57 degrees of freedom
# Null hypothesis probability =   5.025104e-01

Energy  Fluence     90% Error
[keV]   [erg/cm2]   [erg/cm2]
15- 25  2.816e-09   1.817e-09
25- 50  1.395e-08   8.680e-09
50-150  4.060e-08   2.602e-08
15-150  5.736e-08   3.512e-08
Thermal bremsstrahlung (OTTB)

Spectral model: thermal bremsstrahlung
------------------------------------------------------------
Parameters  : value         Lower 90%    Upper 90%
kT [keV]    : 199.363       (-105.259      -199.363)
Norm        : 3.19225       (-0.939609     0.939609)
------------------------------------------------------------
#Fit statistic : Chi-Squared =          57.37 using 59 PHA bins.
# Reduced chi-squared =          1.006 for     57 degrees of freedom
# Null hypothesis probability =   4.614860e-01

Energy  Fluence     90% Error
[keV]   [erg/cm2]   [erg/cm2]
15- 25  7.949e-09   4.760e-09
25- 50  1.529e-08   9.605e-09
50-150  3.354e-08   1.978e-08
15-150  5.678e-08   3.365e-08
Double BB
Spectral model: bbodyrad<1> + bbodyrad<2>
------------------------------------------------------------
Parameters  : value         Lower 90%    Upper 90%
kT1 [keV]   : 6.85794        (-6.80659      19.5951)
R1^2/D10^2  : 0.562864        (-0.591059      -0.591059)
kT2 [keV]   : 24.7011        (-24.6742      -24.6742)
R2^2/D10^2  : 1.53474E-02    (-0.015461   0.055734)
------------------------------------------------------------
#Fit statistic : Chi-Squared =          54.50 using 59 PHA bins.
# Reduced chi-squared =         0.9910 for     55 degrees of freedom
# Null hypothesis probability =   4.935259e-01

Energy  Fluence     90% Error
[keV]   [erg/cm2]   [erg/cm2]
15- 25  5.798e-09   3.422e-09
25- 50  1.470e-08   8.115e-09
50-150  4.267e-08   2.770e-08
15-150  6.317e-08   3.337e-08
Pre-slew spectrum (Pre-slew PHA with pre-slew DRM)
Power-law model

Spectral model in power-law:
------------------------------------------------------------
Parameters  : value       lower 90%   higher 90%
Photon index: 1.06018     ( -0.253343   0.24043 )
Norm@50keV  : 3.29543E-03    ( -0.000462276   0.000457476 )
------------------------------------------------------------
#Fit statistic : Chi-Squared =          50.64 using 59 PHA bins.
# Reduced chi-squared =         0.8884 for     57 degrees of freedom
# Null hypothesis probability =   7.110122e-01

Photon flux (15-150 keV)    in 16.56 sec: 0.380926 ( -0.0552738  0.0556265 ) ph/cm2/s
Energy fluence (15-150 keV)             : 5.78028e-07 ( -8.18498e-08  8.22953e-08 ) ergs/cm2
Cutoff power-law model

Spectral model in the cutoff power-law:
------------------------------------------------------------
Parameters  : value       lower 90%   higher 90%
Photon index: 2.42829     ( -1.02195   0.2833 )
Epeak [keV] : 135.432      ( -999.746 -999.746 )
Norm@50keV  : 2.37551E-04    (     )
------------------------------------------------------------
#Fit statistic : Chi-Squared =          49.73 using 59 PHA bins.
# Reduced chi-squared =         0.8881 for     56 degrees of freedom
# Null hypothesis probability =   7.096093e-01

Photon flux (15-150 keV)    in 16.56 sec: 0.380816 ( -0.057313  0.055603 ) ph/cm2/s
Energy fluence (15-150 keV)             : 5.76778e-07 ( -8.51018e-08  8.33879e-08 ) ergs/cm2
Band function
Spectral model in the Band function:
------------------------------------------------------------
Parameters  : value       lower 90%   higher 90%
alpha       : 0.229155   ( 0.182809   0.182809 )
beta        : -1.21162    ( 1.19632   0.358157 )
Epeak [keV] : 69.5125      ( -68.4041 222.663 )
Norm@50keV   : 1.74056E-02    ( -0.0187357   33.6001 )
------------------------------------------------------------
#Fit statistic : Chi-Squared =          49.98 using 59 PHA bins.
# Reduced chi-squared =         0.9087 for     55 degrees of freedom
# Null hypothesis probability =   6.664842e-01

Photon flux (15-150 keV)    in 16.56 sec:  (    ) ph/cm2/s
Energy fluence (15-150 keV)             : 0 ( 0  0 ) ergs/cm2
S(25-50 keV) vs. S(50-100 keV) plot
S(25-50 keV)  = 1.11e-07
S(50-100 keV) = 2.14e-07
T90 vs. Hardness ratio plot
T90                                   = 14.1519999504089 sec.
Hardness ratio (energy fluence ratio) = 1.92793
Color vs. Color plot

Count Ratio  (25-50 keV) / (15-25 keV) = 2.38564
Count Ratio (50-100 keV) / (15-25 keV) = 2.16583
Mask shadow pattern
IMX = -8.708069617040499E-01, IMY = -2.085195981618592E-01
TIME vs. PHA plot around the trigger time

Blue+Cyan dotted lines: Time interval of the scaled map
From 0.000000 to 8.192000
TIME vs. DetID plot around the trigger time
Blue+Cyan dotted lines: Time interval of the scaled map
From 0.000000 to 8.192000
100 us light curve (15-350 keV)

Blue+Cyan dotted lines: Time interval of the scaled map
From 0.000000 to 8.192000
Spacecraft aspect plot
Bright source in the pre-burst/pre-slew/post-slew images
Pre-burst image of 15-350 keV band
Time interval of the image:
-239.616000 -2.536000

# RAcent  DECcent POSerr Theta    Phi  PeakCts   SNR AngSep     Name
#  [deg]    [deg]    ['] [deg]  [deg]                   [']
135.6422 -40.6276    4.4  45.8   -5.5   0.8761   2.6    6.8	Vela X-1
128.5839 -12.1898    2.3  42.4   36.6   1.8703   5.1 ------	UNKNOWN
206.2084  24.8471    2.7  47.0 -178.7   1.3554   4.4 ------	UNKNOWN
197.5743 -37.3933    3.5  38.0  -78.4   1.7310   3.4 ------	UNKNOWN
Pre-slew background subtracted image of 15-350 keV band
Time interval of the image:
-2.536000 14.020000

# RAcent  DECcent POSerr Theta    Phi  PeakCts   SNR AngSep     Name
#  [deg]    [deg]    ['] [deg]  [deg]                   [']
135.4348 -40.4739   12.3  45.8   -5.2   0.0694   0.9    6.5	Vela X-1
182.6479  42.2951    2.2  51.0  146.9   1.0419   5.4 ------	UNKNOWN
193.8758  28.0983    0.9  41.8  166.5   0.8846  12.8 ------	UNKNOWN
188.2429  10.3335    2.1  24.6  179.3   0.2313   5.6 ------	UNKNOWN
Post-slew image of 15-350 keV band
Time interval of the image:
123.684600 962.455800

# RAcent  DECcent POSerr Theta    Phi  PeakCts   SNR AngSep     Name
#  [deg]    [deg]    ['] [deg]  [deg]                   [']
173.6944  42.3303    2.9  21.7  131.3   1.7493   4.0 ------	UNKNOWN
184.9374  17.5979    2.7  13.3   34.9   1.5952   4.2 ------	UNKNOWN
184.6450 -28.1073    3.3  56.9    4.6   7.8236   3.5 ------	UNKNOWN
192.1187  53.3117    3.1  25.3  172.4   1.5920   3.7 ------	UNKNOWN
243.5305  59.2755    3.7  45.9 -152.3   2.9210   3.2 ------	UNKNOWN
223.6670  27.0307    3.7  26.4  -99.9   1.6868   3.1 ------	UNKNOWN
Plot creation:
Sat May 30 23:07:13 EDT 2015