Special notes of this burst
Image
Pre-slew 15.0-350.0 keV image (Event data)
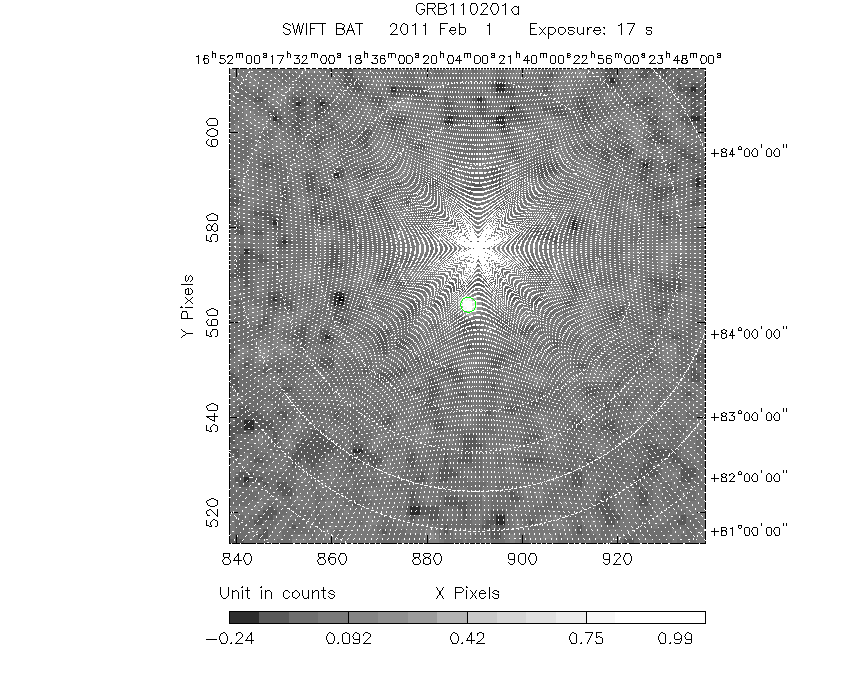
#   RAcent    DECcent   POSerr    Theta     Phi              Peak Cts       SNR   Name
  137.5019    88.6106   0.0095    10.4304   -95.9331         1.1819378     20.210 TRIG_00444230

Foreground time interval of the image:
 -2.848  14.432 (delta_t =  17.280 [sec])
Background time interval of the image:
-12.819  -2.848 (delta_t =   9.971 [sec])
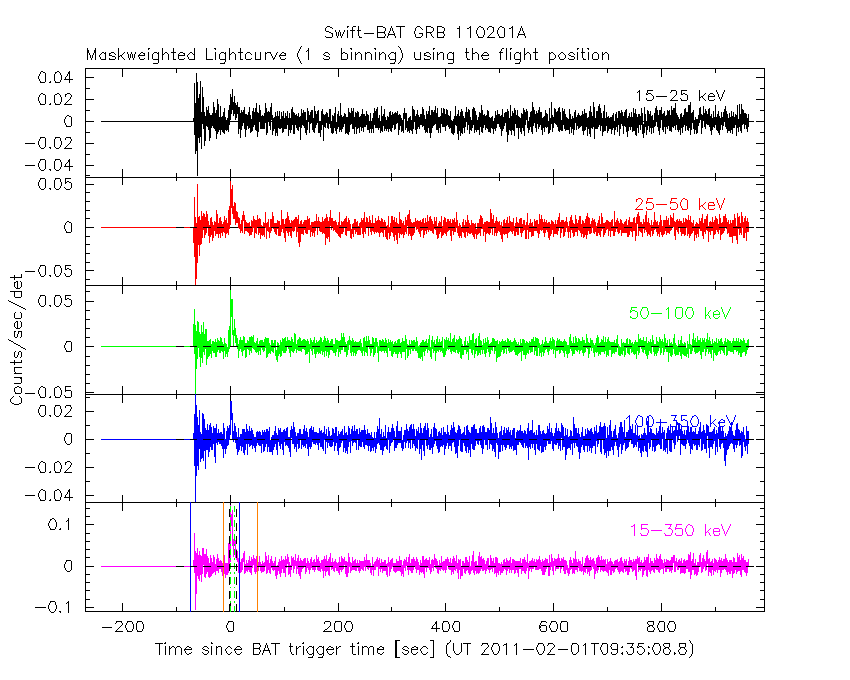
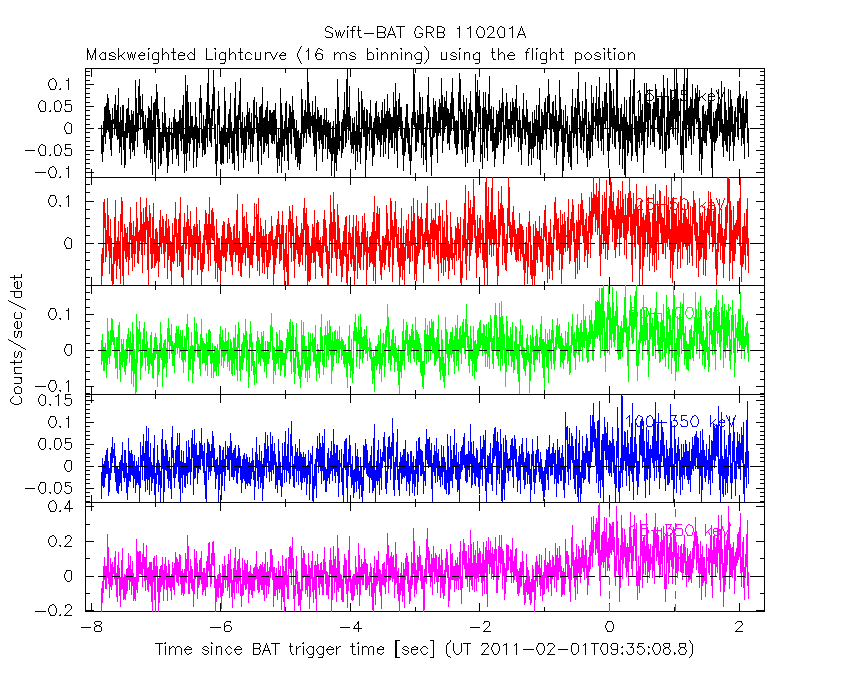
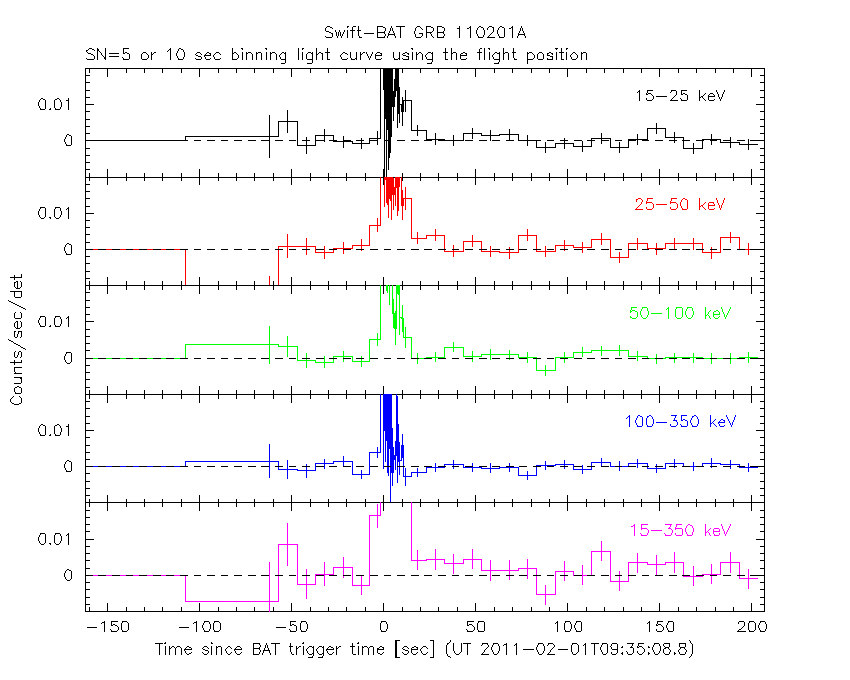
Lightcurves
Notes:
- 1) The mask-weighted light curves are using the flight position.
- 2) Multiple plots of different time binning/intervals are shown to cover all scenarios of short/long GRBs, rate/image triggers, and real/false positives.
- 3) For all the mask-weighted lightcurves, the y-axis units are counts/sec/det where a det is 0.4 x 0.4 = 0.16 sq cm.
- 4) The verticle lines correspond to following: green dotted lines are T50 interval, black dotted lines are T90 interval, blue solid line(s) is a spacecraft slew start time, and orange solid line(s) is a spacecraft slew end time.
- 5) Time of each bin is in the middle of the bin.
1 s binning
From T0-310 s to T0+310 s

From T100_start - 20 s to T100_end + 30 s

Full time interval
64 ms binning
Full time interval
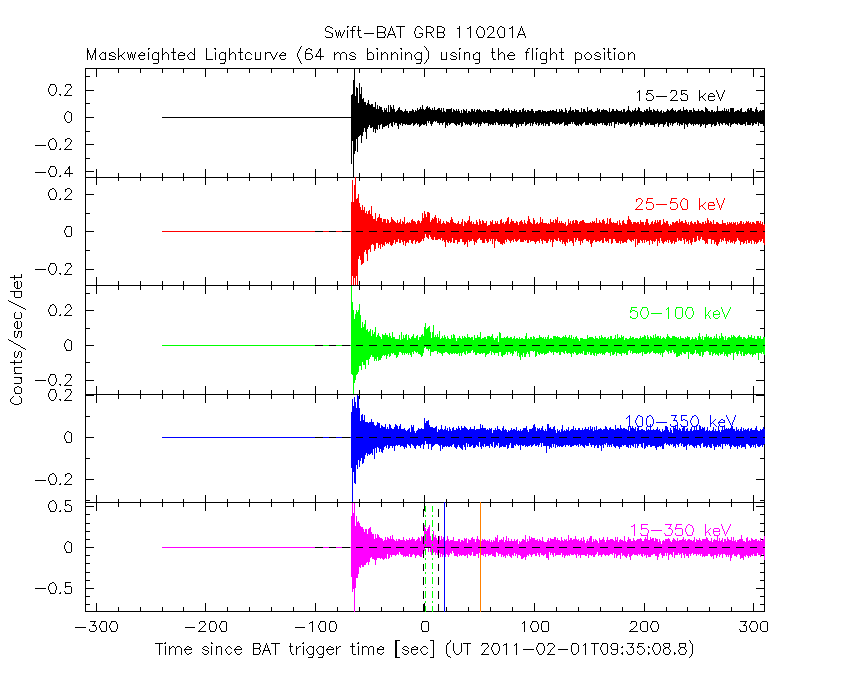
From T100_start to T100_end

From T0-5 sec to T0+5 sec

16 ms binning
From T100_start-5 s to T100_start+5 s
Blue+Cyan dotted lines: Time interval of the scaled map
From 0.000000 to 1.024000
8 ms binning
From T100_start-3 s to T100_start+3 s

Blue+Cyan dotted lines: Time interval of the scaled map
From 0.000000 to 1.024000
2 ms binning
From T100_start-1 s to T100_start+1 s

Blue+Cyan dotted lines: Time interval of the scaled map
From 0.000000 to 1.024000
SN=5 or 10 sec. binning (whichever binning is satisfied first)

SN=5 or 10 sec. binning (T < 200 sec)
Quad-rate summed light curves (from T0-300s to T0+1000s)

The mask-weighted light curves based on cleaned DPHs

Spectral Evolution

Spectra
Notes:
- 1) The fitting includes the systematic errors.
- 2) When the burst includes telescope slew time periods, the fitting uses an average response file made from multiple 5-s response files through out the slew time plus single time preiod for the non-slew times, and weighted by the total counts in the corresponding time period using addrmf. An average response file is needed becuase a spectral fit using the pre-slew DRM will introduce some errors in both a spectral shape and a normalization if the PHA file contains a lot of the slew/post-slew time interval.
- 3) For fits to more complicated models (e.g. a power-law over a cutoff power-law), the BAT team has decided to require a chi-square improvement of more than 6 for each extra dof.
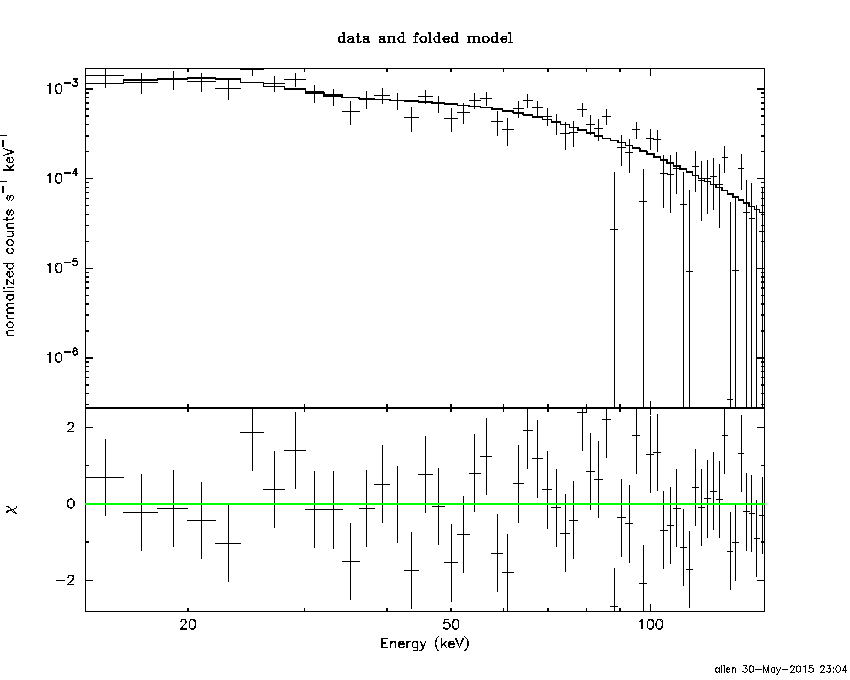
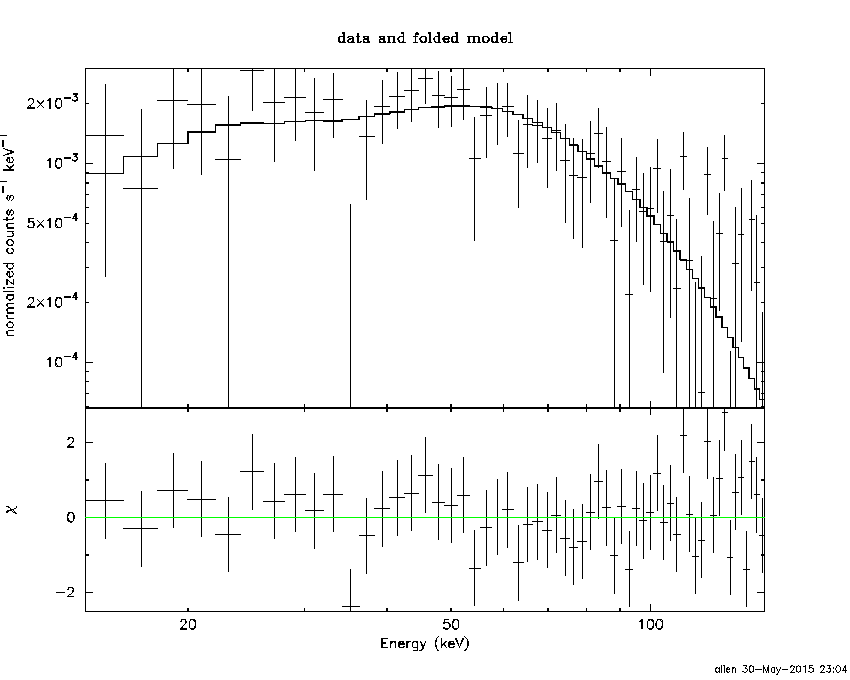
Time averaged spectrum fit using the average DRM
Power-law model

Time interval is from   -2.848 sec. to   14.432 sec.

Spectral model in power-law:
------------------------------------------------------------
Parameters  : value       lower 90%   higher 90%
Photon index: 1.11628     ( -0.108193   0.107175 )
Norm@50keV  : 3.97003E-03    ( -0.000233239   0.000233159 )
------------------------------------------------------------
#Fit statistic : Chi-Squared =          74.97 using 59 PHA bins.
# Reduced chi-squared =          1.315 for     57 degrees of freedom
# Null hypothesis probability =   5.545721e-02

Photon flux (15-150 keV)    in 17.28 sec: 0.461252 ( -0.0278339  0.0278666 ) ph/cm2/s
Energy fluence (15-150 keV)             : 7.13571e-07 ( -4.7037e-08  4.7284e-08 ) ergs/cm2
Cutoff power-law model

Time interval is from   -2.848 sec. to   14.432 sec.
Spectral model in the cutoff power-law:
------------------------------------------------------------
Parameters  : value       lower 90%   higher 90%
Photon index: 0.941886     ( -0.430638   0.225283 )
Epeak [keV] : 339.055      ( -339.055 -339.055 )
Norm@50keV  : 4.76767E-03    ( -0.000982113   0.00259703 )
------------------------------------------------------------
#Fit statistic : Chi-Squared =          74.42 using 59 PHA bins.
# Reduced chi-squared =          1.329 for     56 degrees of freedom
# Null hypothesis probability =   5.041820e-02

Photon flux (15-150 keV)    in 17.28 sec: 0.457106 ( -0.029368  0.029306 ) ph/cm2/s
Energy fluence (15-150 keV)             : 7.06128e-07 ( -5.076e-08  4.96472e-08 ) ergs/cm2
Band function
Time interval is from   -2.848 sec. to   14.432 sec.

Spectral model in the Band function:
------------------------------------------------------------
Parameters  : value       lower 90%   higher 90%
alpha       : -0.942799   ( 0.897327   0.897327 )
beta        : -10.0000    ( 10   3.55271e-15 )
Epeak [keV] : 339.164      ( -188.948 -339.296 )
Norm@50keV   : 4.76642E-03    ( -0.000561275   0.00259873 )
------------------------------------------------------------
#Fit statistic : Chi-Squared =          74.42 using 59 PHA bins.
# Reduced chi-squared =          1.353 for     55 degrees of freedom
# Null hypothesis probability =   4.167724e-02

Photon flux (15-150 keV)    in 17.28 sec:  (    ) ph/cm2/s
Energy fluence (15-150 keV)             : 0 ( 0  0 ) ergs/cm2
Single BB

Spectral model blackbody:
------------------------------------------------------------
Parameters  : value    Lower 90%  Upper 90%
kT [keV]    : 20.7204  (  )
R^2/D10^2   : 1.91092E-02  (   )
(R is the radius in km and D10 is the distance to the source in units of 10 kpc)
------------------------------------------------------------
#Fit statistic : Chi-Squared =         124.71 using 59 PHA bins.
# Reduced chi-squared =         2.1880 for     57 degrees of freedom
# Null hypothesis probability =   5.795394e-07

Energy  Fluence     90% Error
[keV]   [erg/cm2]   [erg/cm2]
15- 25  2.694e-08   3.309e-09
25- 50  1.373e-07   1.284e-08
50-150  4.388e-07   4.588e-08
15-150  6.030e-07   4.545e-08
Thermal bremsstrahlung (OTTB)
Spectral model: thermal bremsstrahlung
------------------------------------------------------------
Parameters  : value         Lower 90%    Upper 90%
kT [keV]    : 199.363       (      )
Norm        : 1.89342       (     )
------------------------------------------------------------
#Fit statistic : Chi-Squared =         119.58 using 59 PHA bins.
# Reduced chi-squared =         2.0978 for     57 degrees of freedom
# Null hypothesis probability =   2.453790e-06

Energy  Fluence     90% Error
[keV]   [erg/cm2]   [erg/cm2]
15- 25  8.147e-08   5.547e-09
25- 50  1.567e-07   1.362e-08
50-150  3.437e-07   8.113e-08
15-150  5.819e-07   9.806e-08
Double BB

Spectral model: bbodyrad<1> + bbodyrad<2>
------------------------------------------------------------
Parameters  : value         Lower 90%    Upper 90%
kT1 [keV]   : 6.58965        (-1.37376      1.71782)
R1^2/D10^2  : 0.423727        (-0.229776      0.581836)
kT2 [keV]   : 29.3673        (-4.00548      6.14625)
R2^2/D10^2  : 5.61027E-03    (-0.00255104   0.00347463)
------------------------------------------------------------
#Fit statistic : Chi-Squared =          71.71 using 59 PHA bins.
# Reduced chi-squared =          1.304 for     55 degrees of freedom
# Null hypothesis probability =   6.452444e-02

Energy  Fluence     90% Error
[keV]   [erg/cm2]   [erg/cm2]
15- 25  6.102e-08   2.377e-08
25- 50  1.390e-07   3.264e-08
50-150  5.053e-07   8.243e-08
15-150  7.053e-07   1.286e-07
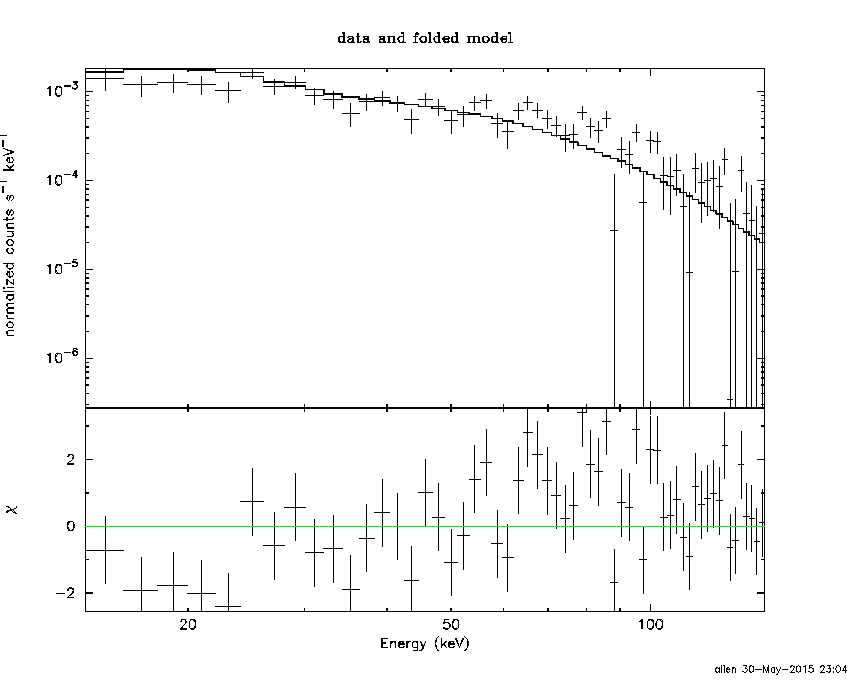
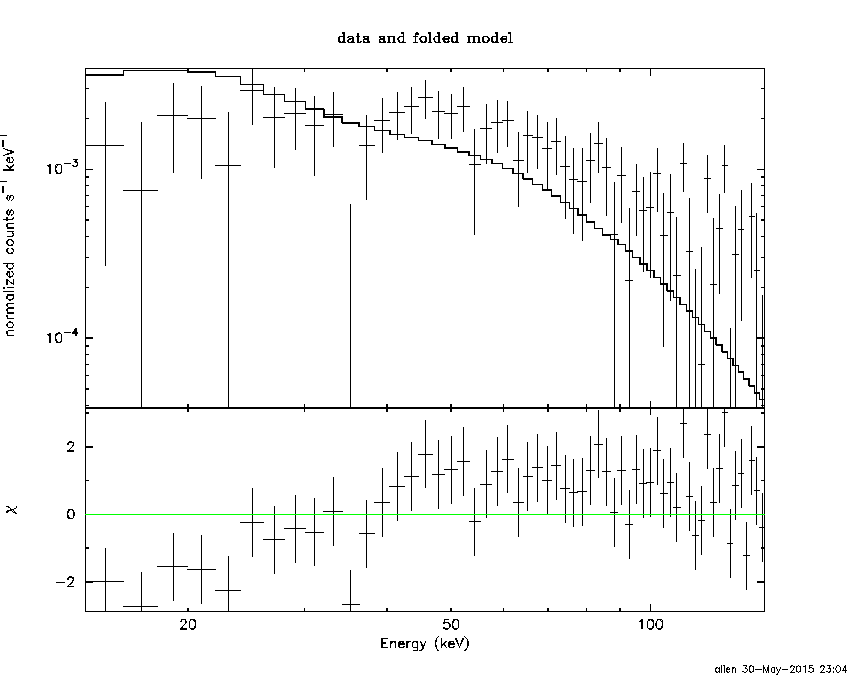
Peak spectrum fit
Power-law model

Time interval is from   -0.284 sec. to    0.716 sec.

Spectral model in power-law:
------------------------------------------------------------
Parameters  : value       lower 90%   higher 90%
Photon index: 0.674177     ( -0.200266   0.189234 )
Norm@50keV  : 9.47103E-03    ( -0.00111782   0.00110175 )
------------------------------------------------------------
#Fit statistic : Chi-Squared =          49.98 using 59 PHA bins.
# Reduced chi-squared =         0.8768 for     57 degrees of freedom
# Null hypothesis probability =   7.335277e-01

Photon flux (15-150 keV)    in 1 sec: 1.09715 ( -0.122154  0.122474 ) ph/cm2/s
Energy fluence (15-150 keV)             : 1.16972e-07 ( -1.35899e-08  1.36655e-08 ) ergs/cm2
Cutoff power-law model

Time interval is from   -0.284 sec. to    0.716 sec.
Spectral model in the cutoff power-law:
------------------------------------------------------------
Parameters  : value       lower 90%   higher 90%
Photon index: -0.195004     ( -1.09258   0.847385 )
Epeak [keV] : 151.860      ( -52.8167 1571.92 )
Norm@50keV  : 2.19467E-02    ( -0.0120316   0.0371949 )
------------------------------------------------------------
#Fit statistic : Chi-Squared =          46.97 using 59 PHA bins.
# Reduced chi-squared =         0.8388 for     56 degrees of freedom
# Null hypothesis probability =   7.994623e-01

Photon flux (15-150 keV)    in 1 sec: 1.06322 ( -0.127639  0.12732 ) ph/cm2/s
Energy fluence (15-150 keV)             : 1.12406e-07 ( -1.50709e-08  1.4776e-08 ) ergs/cm2
Band function
Time interval is from   -0.284 sec. to    0.716 sec.

Spectral model in the Band function:
------------------------------------------------------------
Parameters  : value       lower 90%   higher 90%
alpha       : 5.00000   ( -5   -5 )
beta        : -0.680968    ( -0.190952   0.201962 )
Epeak [keV] : 21.1294      ( -20.4728 -20.4728 )
Norm@50keV   : 1216.67    ( -130.703   988390 )
------------------------------------------------------------
#Fit statistic : Chi-Squared =          49.89 using 59 PHA bins.
# Reduced chi-squared =         0.9070 for     55 degrees of freedom
# Null hypothesis probability =   6.698287e-01

Photon flux (15-150 keV)    in 1 sec:  (    ) ph/cm2/s
Energy fluence (15-150 keV)             : 0 ( 0  0 ) ergs/cm2
Single BB
Spectral model blackbody:
------------------------------------------------------------
Parameters  : value    Lower 90%  Upper 90%
kT [keV]    : 26.0751  (-3.62197  4.72524)
R^2/D10^2   : 2.55171E-02  (-0.0097678   0.0143502)
(R is the radius in km and D10 is the distance to the source in units of 10 kpc)
------------------------------------------------------------
#Fit statistic : Chi-Squared =          50.11 using 59 PHA bins.
# Reduced chi-squared =         0.8791 for     57 degrees of freedom
# Null hypothesis probability =   7.291634e-01

Energy  Fluence     90% Error
[keV]   [erg/cm2]   [erg/cm2]
15- 25  2.946e-09   6.435e-10
25- 50  1.707e-08   3.250e-09
50-150  8.543e-08   1.623e-08
15-150  1.054e-07   1.707e-08
Thermal bremsstrahlung (OTTB)
Spectral model: thermal bremsstrahlung
------------------------------------------------------------
Parameters  : value         Lower 90%    Upper 90%
kT [keV]    : 200.000       (      )
Norm        : 4.04890       (-0.506689     0.506794)
------------------------------------------------------------
#Fit statistic : Chi-Squared =         103.68 using 59 PHA bins.
# Reduced chi-squared =         1.8189 for     57 degrees of freedom
# Null hypothesis probability =   1.557406e-04

Energy  Fluence     90% Error
[keV]   [erg/cm2]   [erg/cm2]
15- 25  1.019e-08   5.695e-09
25- 50  1.960e-08   1.087e-08
50-150  4.299e-08   2.365e-08
15-150  7.279e-08   4.026e-08
Double BB

Spectral model: bbodyrad<1> + bbodyrad<2>
------------------------------------------------------------
Parameters  : value         Lower 90%    Upper 90%
kT1 [keV]   : 0.426398        (-0.426444      5.96941)
R1^2/D10^2  : 1.11962E+12        (-1.60108e+12      1.15866e+18)
kT2 [keV]   : 26.1658        (-3.66003      4.78086)
R2^2/D10^2  : 2.52234E-02    (-0.00968389   0.0140816)
------------------------------------------------------------
#Fit statistic : Chi-Squared =          49.93 using 59 PHA bins.
# Reduced chi-squared =         0.9078 for     55 degrees of freedom
# Null hypothesis probability =   6.683153e-01

Energy  Fluence     90% Error
[keV]   [erg/cm2]   [erg/cm2]
15- 25  2.928e-09   6.905e-10
25- 50  1.698e-08   3.470e-09
50-150  8.555e-08   1.575e-08
15-150  1.055e-07   1.844e-08
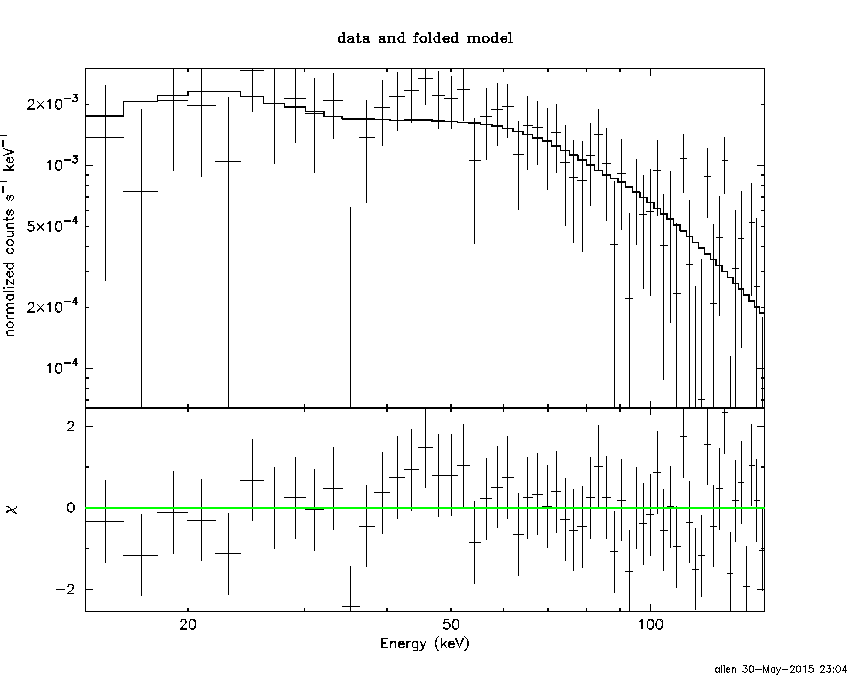
Pre-slew spectrum (Pre-slew PHA with pre-slew DRM)
Power-law model
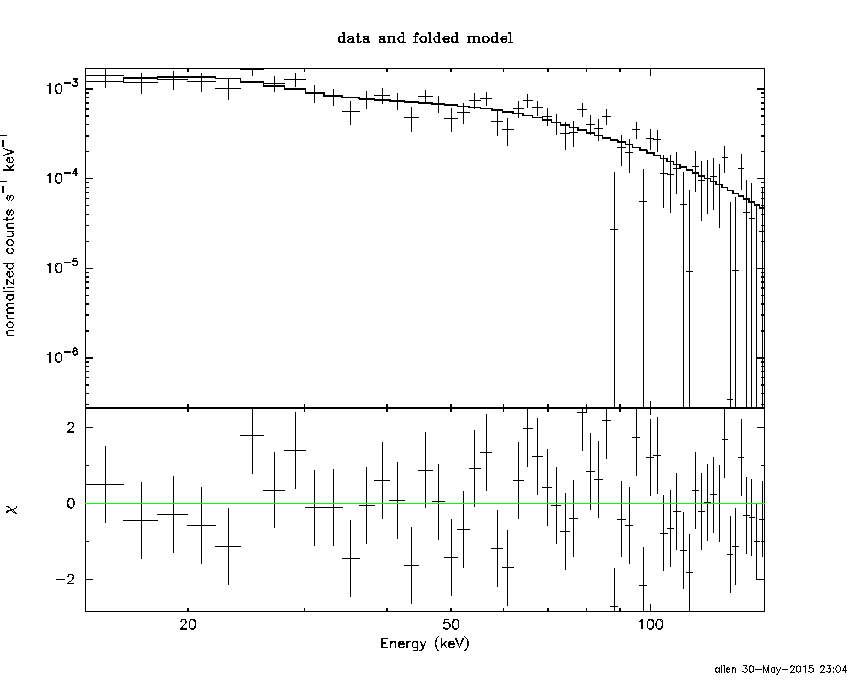
Spectral model in power-law:
------------------------------------------------------------
Parameters  : value       lower 90%   higher 90%
Photon index: 1.11628     ( -0.108193   0.107175 )
Norm@50keV  : 3.97003E-03    ( -0.000233239   0.000233159 )
------------------------------------------------------------
#Fit statistic : Chi-Squared =          74.97 using 59 PHA bins.
# Reduced chi-squared =          1.315 for     57 degrees of freedom
# Null hypothesis probability =   5.545721e-02

Photon flux (15-150 keV)    in 17.28 sec: 0.461252 ( -0.0278339  0.0278666 ) ph/cm2/s
Energy fluence (15-150 keV)             : 7.13571e-07 ( -4.7037e-08  4.7284e-08 ) ergs/cm2
Cutoff power-law model
Spectral model in the cutoff power-law:
------------------------------------------------------------
Parameters  : value       lower 90%   higher 90%
Photon index: 0.941886     ( -0.430638   0.225283 )
Epeak [keV] : 339.055      ( -339.055 -339.055 )
Norm@50keV  : 4.76767E-03    ( -0.000982113   0.00259703 )
------------------------------------------------------------
#Fit statistic : Chi-Squared =          74.42 using 59 PHA bins.
# Reduced chi-squared =          1.329 for     56 degrees of freedom
# Null hypothesis probability =   5.041820e-02

Photon flux (15-150 keV)    in 17.28 sec: 0.457106 ( -0.029368  0.029306 ) ph/cm2/s
Energy fluence (15-150 keV)             : 7.06128e-07 ( -5.076e-08  4.96472e-08 ) ergs/cm2
Band function

Spectral model in the Band function:
------------------------------------------------------------
Parameters  : value       lower 90%   higher 90%
alpha       : -0.942799   ( 0.897327   0.897327 )
beta        : -10.0000    ( 10   3.55271e-15 )
Epeak [keV] : 339.164      ( -188.956 -339.296 )
Norm@50keV   : 4.76642E-03    ( -0.000561274   0.00259873 )
------------------------------------------------------------
#Fit statistic : Chi-Squared =          74.42 using 59 PHA bins.
# Reduced chi-squared =          1.353 for     55 degrees of freedom
# Null hypothesis probability =   4.167724e-02

Photon flux (15-150 keV)    in 17.28 sec:  (    ) ph/cm2/s
Energy fluence (15-150 keV)             : 0 ( 0  0 ) ergs/cm2
S(25-50 keV) vs. S(50-100 keV) plot

S(25-50 keV)  = 1.42e-07
S(50-100 keV) = 2.63e-07
T90 vs. Hardness ratio plot

T90                                   = 14.0919999480247 sec.
Hardness ratio (energy fluence ratio) = 1.85211
Color vs. Color plot

Count Ratio  (25-50 keV) / (15-25 keV) = 1.70924
Count Ratio (50-100 keV) / (15-25 keV) = 1.68285
Mask shadow pattern

IMX = -1.902801649953838E-02, IMY = 1.830964893162891E-01
TIME vs. PHA plot around the trigger time
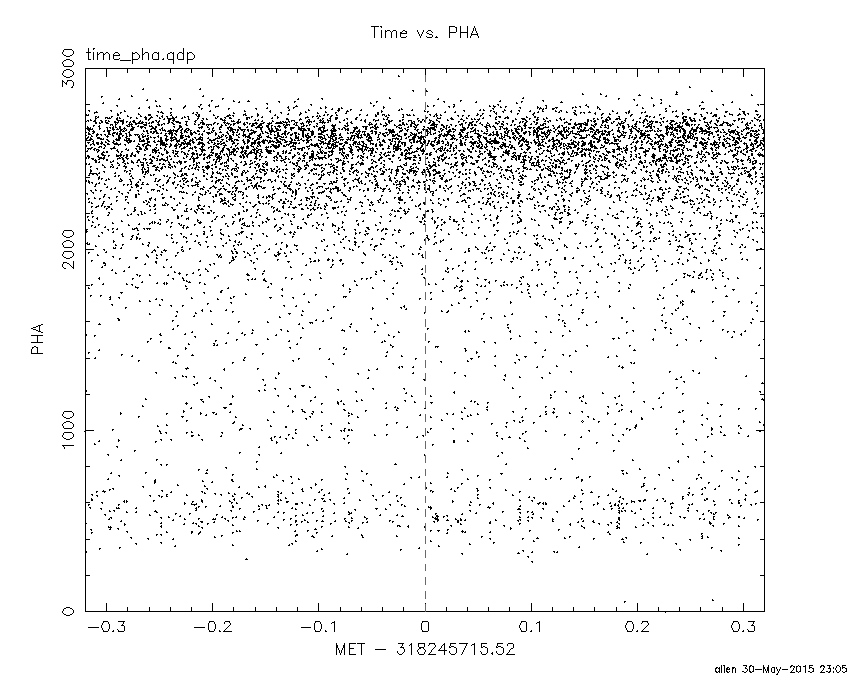
Blue+Cyan dotted lines: Time interval of the scaled map
From 0.000000 to 1.024000
TIME vs. DetID plot around the trigger time
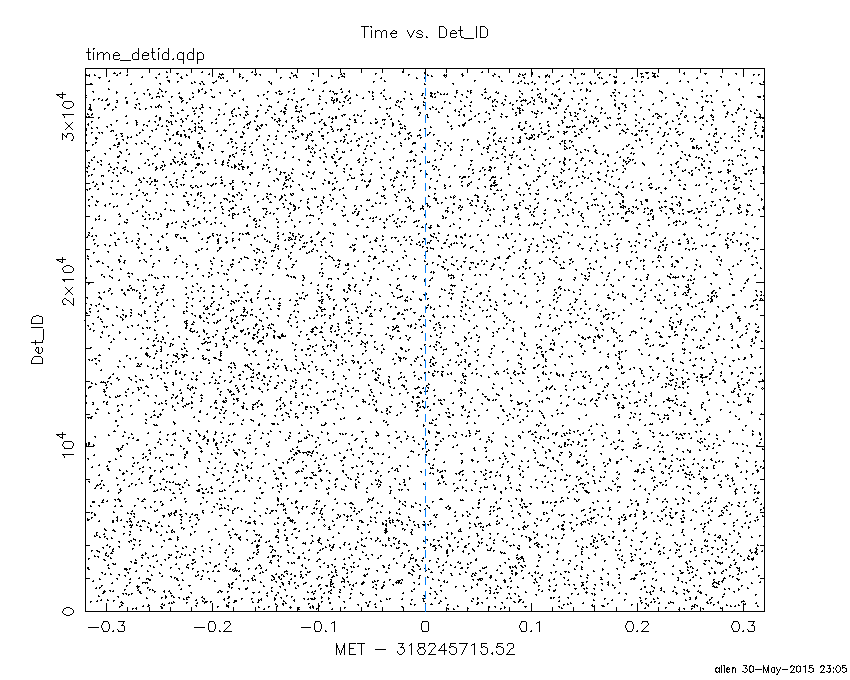
Blue+Cyan dotted lines: Time interval of the scaled map
From 0.000000 to 1.024000
100 us light curve (15-350 keV)

Blue+Cyan dotted lines: Time interval of the scaled map
From 0.000000 to 1.024000
Spacecraft aspect plot

Bright source in the pre-burst/pre-slew/post-slew images
Pre-burst image of 15-350 keV band
Time interval of the image:
-12.819400 -2.848000

# RAcent  DECcent POSerr Theta    Phi  PeakCts   SNR AngSep     Name
#  [deg]    [deg]    ['] [deg]  [deg]                   [']
130.3385  52.5024    2.7  25.7   88.6   0.1592   4.3 ------	UNKNOWN
352.4102  52.2830    3.0  47.5 -127.6   0.4537   3.8 ------	UNKNOWN
Pre-slew background subtracted image of 15-350 keV band
Time interval of the image:
-2.848000 14.432000

# RAcent  DECcent POSerr Theta    Phi  PeakCts   SNR AngSep     Name
#  [deg]    [deg]    ['] [deg]  [deg]                   [']
 67.1047  37.2349    2.7  49.0  159.6   0.8171   4.3 ------	UNKNOWN
137.5034  88.6106    0.6  10.4  -95.9   1.1820  20.2 ------	UNKNOWN
222.8200  35.0522    2.3  55.6  -13.5   1.0622   4.9 ------	UNKNOWN
240.5830  37.6573    2.4  56.5  -31.0   1.6122   4.7 ------	UNKNOWN
Post-slew image of 15-350 keV band
Time interval of the image:
50.780610 962.564400

# RAcent  DECcent POSerr Theta    Phi  PeakCts   SNR AngSep     Name
#  [deg]    [deg]    ['] [deg]  [deg]                   [']
254.5144  35.2442   10.3  55.4  -30.6   3.2162   1.1    6.5	Her X-1
210.9302  33.9613    3.0  55.7   13.0   7.6392   3.8 ------	UNKNOWN
 61.2252  57.2631    2.6  32.4  165.7   2.4686   4.4 ------	UNKNOWN
 58.5238  60.7846    3.0  29.0  168.8   1.6335   3.8 ------	UNKNOWN
239.0544  35.8278    3.4  54.5  -15.2   4.4523   3.4 ------	UNKNOWN
Plot creation:
Sat May 30 23:05:32 EDT 2015