Special notes of this burst
Image
Pre-slew 15.0-350.0 keV image (Event data)

#   RAcent    DECcent   POSerr    Theta     Phi              Peak Cts       SNR   Name
   22.4871   -20.5669   0.0150    13.7464   158.6575         0.4851449     12.837 TRIG_00445038

Foreground time interval of the image:
 -1.544  17.528 (delta_t =  19.072 [sec])
Background time interval of the image:
-239.992  -1.544 (delta_t = 238.448 [sec])
Lightcurves
Notes:
- 1) The mask-weighted light curves are using the flight position.
- 2) Multiple plots of different time binning/intervals are shown to cover all scenarios of short/long GRBs, rate/image triggers, and real/false positives.
- 3) For all the mask-weighted lightcurves, the y-axis units are counts/sec/det where a det is 0.4 x 0.4 = 0.16 sq cm.
- 4) The verticle lines correspond to following: green dotted lines are T50 interval, black dotted lines are T90 interval, blue solid line(s) is a spacecraft slew start time, and orange solid line(s) is a spacecraft slew end time.
- 5) Time of each bin is in the middle of the bin.
1 s binning
From T0-310 s to T0+310 s

From T100_start - 20 s to T100_end + 30 s

Full time interval

64 ms binning
Full time interval

From T100_start to T100_end

From T0-5 sec to T0+5 sec

16 ms binning
From T100_start-5 s to T100_start+5 s

Blue+Cyan dotted lines: Time interval of the scaled map
From 0.000000 to 1.024000
8 ms binning
From T100_start-3 s to T100_start+3 s

Blue+Cyan dotted lines: Time interval of the scaled map
From 0.000000 to 1.024000
2 ms binning
From T100_start-1 s to T100_start+1 s

Blue+Cyan dotted lines: Time interval of the scaled map
From 0.000000 to 1.024000
SN=5 or 10 sec. binning (whichever binning is satisfied first)

SN=5 or 10 sec. binning (T < 200 sec)

Quad-rate summed light curves (from T0-300s to T0+1000s)

The mask-weighted light curves based on cleaned DPHs

Spectral Evolution

Spectra
Notes:
- 1) The fitting includes the systematic errors.
- 2) When the burst includes telescope slew time periods, the fitting uses an average response file made from multiple 5-s response files through out the slew time plus single time preiod for the non-slew times, and weighted by the total counts in the corresponding time period using addrmf. An average response file is needed becuase a spectral fit using the pre-slew DRM will introduce some errors in both a spectral shape and a normalization if the PHA file contains a lot of the slew/post-slew time interval.
- 3) For fits to more complicated models (e.g. a power-law over a cutoff power-law), the BAT team has decided to require a chi-square improvement of more than 6 for each extra dof.
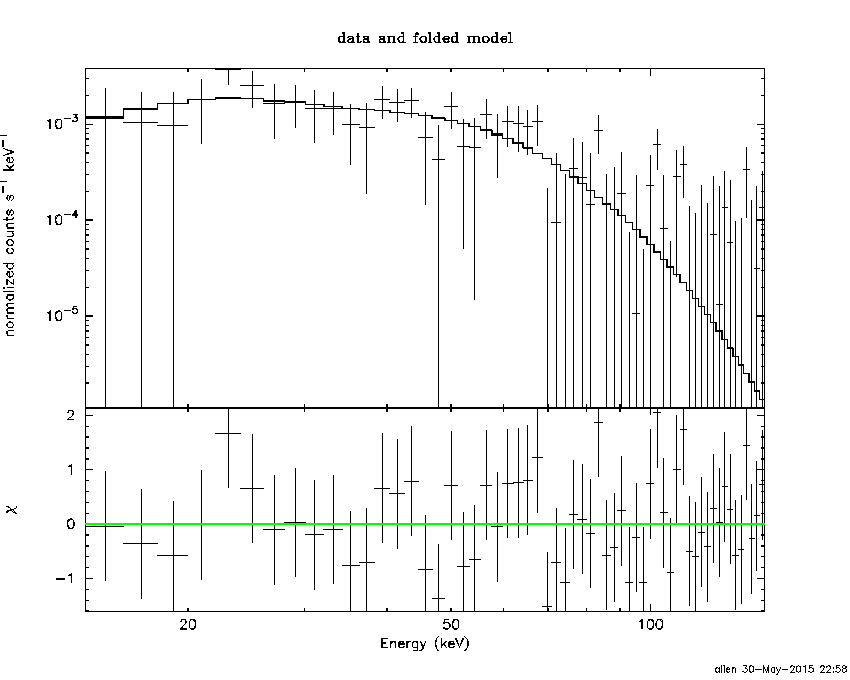
Time averaged spectrum fit using the average DRM
Power-law model

Time interval is from   -1.544 sec. to   17.528 sec.

Spectral model in power-law:
------------------------------------------------------------
Parameters  : value       lower 90%   higher 90%
Photon index: 1.93751     ( -0.243375   0.262178 )
Norm@50keV  : 1.32485E-03    ( -0.000231542   0.000225383 )
------------------------------------------------------------
#Fit statistic : Chi-Squared =          54.95 using 59 PHA bins.
# Reduced chi-squared =         0.9641 for     57 degrees of freedom
# Null hypothesis probability =   5.521947e-01

Photon flux (15-150 keV)    in 19.07 sec: 0.193231 ( -0.0256876  0.0256876 ) ph/cm2/s
Energy fluence (15-150 keV)             : 2.32425e-07 ( -3.83826e-08  3.97808e-08 ) ergs/cm2
Cutoff power-law model

Time interval is from   -1.544 sec. to   17.528 sec.
Spectral model in the cutoff power-law:
------------------------------------------------------------
Parameters  : value       lower 90%   higher 90%
Photon index: 1.01734     ( -1.35136   1.01702 )
Epeak [keV] : 43.7259      (   )
Norm@50keV  : 4.56210E-03    (     )
------------------------------------------------------------
#Fit statistic : Chi-Squared =          52.61 using 59 PHA bins.
# Reduced chi-squared =         0.9395 for     56 degrees of freedom
# Null hypothesis probability =   6.038672e-01

Photon flux (15-150 keV)    in 19.07 sec: 0.186810 ( -0.026363  0.026513 ) ph/cm2/s
Energy fluence (15-150 keV)             : 2.11233e-07 ( -4.0499e-08  4.51883e-08 ) ergs/cm2
Band function

Time interval is from   -1.544 sec. to   17.528 sec.

Spectral model in the Band function:
------------------------------------------------------------
Parameters  : value       lower 90%   higher 90%
alpha       : -1.01740   ( -5.39714   1.56765 )
beta        : -10.0000    ( 10   3.55271e-15 )
Epeak [keV] : 43.7181      ( -15.6555 -43.7181 )
Norm@50keV   : 4.56138E-03    ( -0.00456137   0.0246578 )
------------------------------------------------------------
#Fit statistic : Chi-Squared =          52.61 using 59 PHA bins.
# Reduced chi-squared =         0.9566 for     55 degrees of freedom
# Null hypothesis probability =   5.663643e-01

Photon flux (15-150 keV)    in 19.07 sec: 0.188312 ( 6.81169  -0.028089 ) ph/cm2/s
Energy fluence (15-150 keV)             : 2.11345e-07 ( -2.11212e-07  -4.08111e-08 ) ergs/cm2
Single BB

Spectral model blackbody:
------------------------------------------------------------
Parameters  : value    Lower 90%  Upper 90%
kT [keV]    : 9.99331  (-1.48132  1.76392)
R^2/D10^2   : 9.15977E-02  (-0.0419508   0.0764106)
(R is the radius in km and D10 is the distance to the source in units of 10 kpc)
------------------------------------------------------------
#Fit statistic : Chi-Squared =          60.28 using 59 PHA bins.
# Reduced chi-squared =          1.058 for     57 degrees of freedom
# Null hypothesis probability =   3.580851e-01

Energy  Fluence     90% Error
[keV]   [erg/cm2]   [erg/cm2]
15- 25  3.552e-08   8.067e-09
25- 50  8.823e-08   1.704e-08
50-150  4.596e-08   1.821e-08
15-150  1.697e-07   3.230e-08
Thermal bremsstrahlung (OTTB)

Spectral model: thermal bremsstrahlung
------------------------------------------------------------
Parameters  : value         Lower 90%    Upper 90%
kT [keV]    : 70.0892       (-24.1019      47.9593)
Norm        : 0.954286       (-0.181131     0.227724)
------------------------------------------------------------
#Fit statistic : Chi-Squared =          52.81 using 59 PHA bins.
# Reduced chi-squared =         0.9264 for     57 degrees of freedom
# Null hypothesis probability =   6.330652e-01

Energy  Fluence     90% Error
[keV]   [erg/cm2]   [erg/cm2]
15- 25  4.669e-08   8.801e-09
25- 50  7.432e-08   1.189e-08
50-150  9.555e-08   4.702e-08
15-150  2.166e-07   5.168e-08
Double BB

Spectral model: bbodyrad<1> + bbodyrad<2>
------------------------------------------------------------
Parameters  : value         Lower 90%    Upper 90%
kT1 [keV]   : 5.71115        (-2.97497      2.86102)
R1^2/D10^2  : 0.465132        (-0.336143      9.26987)
kT2 [keV]   : 16.8005        (-5.60706      17.5128)
R2^2/D10^2  : 8.96342E-03    (-0.008471   0.0443095)
------------------------------------------------------------
#Fit statistic : Chi-Squared =          52.50 using 59 PHA bins.
# Reduced chi-squared =         0.9545 for     55 degrees of freedom
# Null hypothesis probability =   5.708456e-01

Energy  Fluence     90% Error
[keV]   [erg/cm2]   [erg/cm2]
15- 25  4.554e-08   2.530e-08
25- 50  7.511e-08   3.797e-08
50-150  8.911e-08   5.204e-08
15-150  2.098e-07   1.109e-07
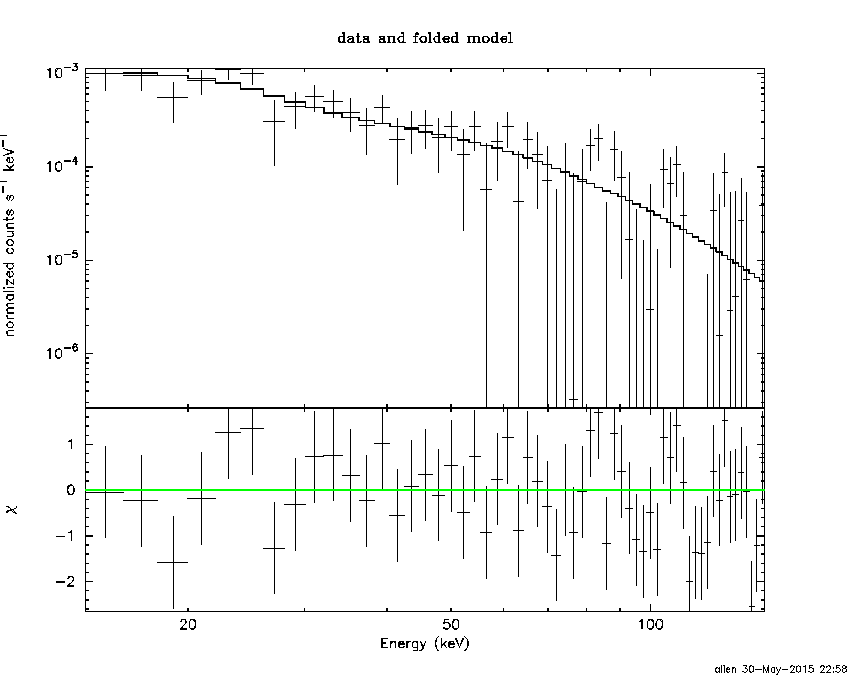
Peak spectrum fit
Power-law model

Time interval is from    0.460 sec. to    1.460 sec.

Spectral model in power-law:
------------------------------------------------------------
Parameters  : value       lower 90%   higher 90%
Photon index: 1.46927     ( -0.284918   0.289956 )
Norm@50keV  : 5.02423E-03    ( -0.000951835   0.000944051 )
------------------------------------------------------------
#Fit statistic : Chi-Squared =          45.46 using 59 PHA bins.
# Reduced chi-squared =         0.7975 for     57 degrees of freedom
# Null hypothesis probability =   8.643740e-01

Photon flux (15-150 keV)    in 1 sec: 0.622168 ( -0.113551  0.113685 ) ph/cm2/s
Energy fluence (15-150 keV)             : 4.79154e-08 ( -9.81613e-09  1.00584e-08 ) ergs/cm2
Cutoff power-law model

Time interval is from    0.460 sec. to    1.460 sec.
Spectral model in the cutoff power-law:
------------------------------------------------------------
Parameters  : value       lower 90%   higher 90%
Photon index: -0.917922     ( -2.46966   1.66466 )
Epeak [keV] : 55.2533      ( -10.5222 28.7521 )
Norm@50keV  : 9.71899E-02    ( -0.09762   1.88041 )
------------------------------------------------------------
#Fit statistic : Chi-Squared =          38.60 using 59 PHA bins.
# Reduced chi-squared =         0.6893 for     56 degrees of freedom
# Null hypothesis probability =   9.631843e-01

Photon flux (15-150 keV)    in 1 sec: 0.576154 ( -0.115227  0.116985 ) ph/cm2/s
Energy fluence (15-150 keV)             : 3.97259e-08 ( -9.2115e-09  1.08072e-08 ) ergs/cm2
Band function

Time interval is from    0.460 sec. to    1.460 sec.

Spectral model in the Band function:
------------------------------------------------------------
Parameters  : value       lower 90%   higher 90%
alpha       : 0.879036   ( -0.772271   1.53831 )
beta        : -10.00000    ( 10   1.83843e-07 )
Epeak [keV] : 55.4663      ( -10.0395 12.7542 )
Norm@50keV   : 9.26231E-02    ( -0.0161421   1.89636 )
------------------------------------------------------------
#Fit statistic : Chi-Squared =          38.60 using 59 PHA bins.
# Reduced chi-squared =         0.7019 for     55 degrees of freedom
# Null hypothesis probability =   9.542552e-01

Photon flux (15-150 keV)    in 1 sec:  (    ) ph/cm2/s
Energy fluence (15-150 keV)             : 4.12714e-08 ( 0  0 ) ergs/cm2
Single BB
Spectral model blackbody:
------------------------------------------------------------
Parameters  : value    Lower 90%  Upper 90%
kT [keV]    : 13.6618  (-2.23262  2.77445)
R^2/D10^2   : 0.106435  (-0.0517228   0.0939156)
(R is the radius in km and D10 is the distance to the source in units of 10 kpc)
------------------------------------------------------------
#Fit statistic : Chi-Squared =          38.87 using 59 PHA bins.
# Reduced chi-squared =         0.6820 for     57 degrees of freedom
# Null hypothesis probability =   9.683272e-01

Energy  Fluence     90% Error
[keV]   [erg/cm2]   [erg/cm2]
15- 25  4.205e-09   1.407e-09
25- 50  1.526e-08   4.175e-09
50-150  1.851e-08   7.478e-09
15-150  3.797e-08   1.149e-08
Thermal bremsstrahlung (OTTB)

Spectral model: thermal bremsstrahlung
------------------------------------------------------------
Parameters  : value         Lower 90%    Upper 90%
kT [keV]    : 199.357       (-109.017      -199.357)
Norm        : 2.57662       (-0.462563     0.518757)
------------------------------------------------------------
#Fit statistic : Chi-Squared =          43.73 using 59 PHA bins.
# Reduced chi-squared =         0.7672 for     57 degrees of freedom
# Null hypothesis probability =   9.016296e-01

Energy  Fluence     90% Error
[keV]   [erg/cm2]   [erg/cm2]
15- 25  6.416e-09   3.743e-09
25- 50  1.234e-08   7.060e-09
50-150  2.707e-08   1.567e-08
15-150  4.583e-08   2.599e-08
Double BB

------------------------------------------------------------
#Fit statistic : Chi-Squared =          38.54 using 59 PHA bins.
#Fit statistic : Chi-Squared =          38.39 using 59 PHA bins.
#Fit statistic : Chi-Squared =          38.38 using 59 PHA bins.
#Fit statistic : Chi-Squared =          38.32 using 59 PHA bins.
# Reduced chi-squared =         0.7006 for     55 degrees of freedom
# Reduced chi-squared =         0.6980 for     55 degrees of freedom
# Reduced chi-squared =         0.6978 for     55 degrees of freedom
# Reduced chi-squared =         0.6967 for     55 degrees of freedom
# Null hypothesis probability =   9.550490e-01
# Null hypothesis probability =   9.566791e-01
# Null hypothesis probability =   9.568441e-01
# Null hypothesis probability =   9.574803e-01

Energy  Fluence     90% Error
[keV]   [erg/cm2]   [erg/cm2]
15- 25  4.614e-09   1.034e-08
25- 50  1.499e-08   5.570e-08
50-150  2.079e-08   2.399e-07
15-150  4.039e-08   3.055e-07
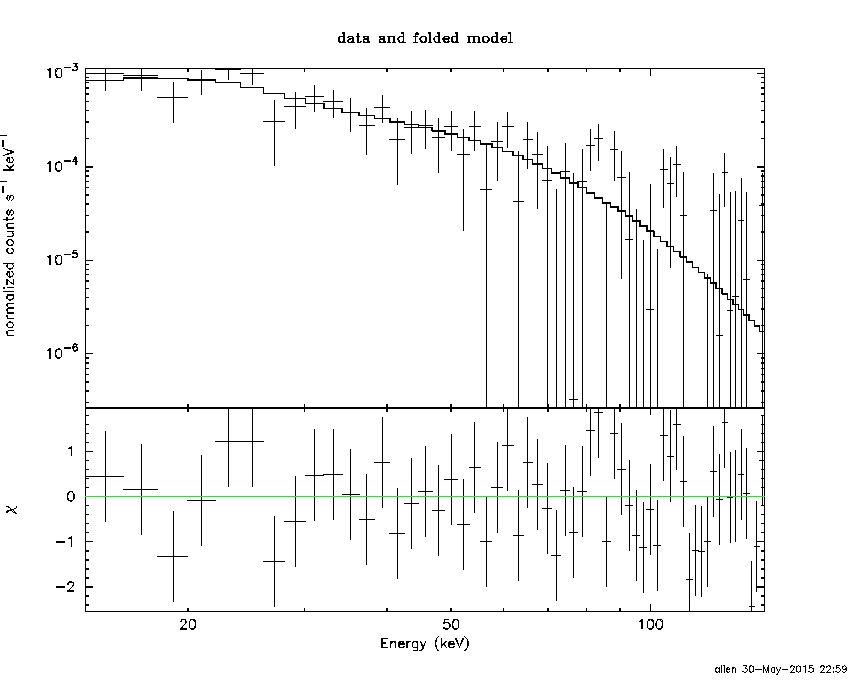
Pre-slew spectrum (Pre-slew PHA with pre-slew DRM)
Power-law model
Spectral model in power-law:
------------------------------------------------------------
Parameters  : value       lower 90%   higher 90%
Photon index: 1.93751     ( -0.243375   0.262178 )
Norm@50keV  : 1.32485E-03    ( -0.000231542   0.000225383 )
------------------------------------------------------------
#Fit statistic : Chi-Squared =          54.95 using 59 PHA bins.
# Reduced chi-squared =         0.9641 for     57 degrees of freedom
# Null hypothesis probability =   5.521947e-01

Photon flux (15-150 keV)    in 19.07 sec: 0.193231 ( -0.0256876  0.0256876 ) ph/cm2/s
Energy fluence (15-150 keV)             : 2.32425e-07 ( -3.83826e-08  3.97808e-08 ) ergs/cm2
Cutoff power-law model

Spectral model in the cutoff power-law:
------------------------------------------------------------
Parameters  : value       lower 90%   higher 90%
Photon index: 1.01734     ( -1.35136   1.01702 )
Epeak [keV] : 43.7259      (   )
Norm@50keV  : 4.56210E-03    (     )
------------------------------------------------------------
#Fit statistic : Chi-Squared =          52.61 using 59 PHA bins.
# Reduced chi-squared =         0.9395 for     56 degrees of freedom
# Null hypothesis probability =   6.038672e-01

Photon flux (15-150 keV)    in 19.07 sec: 0.186810 ( -0.026363  0.026513 ) ph/cm2/s
Energy fluence (15-150 keV)             : 2.11233e-07 ( -4.0499e-08  4.51883e-08 ) ergs/cm2
Band function
Spectral model in the Band function:
------------------------------------------------------------
Parameters  : value       lower 90%   higher 90%
alpha       : -1.01740   ( -5.39714   1.56765 )
beta        : -10.0000    ( 10   20 )
Epeak [keV] : 43.7181      ( -15.6555 -43.7181 )
Norm@50keV   : 4.56138E-03    ( -0.00456137   0.0246578 )
------------------------------------------------------------
#Fit statistic : Chi-Squared =          52.61 using 59 PHA bins.
# Reduced chi-squared =         0.9566 for     55 degrees of freedom
# Null hypothesis probability =   5.663643e-01

Photon flux (15-150 keV)    in 19.07 sec: 0.188312 ( 6.81169  -0.028089 ) ph/cm2/s
Energy fluence (15-150 keV)             : 2.11345e-07 ( -2.11212e-07  -4.08111e-08 ) ergs/cm2
S(25-50 keV) vs. S(50-100 keV) plot

S(25-50 keV)  = 6.86e-08
S(50-100 keV) = 7.17e-08
T90 vs. Hardness ratio plot

T90                                   = 15.9840000867844 sec.
Hardness ratio (energy fluence ratio) = 1.04519
Color vs. Color plot

Count Ratio  (25-50 keV) / (15-25 keV) = 1.02413
Count Ratio (50-100 keV) / (15-25 keV) = 0.519744
Mask shadow pattern

IMX = -2.278559744226316E-01, IMY = -8.903192481110719E-02
TIME vs. PHA plot around the trigger time

Blue+Cyan dotted lines: Time interval of the scaled map
From 0.000000 to 1.024000
TIME vs. DetID plot around the trigger time

Blue+Cyan dotted lines: Time interval of the scaled map
From 0.000000 to 1.024000
100 us light curve (15-350 keV)

Blue+Cyan dotted lines: Time interval of the scaled map
From 0.000000 to 1.024000
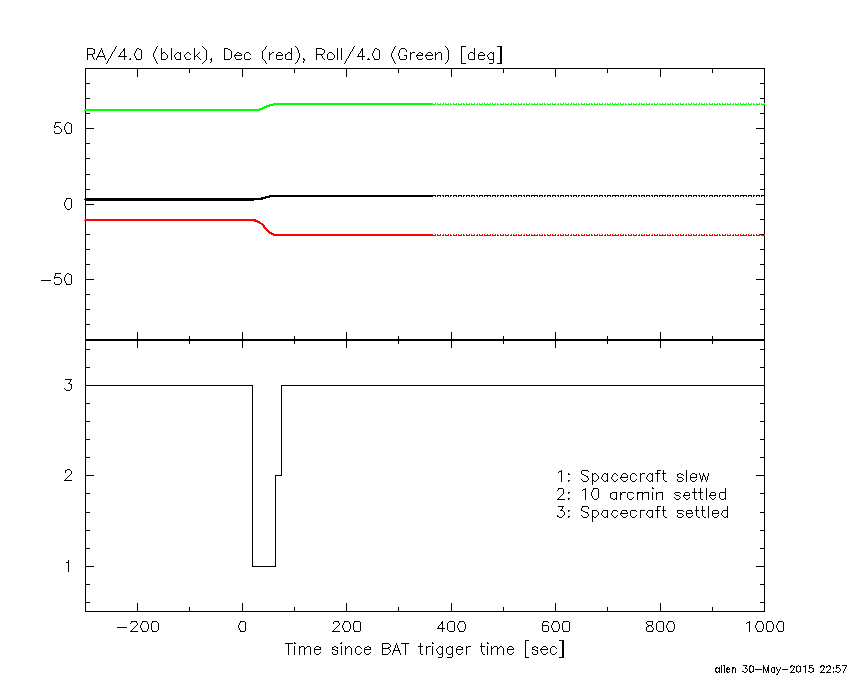
Spacecraft aspect plot
Bright source in the pre-burst/pre-slew/post-slew images
Pre-burst image of 15-350 keV band
Time interval of the image:
-239.992000 -1.544000

# RAcent  DECcent POSerr Theta    Phi  PeakCts   SNR AngSep     Name
#  [deg]    [deg]    ['] [deg]  [deg]                   [']
 39.5332 -17.6500    2.2  27.1  129.6   1.1343   5.2 ------	UNKNOWN
 31.5338 -10.0684    2.5  18.7  111.5   0.8195   4.7 ------	UNKNOWN
  3.5372 -34.2607    2.2  24.9 -140.5   0.8850   5.2 ------	UNKNOWN
Pre-slew background subtracted image of 15-350 keV band
Time interval of the image:
-1.544000 17.528000

# RAcent  DECcent POSerr Theta    Phi  PeakCts   SNR AngSep     Name
#  [deg]    [deg]    ['] [deg]  [deg]                   [']
 22.4871 -20.5670    0.9  13.7  158.7   0.4852  12.8 ------	UNKNOWN
Post-slew image of 15-350 keV band
Time interval of the image:
63.108590 962.143000

# RAcent  DECcent POSerr Theta    Phi  PeakCts   SNR AngSep     Name
#  [deg]    [deg]    ['] [deg]  [deg]                   [']
  9.2687 -35.4619    2.8  18.9 -139.7   1.5638   4.1 ------	UNKNOWN
Plot creation:
Sat May 30 22:59:56 EDT 2015