Special notes of this burst
Image
Pre-slew 15.0-350.0 keV image (Event data)
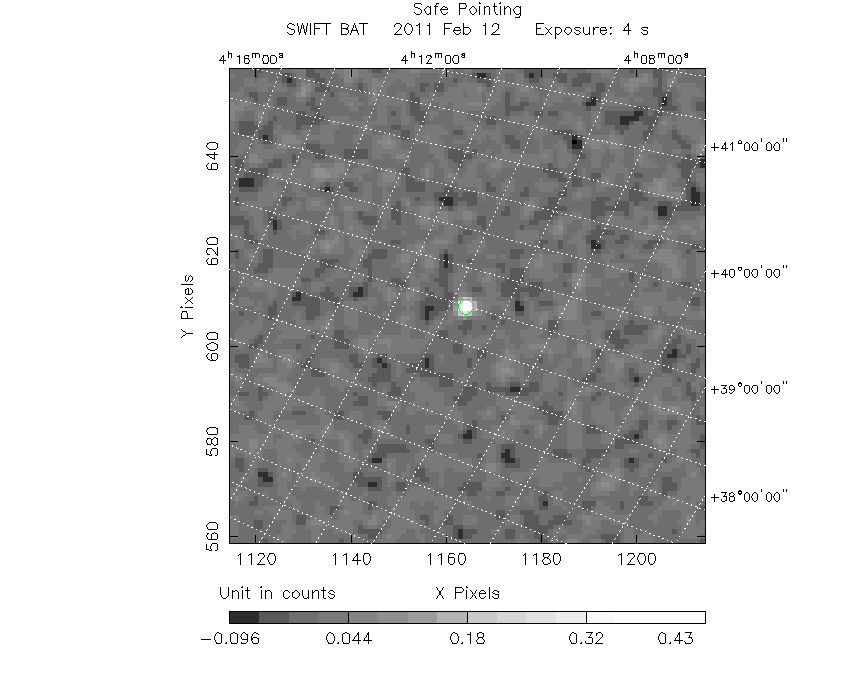
#   RAcent    DECcent   POSerr    Theta     Phi              Peak Cts       SNR   Name
   69.0243    43.7153   0.0105    33.3720  -155.1575         0.4870249     18.359 TRIG_00445321

Foreground time interval of the image:
 -1.764   2.588 (delta_t =   4.352 [sec])
Background time interval of the image:
-239.392  -1.764 (delta_t = 237.628 [sec])
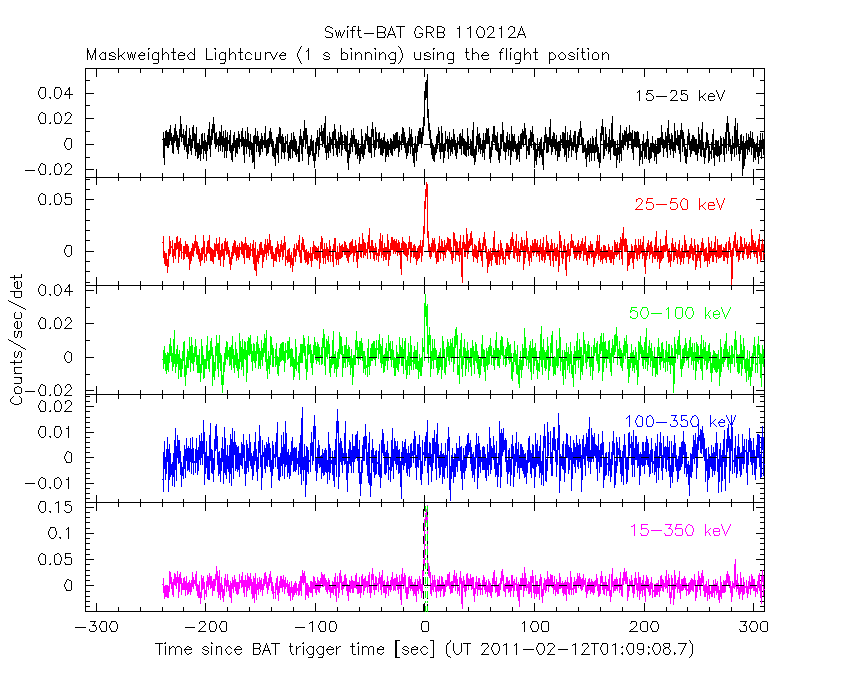
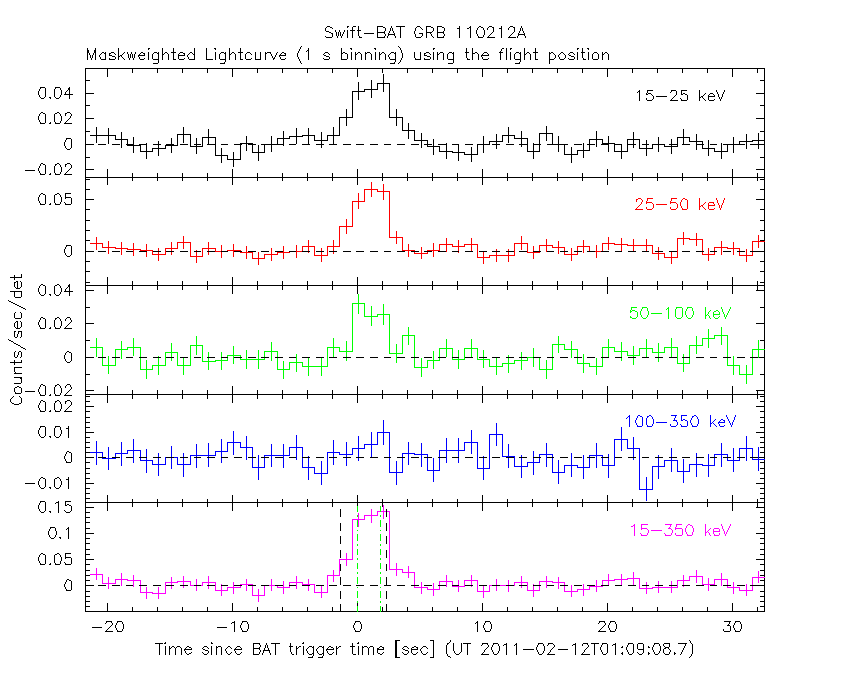
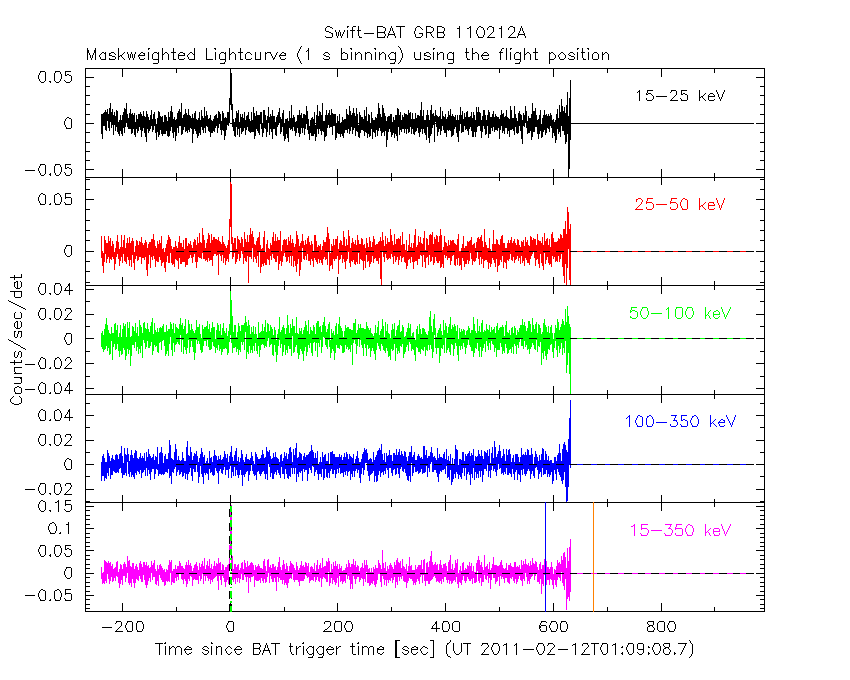
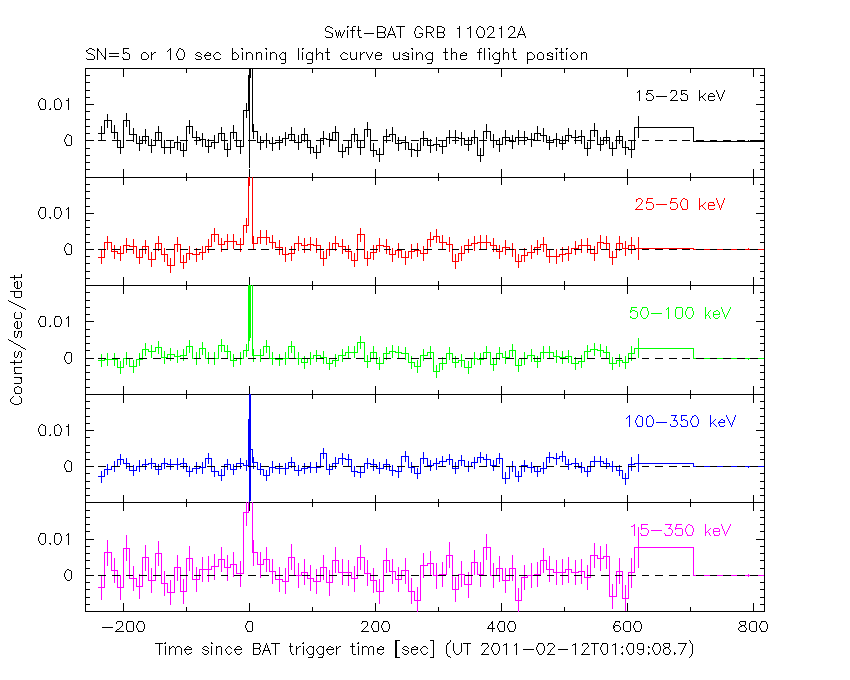
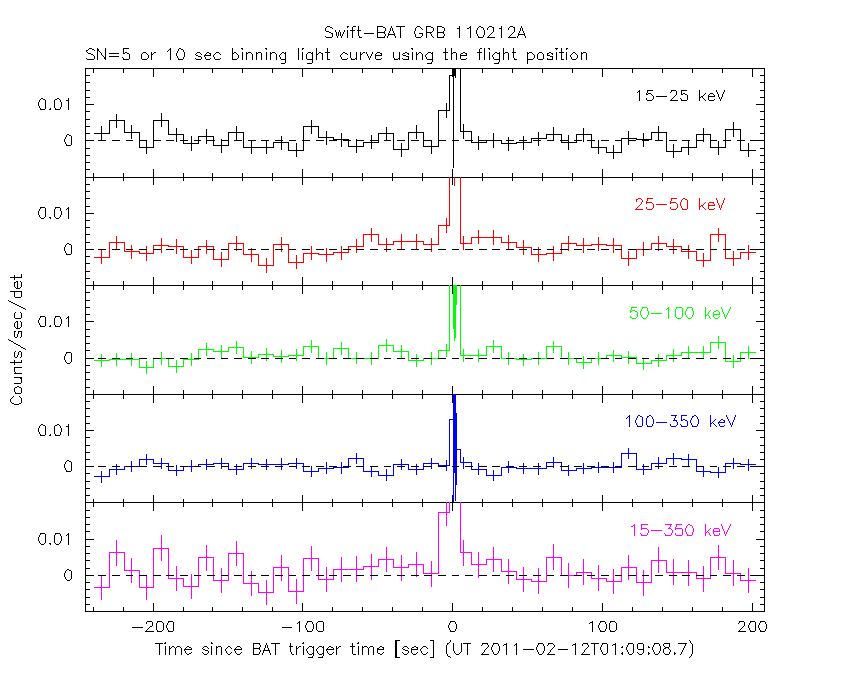
Lightcurves
Notes:
- 1) The mask-weighted light curves are using the flight position.
- 2) Multiple plots of different time binning/intervals are shown to cover all scenarios of short/long GRBs, rate/image triggers, and real/false positives.
- 3) For all the mask-weighted lightcurves, the y-axis units are counts/sec/det where a det is 0.4 x 0.4 = 0.16 sq cm.
- 4) The verticle lines correspond to following: green dotted lines are T50 interval, black dotted lines are T90 interval, blue solid line(s) is a spacecraft slew start time, and orange solid line(s) is a spacecraft slew end time.
- 5) Time of each bin is in the middle of the bin.
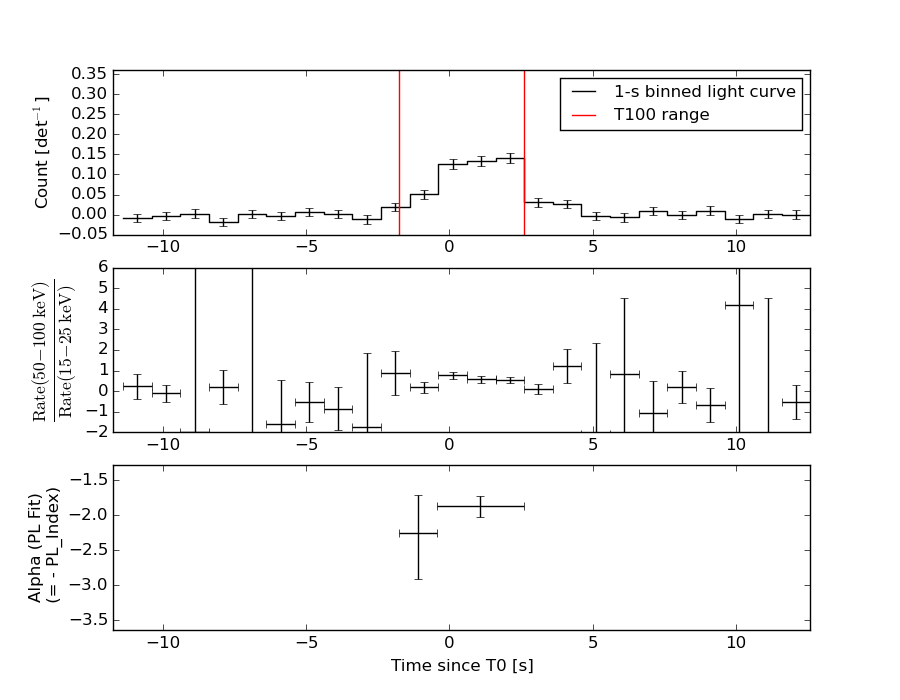
1 s binning
From T0-310 s to T0+310 s
From T100_start - 20 s to T100_end + 30 s
Full time interval
64 ms binning
Full time interval
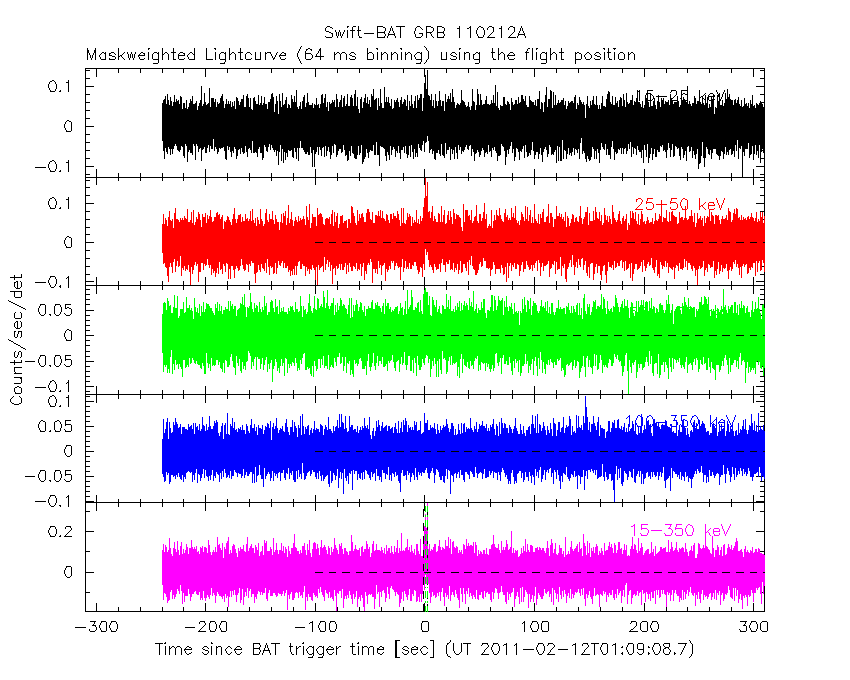
From T100_start to T100_end

From T0-5 sec to T0+5 sec

16 ms binning
From T100_start-5 s to T100_start+5 s
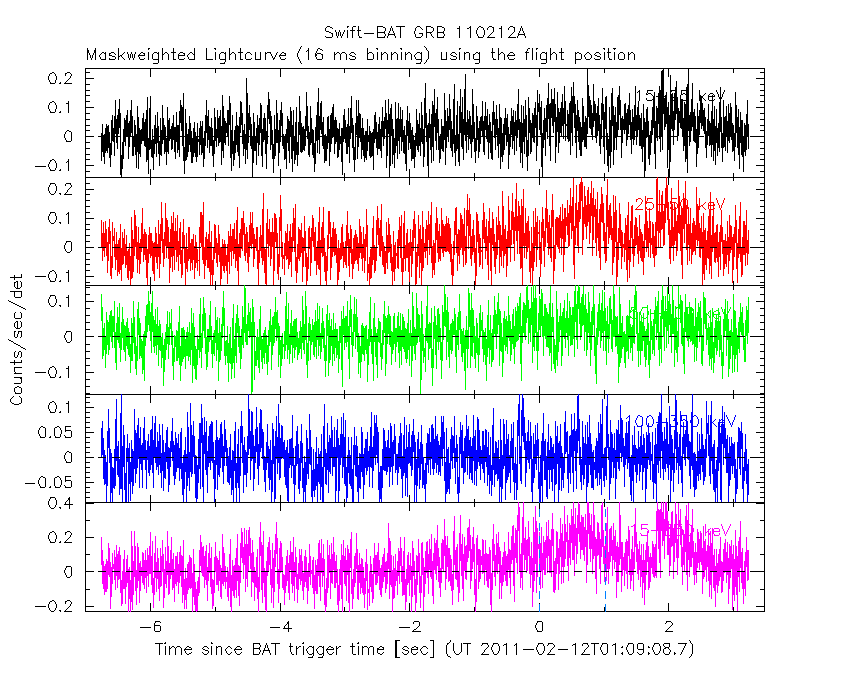
Blue+Cyan dotted lines: Time interval of the scaled map
From 0.000000 to 1.024000
8 ms binning
From T100_start-3 s to T100_start+3 s
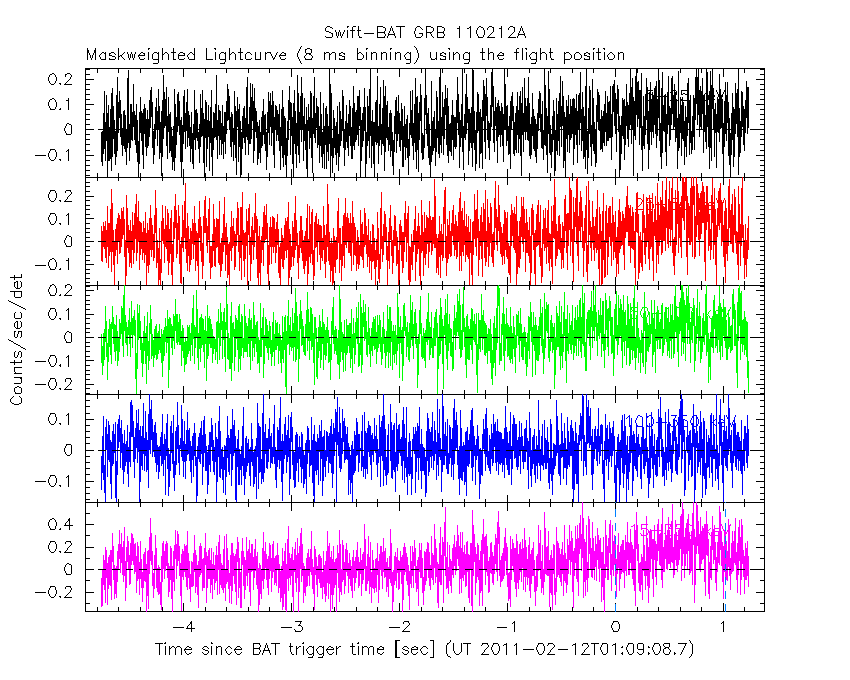
Blue+Cyan dotted lines: Time interval of the scaled map
From 0.000000 to 1.024000
2 ms binning
From T100_start-1 s to T100_start+1 s
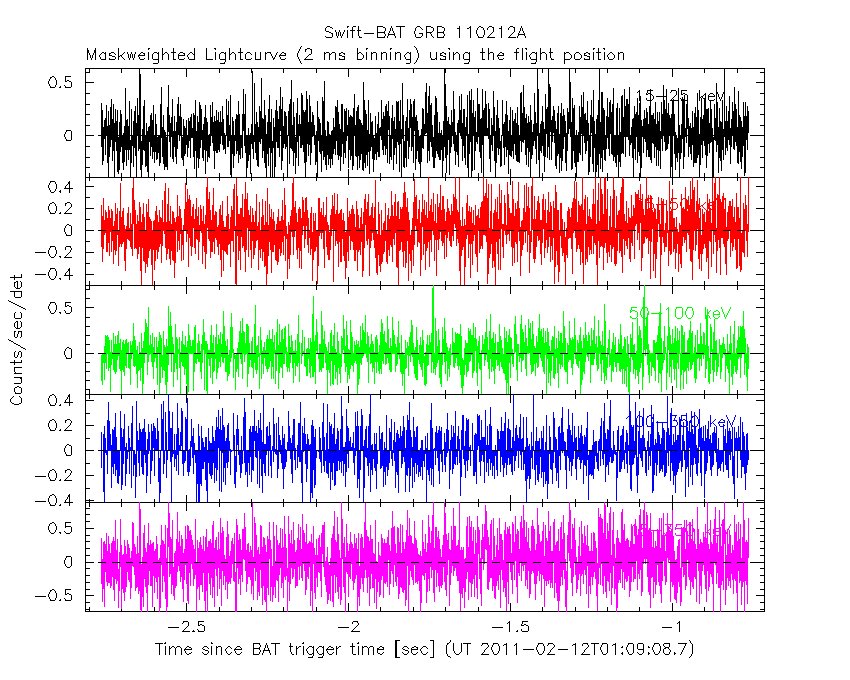
Blue+Cyan dotted lines: Time interval of the scaled map
From 0.000000 to 1.024000
SN=5 or 10 sec. binning (whichever binning is satisfied first)
SN=5 or 10 sec. binning (T < 200 sec)
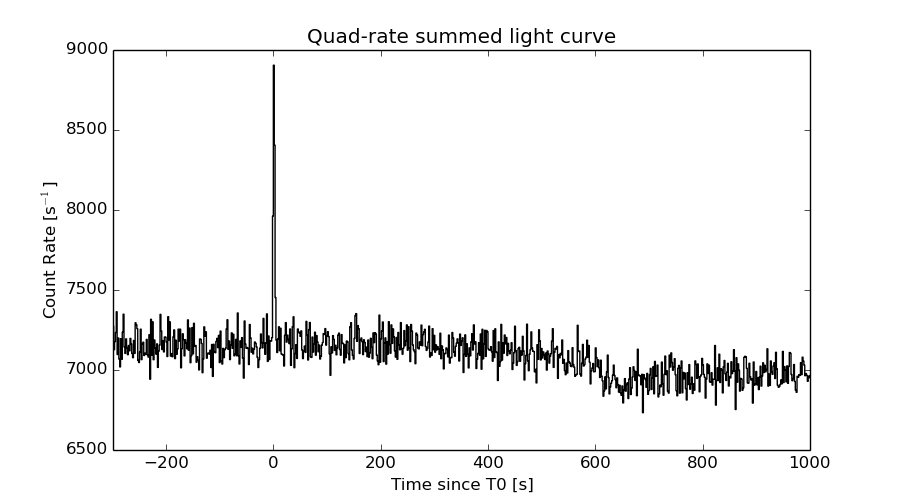
Quad-rate summed light curves (from T0-300s to T0+1000s)
Spectral Evolution
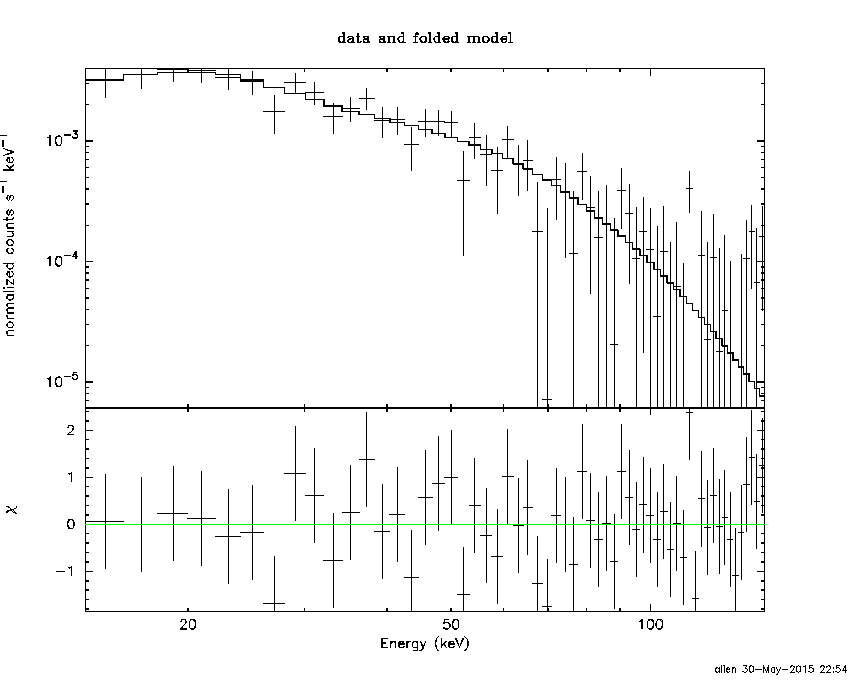
Spectra
Notes:
- 1) The fitting includes the systematic errors.
- 2) When the burst includes telescope slew time periods, the fitting uses an average response file made from multiple 5-s response files through out the slew time plus single time preiod for the non-slew times, and weighted by the total counts in the corresponding time period using addrmf. An average response file is needed becuase a spectral fit using the pre-slew DRM will introduce some errors in both a spectral shape and a normalization if the PHA file contains a lot of the slew/post-slew time interval.
- 3) For fits to more complicated models (e.g. a power-law over a cutoff power-law), the BAT team has decided to require a chi-square improvement of more than 6 for each extra dof.
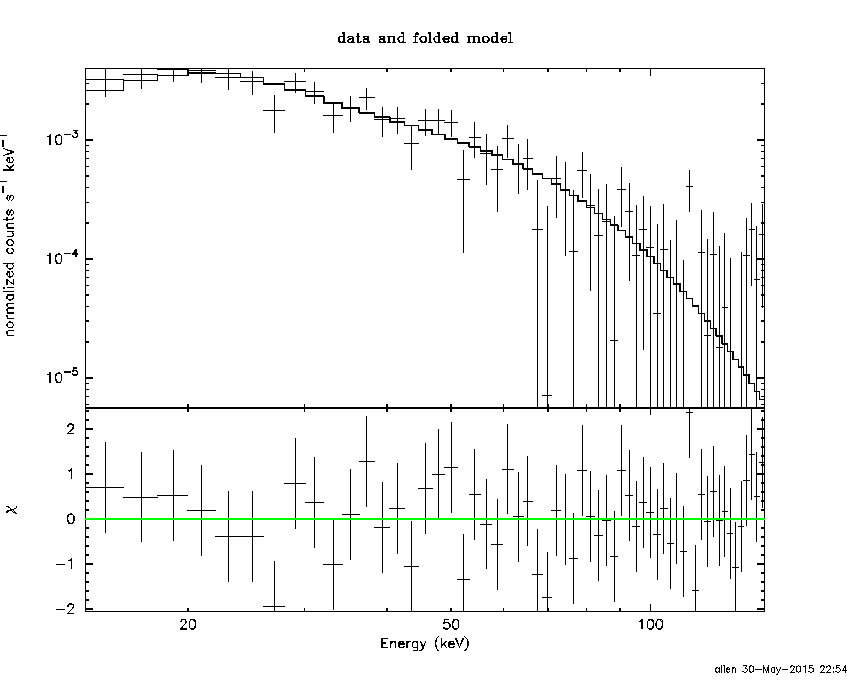
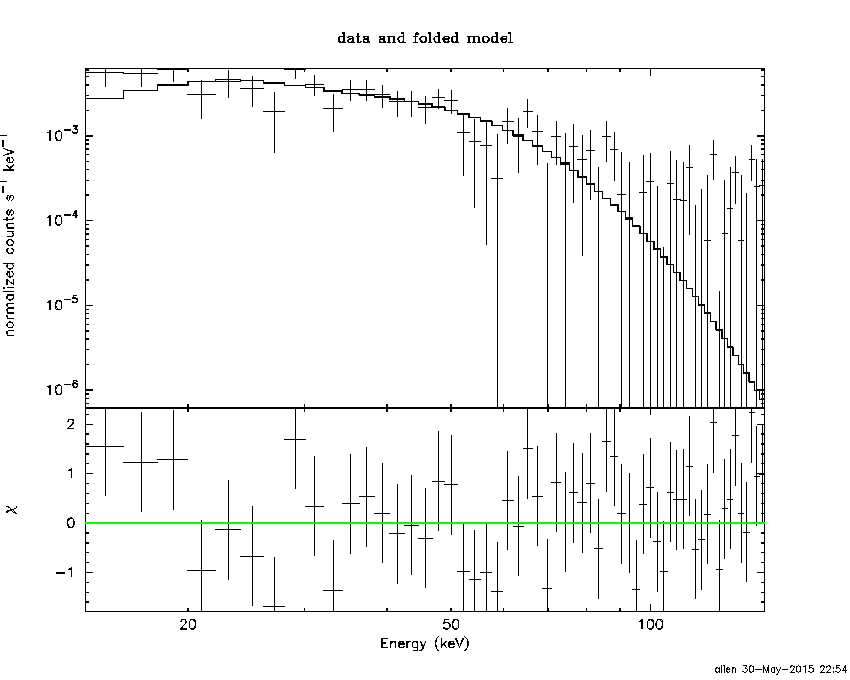
Time averaged spectrum fit using the average DRM
Power-law model
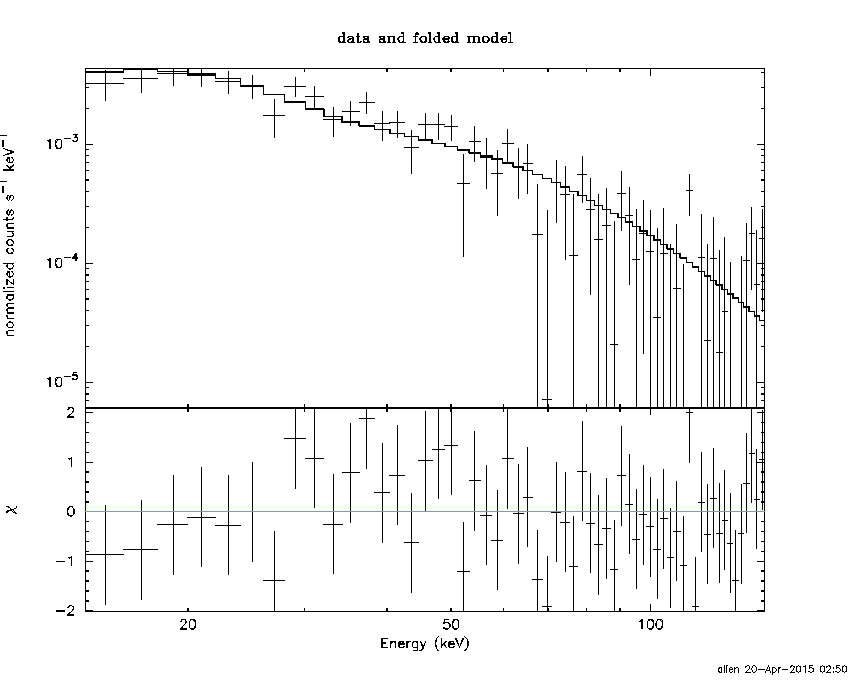
Time interval is from   -1.764 sec. to    2.588 sec.

Spectral model in power-law:
------------------------------------------------------------
Parameters  : value       lower 90%   higher 90%
Photon index: 1.94206     ( -0.151049   0.15735 )
Norm@50keV  : 6.60436E-03    ( -0.000688309   0.000677632 )
------------------------------------------------------------
#Fit statistic : Chi-Squared =          46.79 using 59 PHA bins.
# Reduced chi-squared =         0.8208 for     57 degrees of freedom
# Null hypothesis probability =   8.307482e-01

Photon flux (15-150 keV)    in 4.352 sec: 0.965172 ( -0.0835418  0.0835774 ) ph/cm2/s
Energy fluence (15-150 keV)             : 2.64446e-07 ( -2.6541e-08  2.69114e-08 ) ergs/cm2
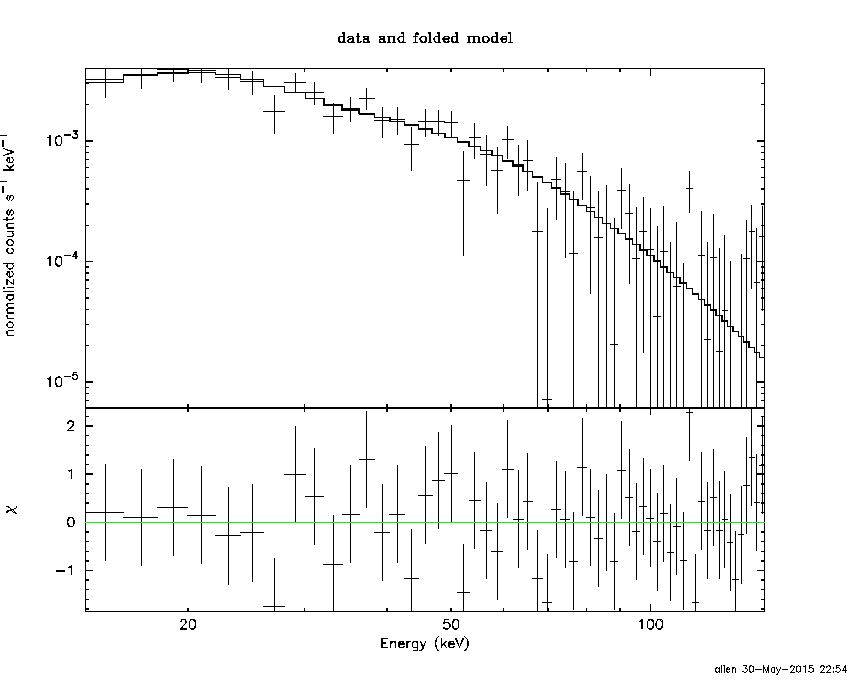
Cutoff power-law model

Time interval is from   -1.764 sec. to    2.588 sec.
Spectral model in the cutoff power-law:
------------------------------------------------------------
Parameters  : value       lower 90%   higher 90%
Photon index: 0.790401     ( -0.932859   0.760304 )
Epeak [keV] : 44.1773      ( -7.41601 12.1875 )
Norm@50keV  : 3.00947E-02    ( -0.0188746   0.0738189 )
------------------------------------------------------------
#Fit statistic : Chi-Squared =          39.51 using 59 PHA bins.
# Reduced chi-squared =         0.7056 for     56 degrees of freedom
# Null hypothesis probability =   9.534661e-01

Photon flux (15-150 keV)    in 4.352 sec: 0.926457 ( -0.08711  0.087153 ) ph/cm2/s
Energy fluence (15-150 keV)             : 2.3902e-07 ( -2.88555e-08  3.06712e-08 ) ergs/cm2
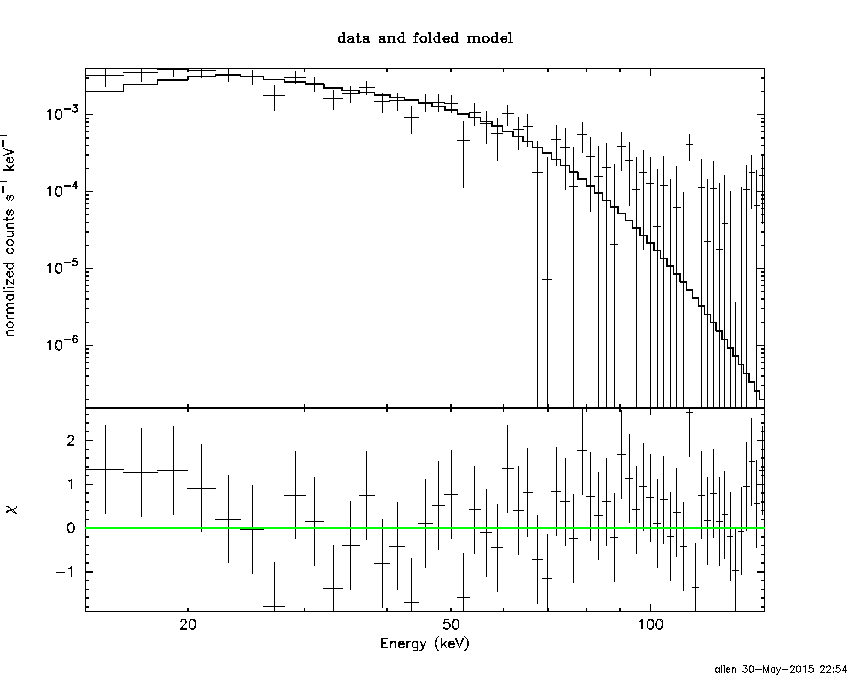
Band function
Time interval is from   -1.764 sec. to    2.588 sec.

Spectral model in the Band function:
------------------------------------------------------------
Parameters  : value       lower 90%   higher 90%
alpha       : -0.486648   ( -0.957807   1.83857 )
beta        : -2.74958    ( 2.74319   0.622363 )
Epeak [keV] : 41.5349      ( -9.8552 12.0105 )
Norm@50keV   : 4.70992E-02    ( -0.0273852   0.825019 )
------------------------------------------------------------
#Fit statistic : Chi-Squared =          38.75 using 59 PHA bins.
# Reduced chi-squared =         0.7045 for     55 degrees of freedom
# Null hypothesis probability =   9.525571e-01

Photon flux (15-150 keV)    in 4.352 sec:  (    ) ph/cm2/s
Energy fluence (15-150 keV)             : 2.4382e-07 ( -2.4379e-07  -2.98256e-08 ) ergs/cm2
Single BB
Spectral model blackbody:
------------------------------------------------------------
Parameters  : value    Lower 90%  Upper 90%
kT [keV]    : 10.4904  (-0.936319  1.03468)
R^2/D10^2   : 0.385874  (-0.116914   0.165748)
(R is the radius in km and D10 is the distance to the source in units of 10 kpc)
------------------------------------------------------------
#Fit statistic : Chi-Squared =          52.45 using 59 PHA bins.
# Reduced chi-squared =         0.9201 for     57 degrees of freedom
# Null hypothesis probability =   6.462779e-01

Energy  Fluence     90% Error
[keV]   [erg/cm2]   [erg/cm2]
15- 25  3.819e-08   5.512e-09
25- 50  1.014e-07   1.044e-08
50-150  6.072e-08   1.351e-08
15-150  2.004e-07   2.128e-08
Thermal bremsstrahlung (OTTB)
Spectral model: thermal bremsstrahlung
------------------------------------------------------------
Parameters  : value         Lower 90%    Upper 90%
kT [keV]    : 71.4383       (-16.3891      24.8704)
Norm        : 4.74724       (-0.611765     0.716439)
------------------------------------------------------------
#Fit statistic : Chi-Squared =          40.66 using 59 PHA bins.
# Reduced chi-squared =         0.7134 for     57 degrees of freedom
# Null hypothesis probability =   9.497718e-01

Energy  Fluence     90% Error
[keV]   [erg/cm2]   [erg/cm2]
15- 25  5.312e-08   6.093e-09
25- 50  8.497e-08   7.572e-09
50-150  1.108e-07   2.450e-08
15-150  2.489e-07   2.748e-08
Double BB
------------------------------------------------------------
Parameters  : value         Lower 90%    Upper 90%
kT1 [keV]   : 7.11392        (      )
R1^2/D10^2  : 1.10812        (-0.662514      65.4601)
kT2 [keV]   : 18.6317        (-7.41335      -18.6028)
R2^2/D10^2  : 2.48894E-02    (-0.0250857   0.250107)
------------------------------------------------------------
#Fit statistic : Chi-Squared =          41.14 using 59 PHA bins.
#Fit statistic : Chi-Squared =          41.09 using 59 PHA bins.
# Reduced chi-squared =         0.7479 for     55 degrees of freedom
# Reduced chi-squared =         0.7471 for     55 degrees of freedom
# Null hypothesis probability =   9.174098e-01
# Null hypothesis probability =   9.182178e-01

Energy  Fluence     90% Error
[keV]   [erg/cm2]   [erg/cm2]
15- 25  4.847e-08   2.579e-08
25- 50  9.001e-08   4.578e-08
50-150  9.496e-08   5.345e-08
15-150  2.334e-07   1.201e-07
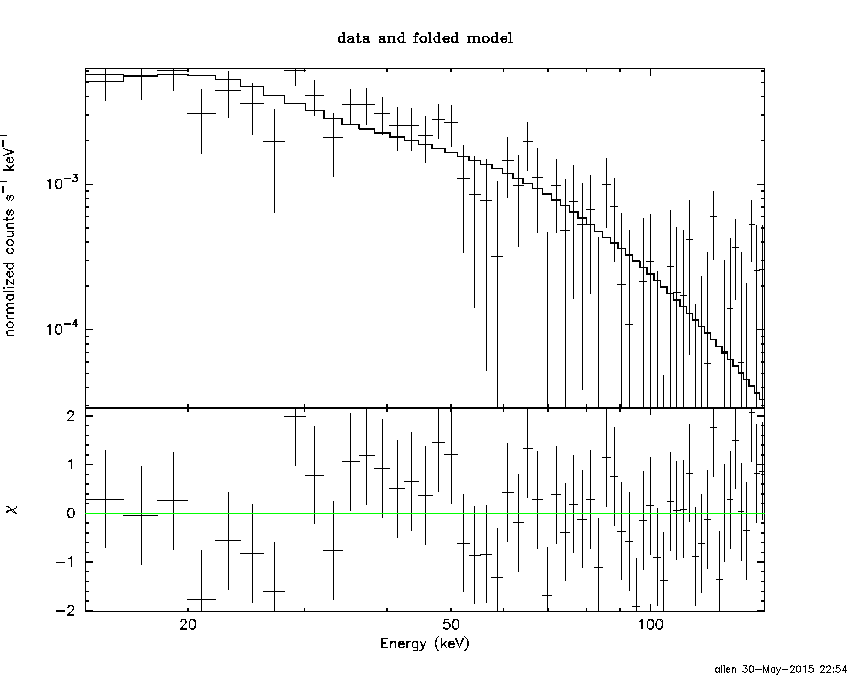
Peak spectrum fit
Power-law model
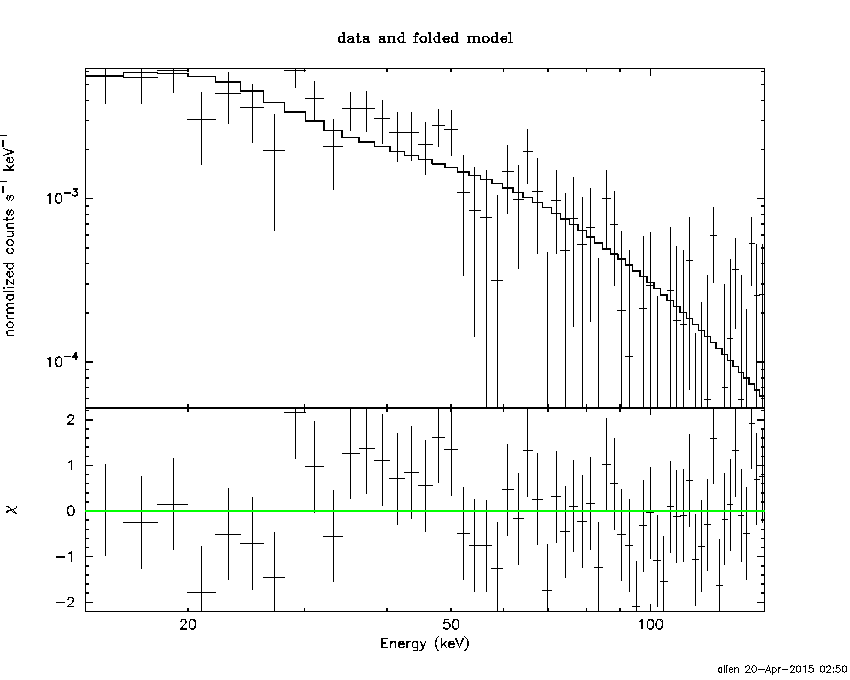
Time interval is from    0.256 sec. to    1.256 sec.

Spectral model in power-law:
------------------------------------------------------------
Parameters  : value       lower 90%   higher 90%
Photon index: 1.80949     ( -0.1971   0.206624 )
Norm@50keV  : 1.06269E-02    ( -0.00144085   0.00141541 )
------------------------------------------------------------
#Fit statistic : Chi-Squared =          57.40 using 59 PHA bins.
# Reduced chi-squared =          1.007 for     57 degrees of freedom
# Null hypothesis probability =   4.601285e-01

Photon flux (15-150 keV)    in 1 sec: 1.46979 ( -0.174961  0.175057 ) ph/cm2/s
Energy fluence (15-150 keV)             : 9.78008e-08 ( -1.33179e-08  1.35226e-08 ) ergs/cm2
Cutoff power-law model
Time interval is from    0.256 sec. to    1.256 sec.
Spectral model in the cutoff power-law:
------------------------------------------------------------
Parameters  : value       lower 90%   higher 90%
Photon index: 0.196283     ( -1.56149   1.16142 )
Epeak [keV] : 48.6055      ( -7.87373 19.86 )
Norm@50keV  : 8.44253E-02    ( -0.0844885   0.550429 )
------------------------------------------------------------
#Fit statistic : Chi-Squared =          51.32 using 59 PHA bins.
# Reduced chi-squared =         0.9165 for     56 degrees of freedom
# Null hypothesis probability =   6.522156e-01

Photon flux (15-150 keV)    in 1 sec: 1.39419 ( -0.18437  0.18389 ) ph/cm2/s
Energy fluence (15-150 keV)             : 8.64081e-08 ( -1.38933e-08  1.53119e-08 ) ergs/cm2
Band function
Time interval is from    0.256 sec. to    1.256 sec.

Spectral model in the Band function:
------------------------------------------------------------
Parameters  : value       lower 90%   higher 90%
alpha       : 0.445061   ( -1.66631   2.54999 )
beta        : -2.67694    ( 2.68224   0.662276 )
Epeak [keV] : 43.6633      ( -8.51321 13.1364 )
Norm@50keV   : 0.214372    ( -0.213975   7.92093 )
------------------------------------------------------------
#Fit statistic : Chi-Squared =          50.53 using 59 PHA bins.
# Reduced chi-squared =         0.9187 for     55 degrees of freedom
# Null hypothesis probability =   6.460187e-01

Photon flux (15-150 keV)    in 1 sec:  (    ) ph/cm2/s
Energy fluence (15-150 keV)             : 8.98394e-08 ( 0  0 ) ergs/cm2
Single BB
Spectral model blackbody:
------------------------------------------------------------
Parameters  : value    Lower 90%  Upper 90%
kT [keV]    : 11.4940  (-1.28321  1.46667)
R^2/D10^2   : 0.437580  (-0.159678   0.243403)
(R is the radius in km and D10 is the distance to the source in units of 10 kpc)
------------------------------------------------------------
#Fit statistic : Chi-Squared =          54.54 using 59 PHA bins.
# Reduced chi-squared =         0.9569 for     57 degrees of freedom
# Null hypothesis probability =   5.677716e-01

Energy  Fluence     90% Error
[keV]   [erg/cm2]   [erg/cm2]
15- 25  1.217e-08   2.445e-09
25- 50  3.636e-08   4.745e-09
50-150  2.804e-08   8.125e-09
15-150  7.657e-08   1.249e-08
Thermal bremsstrahlung (OTTB)
Spectral model: thermal bremsstrahlung
------------------------------------------------------------
Parameters  : value         Lower 90%    Upper 90%
kT [keV]    : 91.3688       (-28.8389      56.5802)
Norm        : 6.73446       (-1.04643     1.26555)
------------------------------------------------------------
#Fit statistic : Chi-Squared =          53.70 using 59 PHA bins.
# Reduced chi-squared =         0.9421 for     57 degrees of freedom
# Null hypothesis probability =   5.996282e-01

Energy  Fluence     90% Error
[keV]   [erg/cm2]   [erg/cm2]
15- 25  1.758e-08   3.035e-09
25- 50  2.983e-08   4.135e-09
50-150  4.584e-08   2.072e-08
15-150  9.325e-08   2.398e-08
Double BB
------------------------------------------------------------
Parameters  : value         Lower 90%    Upper 90%
kT1 [keV]   : 1.62267        (-1.43287      3.16208)
R1^2/D10^2  : 2888.01        (      )
kT2 [keV]   : 12.1582        (-1.44159      2.09059)
R2^2/D10^2  : 0.342717    (-0.146825   0.212811)
------------------------------------------------------------
#Fit statistic : Chi-Squared =          49.54 using 59 PHA bins.
#Fit statistic : Chi-Squared =          49.51 using 59 PHA bins.
# Reduced chi-squared =         0.9008 for     55 degrees of freedom
# Reduced chi-squared =         0.9003 for     55 degrees of freedom
# Null hypothesis probability =   6.823434e-01
# Null hypothesis probability =   6.834462e-01

Energy  Fluence     90% Error
[keV]   [erg/cm2]   [erg/cm2]
15- 25  1.420e-08   3.284e-09
25- 50  3.439e-08   6.740e-09
50-150  3.058e-08   8.550e-09
15-150  7.916e-08   1.469e-08
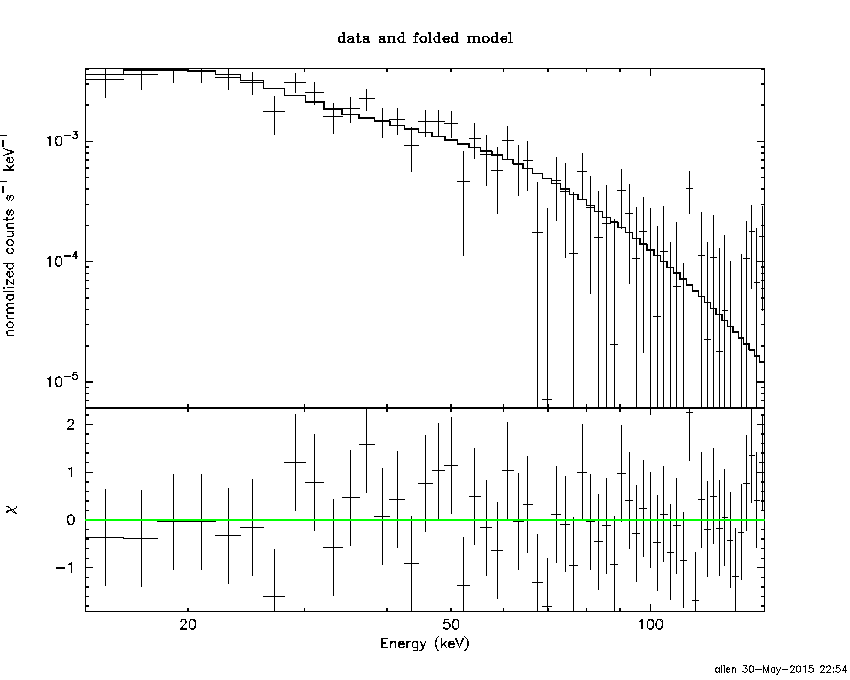
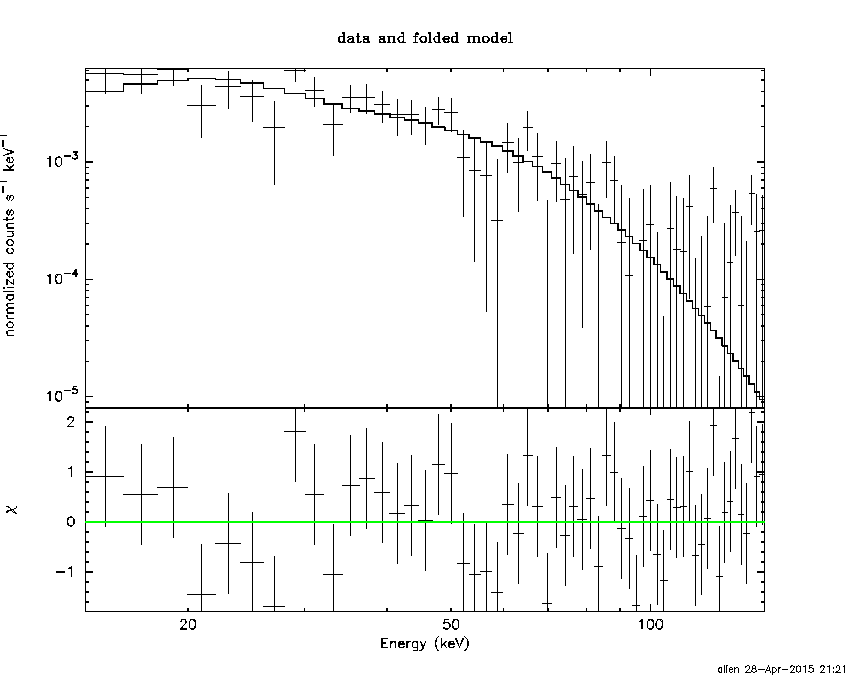
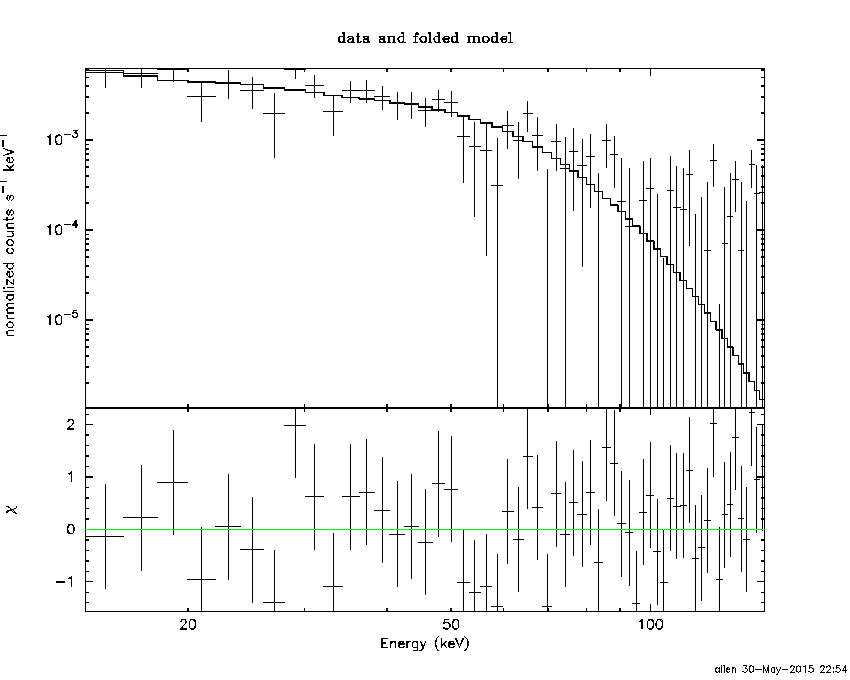
Pre-slew spectrum (Pre-slew PHA with pre-slew DRM)
Power-law model
Spectral model in power-law:
------------------------------------------------------------
Parameters  : value       lower 90%   higher 90%
Photon index: 1.94206     ( -0.151049   0.15735 )
Norm@50keV  : 6.60436E-03    ( -0.000688309   0.000677632 )
------------------------------------------------------------
#Fit statistic : Chi-Squared =          46.79 using 59 PHA bins.
# Reduced chi-squared =         0.8208 for     57 degrees of freedom
# Null hypothesis probability =   8.307482e-01

Photon flux (15-150 keV)    in 4.352 sec: 0.965172 ( -0.0835418  0.0835774 ) ph/cm2/s
Energy fluence (15-150 keV)             : 2.64446e-07 ( -2.6541e-08  2.69114e-08 ) ergs/cm2
Cutoff power-law model
Spectral model in the cutoff power-law:
------------------------------------------------------------
Parameters  : value       lower 90%   higher 90%
Photon index: 0.790401     ( -0.932859   0.760304 )
Epeak [keV] : 44.1773      ( -7.41601 12.1875 )
Norm@50keV  : 3.00947E-02    ( -0.0188746   0.0738189 )
------------------------------------------------------------
#Fit statistic : Chi-Squared =          39.51 using 59 PHA bins.
# Reduced chi-squared =         0.7056 for     56 degrees of freedom
# Null hypothesis probability =   9.534661e-01

Photon flux (15-150 keV)    in 4.352 sec: 0.926457 ( -0.08711  0.087153 ) ph/cm2/s
Energy fluence (15-150 keV)             : 2.3902e-07 ( -2.88555e-08  3.06712e-08 ) ergs/cm2
Band function

Spectral model in the Band function:
------------------------------------------------------------
Parameters  : value       lower 90%   higher 90%
alpha       : -0.486648   ( -0.957807   1.83857 )
beta        : -2.74958    ( 2.74319   0.622363 )
Epeak [keV] : 41.5349      ( -9.8552 12.0097 )
Norm@50keV   : 4.70992E-02    ( -0.0273852   0.825019 )
------------------------------------------------------------
#Fit statistic : Chi-Squared =          38.75 using 59 PHA bins.
# Reduced chi-squared =         0.7045 for     55 degrees of freedom
# Null hypothesis probability =   9.525571e-01

Photon flux (15-150 keV)    in 4.352 sec:  (    ) ph/cm2/s
Energy fluence (15-150 keV)             : 2.4382e-07 ( -2.4379e-07  -2.98256e-08 ) ergs/cm2
S(25-50 keV) vs. S(50-100 keV) plot
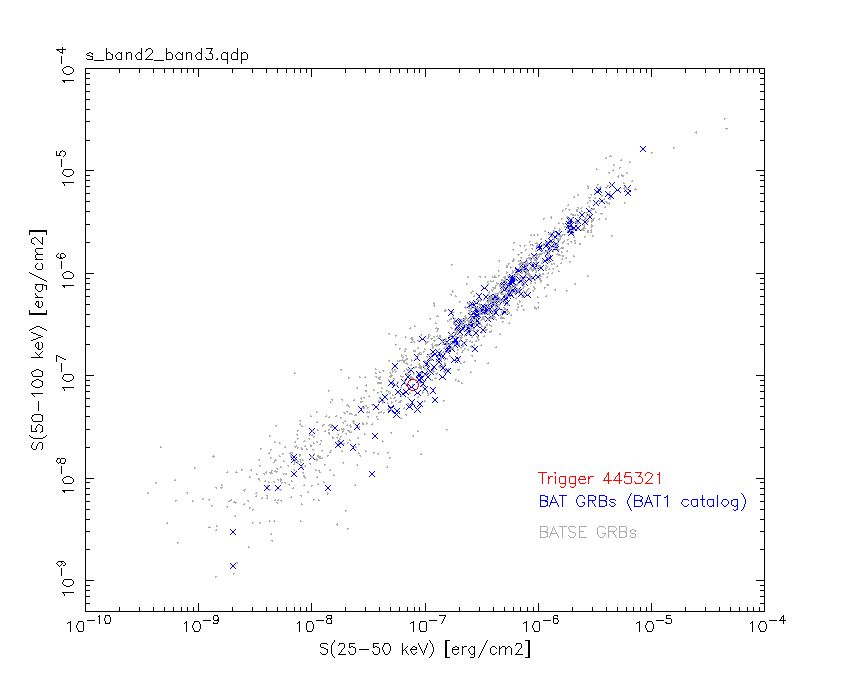
S(25-50 keV)  = 7.82e-08
S(50-100 keV) = 8.14e-08
T90 vs. Hardness ratio plot
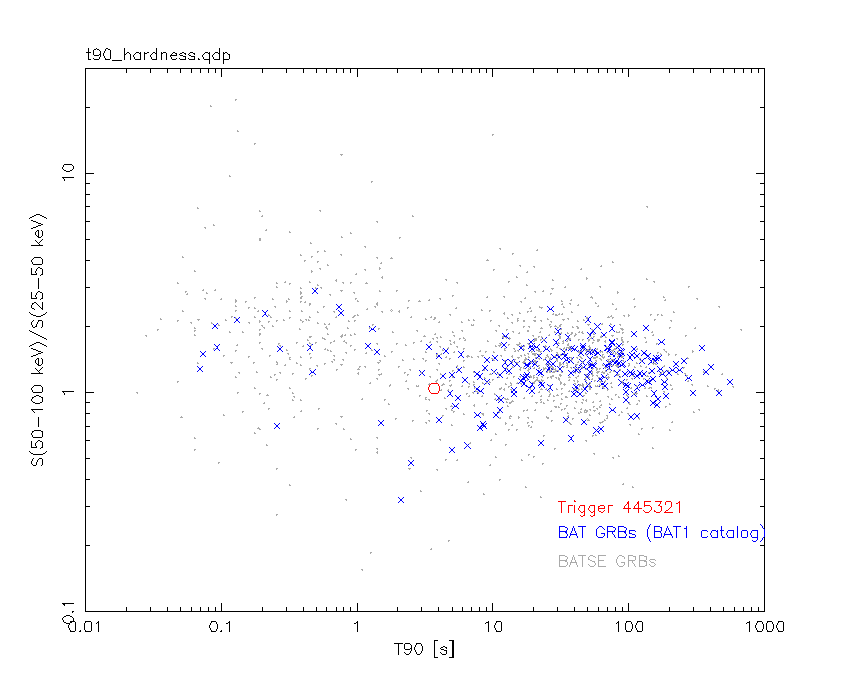
T90                                   = 3.69999998807907 sec.
Hardness ratio (energy fluence ratio) = 1.04092
Color vs. Color plot
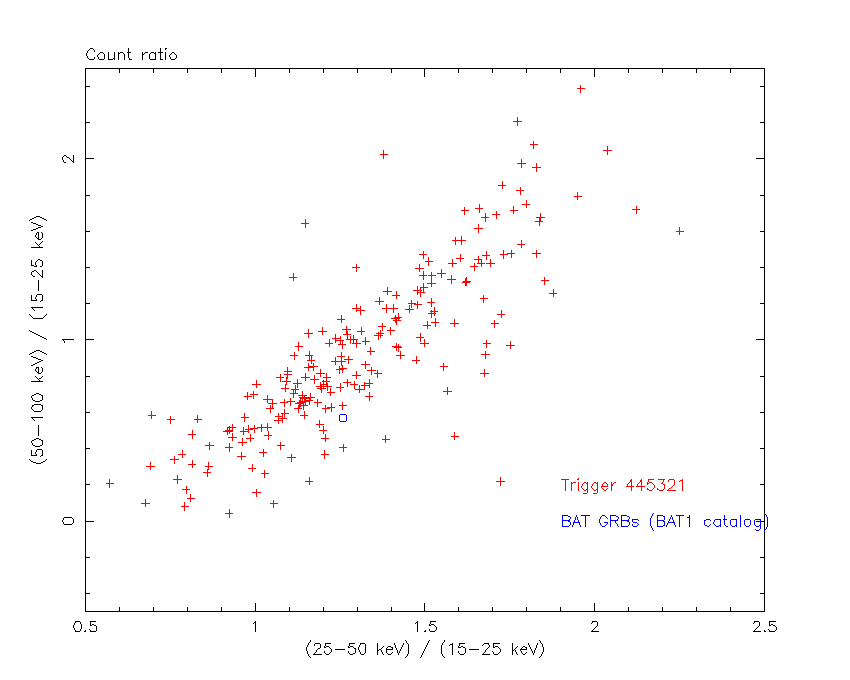
Count Ratio  (25-50 keV) / (15-25 keV) = 1.25876
Count Ratio (50-100 keV) / (15-25 keV) = 0.569195
Mask shadow pattern
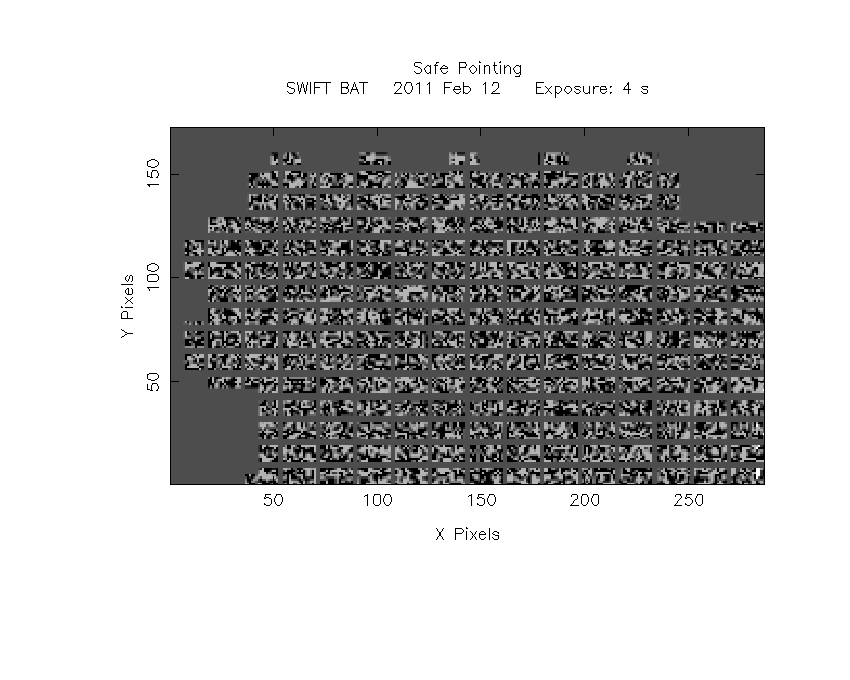
IMX = -5.977284130399158E-01, IMY = 2.767280725799086E-01
TIME vs. PHA plot around the trigger time
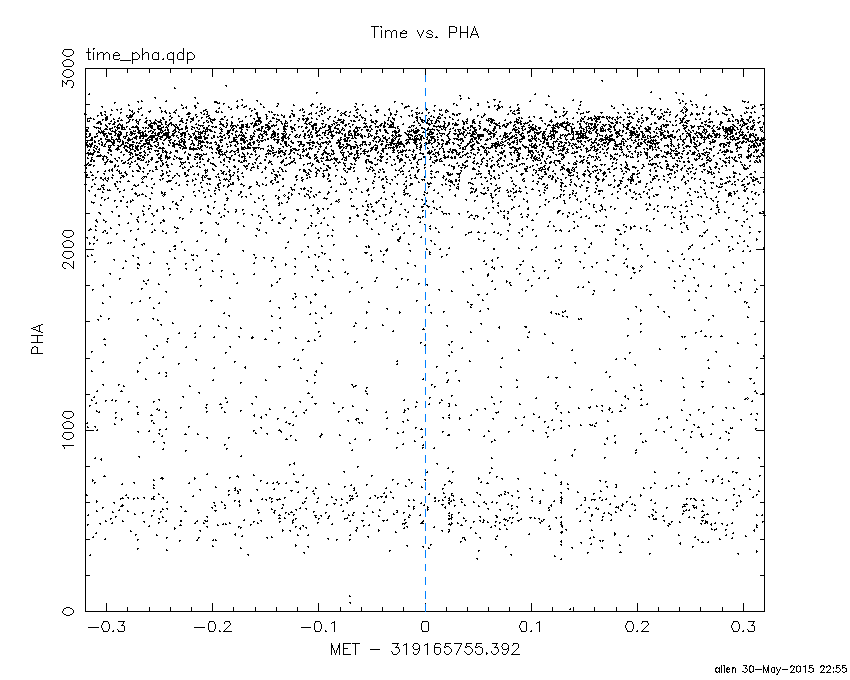
Blue+Cyan dotted lines: Time interval of the scaled map
From 0.000000 to 1.024000
TIME vs. DetID plot around the trigger time
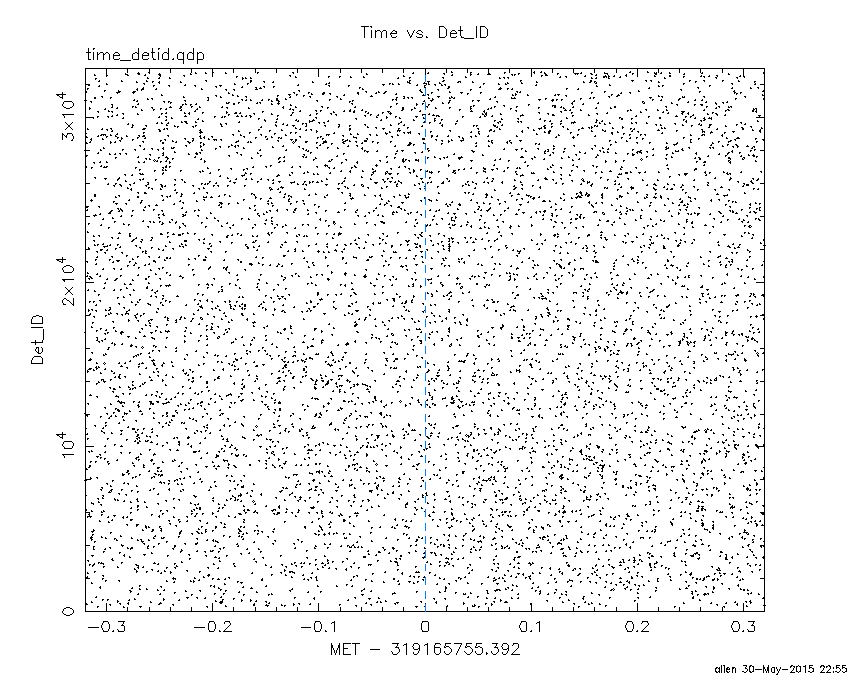
Blue+Cyan dotted lines: Time interval of the scaled map
From 0.000000 to 1.024000
100 us light curve (15-350 keV)
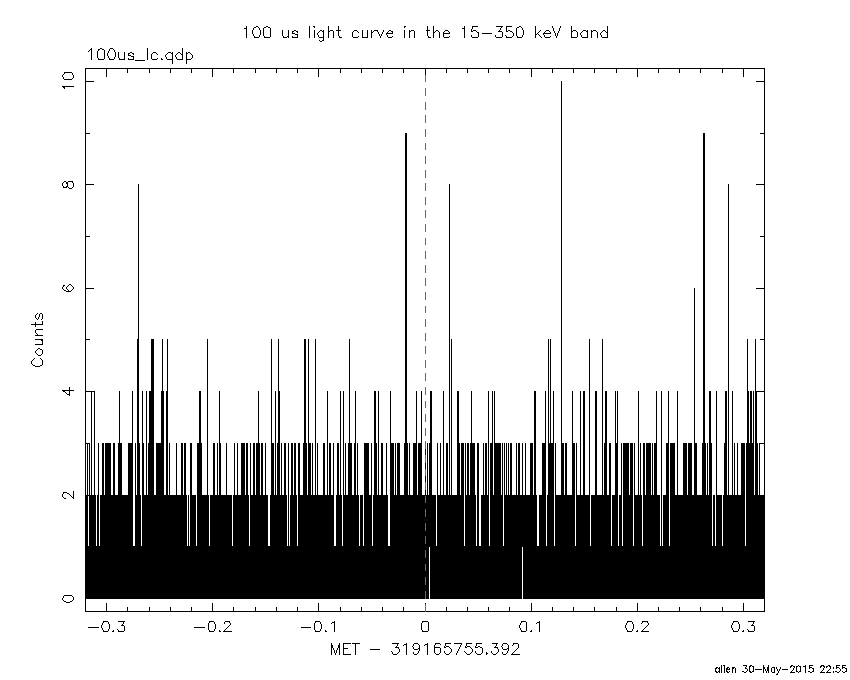
Blue+Cyan dotted lines: Time interval of the scaled map
From 0.000000 to 1.024000
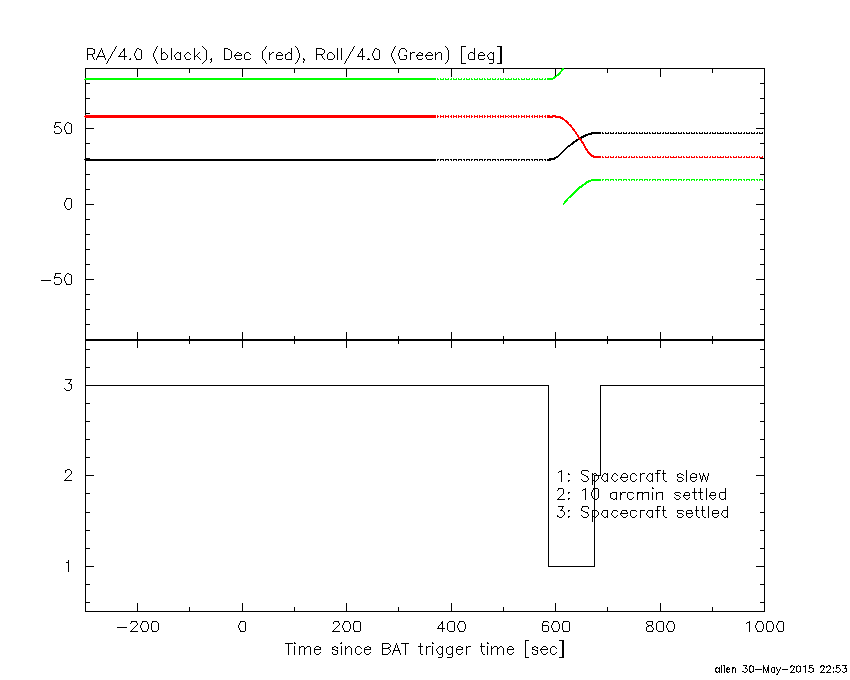
Spacecraft aspect plot
Bright source in the pre-burst/pre-slew/post-slew images
Pre-burst image of 15-350 keV band
Time interval of the image:
-239.392000 -1.764000

# RAcent  DECcent POSerr Theta    Phi  PeakCts   SNR AngSep     Name
#  [deg]    [deg]    ['] [deg]  [deg]                   [']
 83.6432  22.0026    0.5  43.9  168.1   9.4266  24.6    0.9	Crab
142.6923  22.6297    2.3  39.5   81.9   3.4501   5.0 ------	UNKNOWN
202.1004  41.6524    2.2  52.6    7.7   2.9440   5.2 ------	UNKNOWN
158.5332  53.7991    2.2  22.5   22.0   0.8325   5.3 ------	UNKNOWN
265.8150  70.8018    2.5  49.0  -48.0   4.1061   4.7 ------	UNKNOWN
Pre-slew background subtracted image of 15-350 keV band
Time interval of the image:
-1.764000 2.588000

# RAcent  DECcent POSerr Theta    Phi  PeakCts   SNR AngSep     Name
#  [deg]    [deg]    ['] [deg]  [deg]                   [']
 83.4264  21.9655    0.0  44.1  168.4  -0.0862  -2.1   11.9	Crab
 74.9994  26.9521    2.3  43.4 -178.4   0.1733   5.0 ------	UNKNOWN
 69.0244  43.7153    0.6  33.4 -155.2   0.4870  18.4 ------	UNKNOWN
Post-slew image of 15-350 keV band
Time interval of the image:
674.808620 962.705100

# RAcent  DECcent POSerr Theta    Phi  PeakCts   SNR AngSep     Name
#  [deg]    [deg]    ['] [deg]  [deg]                   [']
187.7006 -21.6691    2.7  52.7   26.1   3.6943   4.4 ------	UNKNOWN
166.5391  50.9743    2.7  25.7  172.4   0.7705   4.2 ------	UNKNOWN
209.2002 -16.7968    1.7  51.8   -0.4   2.9416   7.0 ------	UNKNOWN
181.2971  43.6406    2.9  13.8 -176.9   0.6847   4.0 ------	UNKNOWN
200.2579  40.7856    2.0  13.7 -113.8   1.0295   5.7 ------	UNKNOWN
231.0718  -7.8214    2.8  56.3  -28.6   4.0112   4.1 ------	UNKNOWN
237.1265  32.5377    2.7  41.1  -80.2   3.5576   4.3 ------	UNKNOWN
Plot creation:
Sat May 30 22:55:37 EDT 2015