Special notes of this burst
Image
Pre-slew 15.0-350.0 keV image (Event data; DETECTION mask)
#   RAcent    DECcent   POSerr    Theta     Phi              Peak Cts       SNR   Name
   42.9725    49.2805   0.0092    48.4511    38.5090         8.5972114     20.949 TRIG_00445414

Foreground time interval of the image:
-31.192  13.109 (delta_t =  44.301 [sec])
Background time interval of the image:
-145.491 -31.192 (delta_t = 114.299 [sec])
Lightcurves
Notes:
- 1) All plots contain as much data as has been downloaded to date.
- 2) The mask-weighted light curves are using the flight position.
- 3) Multiple plots of different time binning/intervals are shown to cover all scenarios of short/long GRBs, rate/image triggers, and real/false positives.
- 4) For all the mask-weighted lightcurves, the y-axis units are counts/sec/det where a det is 0.4 x 0.4 = 0.16 sq cm.
- 5) The verticle lines correspond to following: green dotted lines are T50 interval, black dotted lines are T90 interval, blue solid line(s) is a spacecraft slew start time, and orange solid line(s) is a spacecraft slew end time.
- 6) Time of each bin is in the middle of the bin.
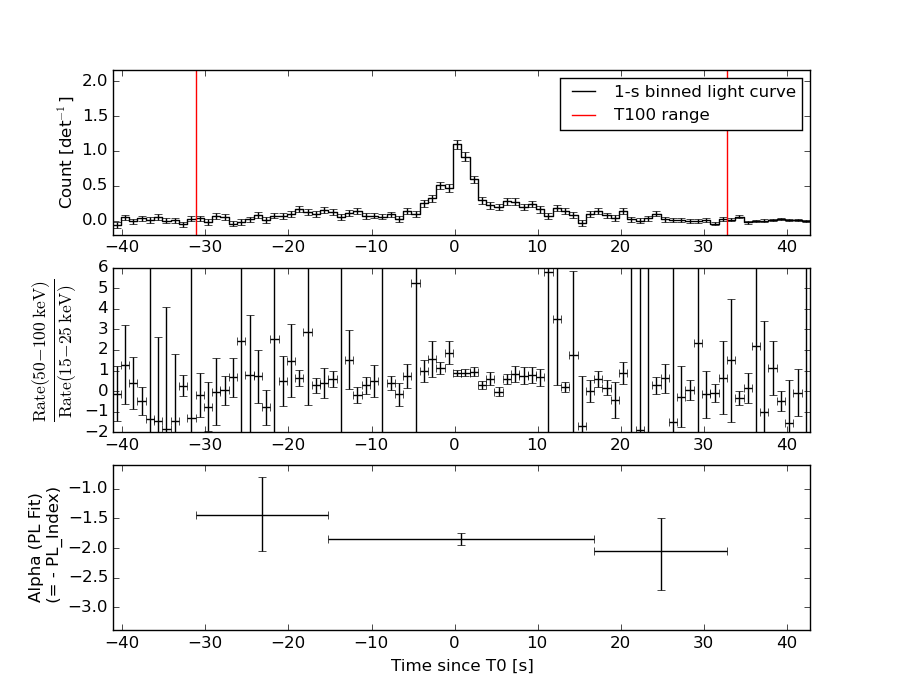
1 s binning
From T0-310 s to T0+310 s
From T100_start - 20 s to T100_end + 30 s
Full time interval

64 ms binning
Full time interval

From T100_start to T100_end

From T0-5 sec to T0+5 sec
16 ms binning
From T100_start-5 s to T100_start+5 s
Blue+Cyan dotted lines: Time interval of the scaled map
From 0.000000 to 1.024000
8 ms binning
From T100_start-3 s to T100_start+3 s
Blue+Cyan dotted lines: Time interval of the scaled map
From 0.000000 to 1.024000
2 ms binning
From T100_start-1 s to T100_start+1 s
Blue+Cyan dotted lines: Time interval of the scaled map
From 0.000000 to 1.024000
SN=5 or 10 sec. binning (whichever binning is satisfied first)
SN=5 or 10 sec. binning (T < 200 sec)
Quad-rate summed light curves (from T0-300s to T0+1000s)
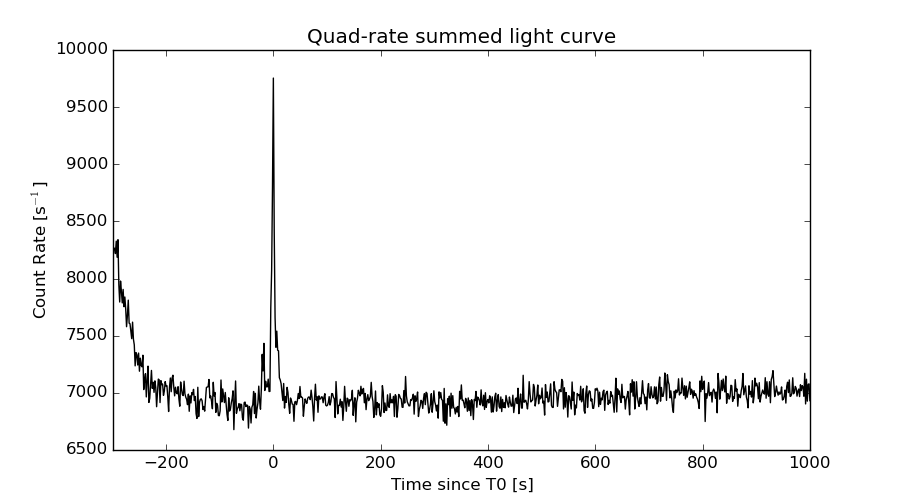
The mask-weighted light curves based on cleaned DPHs

Spectral Evolution
Spectra
Notes:
- 1) The fitting includes the systematic errors.
- 2) For long bursts, a spectral fit of the pre-slew DRM will introduce some errors in both a spectral shape and a normalization if the PHA file contains a lot of the slew/post-slew time interval.
- 3) For fits to more complicated models (e.g. a power-law over a cutoff power-law), the BAT team has decided to require a chi-square improvement of more than 6 for each extra dof.
- 4) For short bursts (T90<1sec), the specrtum is also fit with Blackbody, OTTB, and Double Blackbody.
Time averaged spectrum fit using the pre-slew DRM
Power-law model
Time interval is from  -31.192 sec. to   32.808 sec.

Spectral model in power-law:
------------------------------------------------------------
Parameters  : value       lower 90%   higher 90%
Photon index: 1.83120     ( -0.1139   0.116178 )
Norm@50keV  : 1.01317E-02    ( -0.000667229   0.000661633 )
------------------------------------------------------------
#Fit statistic : Chi-Squared =          59.81 using 59 PHA bins.
# Reduced chi-squared =          1.049 for     57 degrees of freedom
# Null hypothesis probability =   3.740528e-01

Photon flux (15-150 keV)    in 64 sec: 1.41338 ( -0.0914608  0.0918385 ) ph/cm2/s
Energy fluence (15-150 keV)             : 5.96417e-06 ( -3.95766e-07  3.9816e-07 ) ergs/cm2
Cutoff power-law model

Time interval is from  -31.192 sec. to   32.808 sec.
Spectral model in the cutoff power-law:
------------------------------------------------------------
Parameters  : value       lower 90%   higher 90%
Photon index: 2.06240     ( -0.128373   0.443824 )
Epeak [keV] : 27.7461      ( -9999.35 -9999.36 )
Norm@50keV  : 7.66067E-03    (     )
------------------------------------------------------------
#Fit statistic : Chi-Squared =          59.59 using 59 PHA bins.
# Reduced chi-squared =          1.064 for     56 degrees of freedom
# Null hypothesis probability =   3.465737e-01

Photon flux (15-150 keV)    in 64 sec: 1.41448 (    ) ph/cm2/s
Energy fluence (15-150 keV)             : 5.96202e-06 ( -3.99974e-07  3.94874e-07 ) ergs/cm2
Band function

Time interval is from  -31.192 sec. to   32.808 sec.

Spectral model in the Band function:
------------------------------------------------------------
Parameters  : value       lower 90%   higher 90%
alpha       : -1.62439   ( 1.62439   1.62439 )
beta        : -1.83120    ( -0.116349   0.113817 )
Epeak [keV] : 19.0479      ( -19.0397 -19.0397 )
Norm@50keV   : 1.72098E-02    ( -0.00637565   1.44976 )
------------------------------------------------------------
#Fit statistic : Chi-Squared =          59.81 using 59 PHA bins.
# Reduced chi-squared =          1.087 for     55 degrees of freedom
# Null hypothesis probability =   3.053824e-01

Photon flux (15-150 keV)    in 64 sec:  (    ) ph/cm2/s
Energy fluence (15-150 keV)             : 0 ( 0  0 ) ergs/cm2
Single BB

Spectral model blackbody:
------------------------------------------------------------
Parameters  : value    Lower 90%  Upper 90%
kT [keV]    : 12.2913  (  )
R^2/D10^2   : 0.295889  (   )
(R is the radius in km and D10 is the distance to the source in units of 10 kpc)
------------------------------------------------------------
#Fit statistic : Chi-Squared =         142.42 using 59 PHA bins.
# Reduced chi-squared =         2.4987 for     57 degrees of freedom
# Null hypothesis probability =   2.922459e-09

Energy  Fluence     90% Error
[keV]   [erg/cm2]   [erg/cm2]
15- 25  6.061e-07   7.126e-08
25- 50  1.961e-06   1.402e-07
50-150  1.810e-06   2.413e-07
15-150  4.377e-06   3.414e-07
Thermal bremsstrahlung (OTTB)

Spectral model: thermal bremsstrahlung
------------------------------------------------------------
Parameters  : value         Lower 90%    Upper 90%
kT [keV]    : 112.171       (-26.0584      32.8415)
Norm        : 5.92039       (-0.495996     0.654525)
------------------------------------------------------------
#Fit statistic : Chi-Squared =          65.16 using 59 PHA bins.
# Reduced chi-squared =          1.143 for     57 degrees of freedom
# Null hypothesis probability =   2.142015e-01

Energy  Fluence     90% Error
[keV]   [erg/cm2]   [erg/cm2]
15- 25  9.891e-07   1.034e-07
25- 50  1.748e-06   1.254e-07
50-150  3.015e-06   8.864e-07
15-150  5.753e-06   9.824e-07
Double BB

Spectral model: bbodyrad<1> + bbodyrad<2>
------------------------------------------------------------
Parameters  : value         Lower 90%    Upper 90%
kT1 [keV]   : 7.27980        (-1.21556      1.24434)
R1^2/D10^2  : 1.61294        (-0.674497      1.48656)
kT2 [keV]   : 30.2697        (-7.17119      14.4831)
R2^2/D10^2  : 7.97747E-03    (-0.00559524   0.0133385)
------------------------------------------------------------
#Fit statistic : Chi-Squared =          64.72 using 59 PHA bins.
# Reduced chi-squared =          1.177 for     55 degrees of freedom
# Null hypothesis probability =   1.735454e-01

Energy  Fluence     90% Error
[keV]   [erg/cm2]   [erg/cm2]
15- 25  9.864e-07   2.064e-07
25- 50  1.799e-06   2.822e-07
50-150  3.163e-06   1.085e-06
15-150  5.949e-06   1.519e-06
Peak spectrum fit
Power-law model
Time interval is from    8.308 sec. to    9.308 sec.

Spectral model in power-law:
------------------------------------------------------------
Parameters  : value       lower 90%   higher 90%
Photon index: 2.82425     ( -0.611469   0.964868 )
Norm@50keV  : 6.41579E-03    ( -0.00392741   0.00373941 )
------------------------------------------------------------
#Fit statistic : Chi-Squared =          48.10 using 59 PHA bins.
# Reduced chi-squared =         0.8438 for     57 degrees of freedom
# Null hypothesis probability =   7.933796e-01

Photon flux (15-150 keV)    in 1 sec: 1.55744 ( -0.621437  0.622355 ) ph/cm2/s
Energy fluence (15-150 keV)             : 7.15164e-08 ( -3.06405e-08  3.12943e-08 ) ergs/cm2
Cutoff power-law model

Time interval is from    8.308 sec. to    9.308 sec.
Spectral model in the cutoff power-law:
------------------------------------------------------------
Parameters  : value       lower 90%   higher 90%
Photon index: 0.839853     ( -4.47633   1.16793 )
Epeak [keV] : 26.6214      (   )
Norm@50keV  : 8.46814E-02    (     )
------------------------------------------------------------
#Fit statistic : Chi-Squared =          46.69 using 59 PHA bins.
# Reduced chi-squared =         0.8337 for     56 degrees of freedom
# Null hypothesis probability =   8.079234e-01

Photon flux (15-150 keV)    in 1 sec: 1.56370 ( -0.633079  0.62647 ) ph/cm2/s
Energy fluence (15-150 keV)             : 7.56276e-08 ( -3.0852e-08  3.15774e-08 ) ergs/cm2
Band function
Time interval is from    8.308 sec. to    9.308 sec.

Spectral model in the Band function:
------------------------------------------------------------
Parameters  : value       lower 90%   higher 90%
alpha       : -0.833414   ( -0.937019   1.05351 )
beta        : -10.0000    ( 10   1.77636e-15 )
Epeak [keV] : 26.5414      ( -16.844 22.2008 )
Norm@50keV   : 8.61027E-02    ( -0.0857627   10.9084 )
------------------------------------------------------------
#Fit statistic : Chi-Squared =          46.69 using 59 PHA bins.
# Reduced chi-squared =         0.8488 for     55 degrees of freedom
# Null hypothesis probability =   7.799636e-01

Photon flux (15-150 keV)    in 1 sec: 1.57001 ( 5.42999  -0.633153 ) ph/cm2/s
Energy fluence (15-150 keV)             : 7.55632e-08 ( -7.55562e-08  -3.08644e-08 ) ergs/cm2
Single BB

Spectral model blackbody:
------------------------------------------------------------
Parameters  : value    Lower 90%  Upper 90%
kT [keV]    : 10.1861  (-5.08041  3.31224)
R^2/D10^2   : 0.697146  (-0.696933   10.8068)
(R is the radius in km and D10 is the distance to the source in units of 10 kpc)
------------------------------------------------------------
#Fit statistic : Chi-Squared =          47.78 using 59 PHA bins.
# Reduced chi-squared =         0.8382 for     57 degrees of freedom
# Null hypothesis probability =   8.028759e-01

Energy  Fluence     90% Error
[keV]   [erg/cm2]   [erg/cm2]
15- 25  1.482e-08   9.815e-09
25- 50  3.781e-08   2.449e-08
50-150  2.081e-08   1.808e-08
15-150  7.344e-08   4.677e-08
Thermal bremsstrahlung (OTTB)

Spectral model: thermal bremsstrahlung
------------------------------------------------------------
Parameters  : value         Lower 90%    Upper 90%
kT [keV]    : 31.2511       (-16.9586      27.7682)
Norm        : 12.7054       (-6.51334     17.3194)
------------------------------------------------------------
#Fit statistic : Chi-Squared =          46.78 using 59 PHA bins.
# Reduced chi-squared =         0.8207 for     57 degrees of freedom
# Null hypothesis probability =   8.309879e-01

Energy  Fluence     90% Error
[keV]   [erg/cm2]   [erg/cm2]
15- 25  2.639e-08   1.601e-08
25- 50  3.083e-08   2.011e-08
50-150  1.780e-08   1.551e-08
15-150  7.502e-08   4.854e-08
Double BB

Spectral model: bbodyrad<1> + bbodyrad<2>
------------------------------------------------------------
Parameters  : value         Lower 90%    Upper 90%
kT1 [keV]   : 3.14007        (-3.12317      12.3244)
R1^2/D10^2  : 69.4860        (-70.8275      -70.8275)
kT2 [keV]   : 11.7145        (-4.1376      61.6906)
R2^2/D10^2  : 0.323653    (-0.327347   1.67925)
------------------------------------------------------------
#Fit statistic : Chi-Squared =          45.39 using 59 PHA bins.
# Reduced chi-squared =         0.8252 for     55 degrees of freedom
# Null hypothesis probability =   8.189585e-01

Energy  Fluence     90% Error
[keV]   [erg/cm2]   [erg/cm2]
15- 25  2.652e-08   1.258e-08
25- 50  3.158e-08   2.056e-08
50-150  2.327e-08   1.756e-08
15-150  8.138e-08   4.841e-08
Pre-slew spectrum (Pre-slew PHA with pre-slew DRM)
Power-law model
Spectral model in power-law:
------------------------------------------------------------
Parameters  : value       lower 90%   higher 90%
Photon index: 1.77650     ( -0.111795   0.113691 )
Norm@50keV  : 1.33172E-02    ( -0.000850118   0.000844629 )
------------------------------------------------------------
#Fit statistic : Chi-Squared =          62.18 using 59 PHA bins.
# Reduced chi-squared =          1.091 for     57 degrees of freedom
# Null hypothesis probability =   2.969536e-01

Photon flux (15-150 keV)    in 44.3 sec: 1.81863 ( -0.116887  0.117387 ) ph/cm2/s
Energy fluence (15-150 keV)             : 5.43627e-06 ( -3.5494e-07  3.56822e-07 ) ergs/cm2
Cutoff power-law model
Spectral model in the cutoff power-law:
------------------------------------------------------------
Parameters  : value       lower 90%   higher 90%
Photon index: 2.04416     ( -0.335668   0.112093 )
Epeak [keV] : 19.3344      ( -9999.35 -9999.36 )
Norm@50keV  : 9.56328E-03    ( -0.000764952   0.00136208 )
------------------------------------------------------------
#Fit statistic : Chi-Squared =          61.82 using 59 PHA bins.
# Reduced chi-squared =          1.104 for     56 degrees of freedom
# Null hypothesis probability =   2.760923e-01

Photon flux (15-150 keV)    in 44.3 sec: 1.81819 ( -0.11715  0.0579 ) ph/cm2/s
Energy fluence (15-150 keV)             : 5.4341e-06 ( -3.39028e-07  3.5378e-07 ) ergs/cm2
Band function

Spectral model in the Band function:
------------------------------------------------------------
Parameters  : value       lower 90%   higher 90%
alpha       : -1.53765   ( 1.53766   1.53766 )
beta        : -1.77650    ( -0.113778   0.111761 )
Epeak [keV] : 21.8767      ( -21.8749 -21.8749 )
Norm@50keV   : 2.41215E-02    ( -0.0116079   1478 )
------------------------------------------------------------
#Fit statistic : Chi-Squared =          62.18 using 59 PHA bins.
# Reduced chi-squared =          1.131 for     55 degrees of freedom
# Null hypothesis probability =   2.358253e-01

Photon flux (15-150 keV)    in 44.3 sec:  (    ) ph/cm2/s
Energy fluence (15-150 keV)             : 0 ( 0  0 ) ergs/cm2
S(25-50 keV) vs. S(50-100 keV) plot

S(25-50 keV)  = 1.70e-06
S(50-100 keV) = 1.91e-06
T90 vs. Hardness ratio plot
T90                                   = 48 sec.
Hardness ratio (energy fluence ratio) = 1.12353
Color vs. Color plot

Count Ratio  (25-50 keV) / (15-25 keV) = 1.22211
Count Ratio (50-100 keV) / (15-25 keV) = 0.764685
Mask shadow pattern (with DETECTION mask)
IMX = 8.829483902278739E-01, IMY = -7.025551529741617E-01
TIME vs. PHA plot around the trigger time

Blue+Cyan dotted lines: Time interval of the scaled map
From 0.000000 to 1.024000
TIME vs. DetID plot around the trigger time
Blue+Cyan dotted lines: Time interval of the scaled map
From 0.000000 to 1.024000
100 us light curve (15-350 keV)

Blue+Cyan dotted lines: Time interval of the scaled map
From 0.000000 to 1.024000
Spacecraft aspect plot
Bright source in the pre-burst/pre-slew/post-slew images
Pre-burst image of 15-350 keV band
Time interval of the image:
-145.491400 -31.192000

# RAcent  DECcent POSerr Theta    Phi  PeakCts   SNR AngSep     Name
#  [deg]    [deg]    ['] [deg]  [deg]                   [']
326.3395  38.2884    5.6  51.8  -33.9   0.7584   2.0    8.2	Cyg X-2
 53.0041  16.1988    2.2  39.9   86.8   2.1198   5.4 ------	UNKNOWN
  5.6208 -23.0657    2.7  31.7 -154.3   0.5088   4.3 ------	UNKNOWN
329.0934  14.7738    2.7  43.6  -64.1   1.9936   4.2 ------	UNKNOWN
Pre-slew background subtracted image of 15-350 keV band
Time interval of the image:
-31.192000 13.108600

# RAcent  DECcent POSerr Theta    Phi  PeakCts   SNR AngSep     Name
#  [deg]    [deg]    ['] [deg]  [deg]                   [']
325.9951  38.3750    0.0  52.1  -33.9   0.3860   1.5    8.9	Cyg X-2
 42.9771  49.2782    0.6  48.5   38.5   9.3357  18.6 ------	UNKNOWN
 41.7950  -0.2338    2.4  29.8  117.1   0.6163   4.9 ------	UNKNOWN
325.2635  27.1296    2.4  49.1  -48.0   1.5890   4.8 ------	UNKNOWN
Post-slew image of 15-350 keV band
Time interval of the image:
80.508640 962.830400

# RAcent  DECcent POSerr Theta    Phi  PeakCts   SNR AngSep     Name
#  [deg]    [deg]    ['] [deg]  [deg]                   [']
 83.6508  22.0192    0.5  42.0  134.6  35.7860  24.2    1.0	Crab
154.7152  73.5281    2.9  48.8   39.6   8.8294   4.0 ------	UNKNOWN
 73.2223   9.7775    2.5  46.9  156.2   6.7668   4.6 ------	UNKNOWN
343.7541  74.5679    2.7  35.0   -4.4   2.6867   4.3 ------	UNKNOWN
 30.5394  48.2188    2.9   8.2  -73.7   1.6371   4.0 ------	UNKNOWN
Plot creation:
Fri Dec 18 19:44:30 EST 2015