Click here for the BAT GCN circular template
Image
Pre-slew 15.0-350.0 keV image (Event data)
#   RAcent    DECcent   POSerr    Theta     Phi              Peak Cts       SNR   Name
  150.3180   -68.3146   0.0139     8.6355   173.3767         1.0596356     13.883 TRIG_00446677

Foreground time interval of the image:
-45.792  19.312 (delta_t =  65.104 [sec])
Background time interval of the image:
-239.752 -45.792 (delta_t = 193.960 [sec])
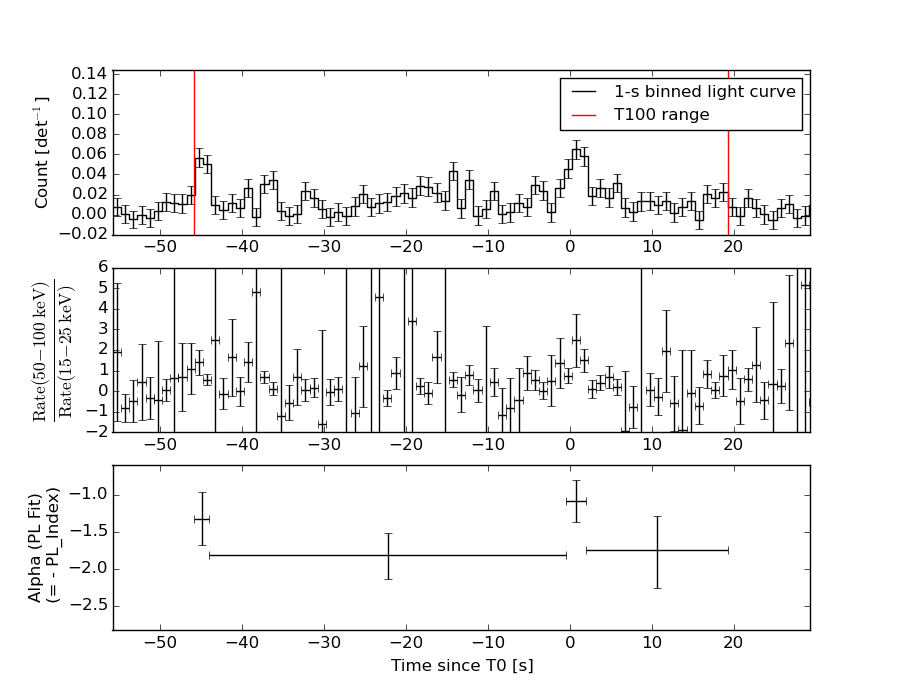
Lightcurves
Notes:
- 1) The mask-weighted light curves are using the flight position.
- 2) Multiple plots of different time binning/intervals are shown to cover all scenarios of short/long GRBs, rate/image triggers, and real/false positives.
- 3) For all the mask-weighted lightcurves, the y-axis units are counts/sec/det where a det is 0.4 x 0.4 = 0.16 sq cm.
- 4) The verticle lines correspond to following: green dotted lines are T50 interval, black dotted lines are T90 interval, blue solid line(s) is a spacecraft slew start time, and orange solid line(s) is a spacecraft slew end time.
- 5) Time of each bin is in the middle of the bin.
1 s binning
From T0-310 s to T0+310 s

From T100_start - 20 s to T100_end + 30 s
Full time interval
64 ms binning
Full time interval

From T100_start to T100_end
From T0-5 sec to T0+5 sec
16 ms binning
From T100_start-5 s to T100_start+5 s

8 ms binning
From T100_start-3 s to T100_start+3 s
2 ms binning
From T100_start-1 s to T100_start+1 s
SN=5 or 10 sec. binning (whichever binning is satisfied first)
SN=5 or 10 sec. binning (T < 200 sec)
Quad-rate summed light curves (from T0-300s to T0+1000s)

The mask-weighted light curves based on cleaned DPHs

Spectral Evolution
Spectra
Notes:
- 1) The fitting includes the systematic errors.
- 2) When the burst includes telescope slew time periods, the fitting uses an average response file made from multiple 5-s response files through out the slew time plus single time preiod for the non-slew times, and weighted by the total counts in the corresponding time period using addrmf. An average response file is needed becuase a spectral fit using the pre-slew DRM will introduce some errors in both a spectral shape and a normalization if the PHA file contains a lot of the slew/post-slew time interval.
- 3) For fits to more complicated models (e.g. a power-law over a cutoff power-law), the BAT team has decided to require a chi-square improvement of more than 6 for each extra dof.
Time averaged spectrum fit using the average DRM
Power-law model

Time interval is from  -45.792 sec. to   19.312 sec.

Spectral model in power-law:
------------------------------------------------------------
Parameters  : value       lower 90%   higher 90%
Photon index: 1.65211     ( -0.20646   0.211822 )
Norm@50keV  : 1.00924E-03    ( -0.000124899   0.000121976 )
------------------------------------------------------------
#Fit statistic : Chi-Squared =          50.60 using 59 PHA bins.
# Reduced chi-squared =         0.8877 for     57 degrees of freedom
# Null hypothesis probability =   7.124045e-01

Photon flux (15-150 keV)    in 65.1 sec: 0.131873 ( -0.0142617  0.0142694 ) ph/cm2/s
Energy fluence (15-150 keV)             : 6.1092e-07 ( -8.0431e-08  8.20807e-08 ) ergs/cm2
Cutoff power-law model

Time interval is from  -45.792 sec. to   19.312 sec.
Spectral model in the cutoff power-law:
------------------------------------------------------------
Parameters  : value       lower 90%   higher 90%
Photon index: 1.65836     ( -0.214643   0.205987 )
Epeak [keV] : 9999.33      ( -9999.35 -9999.36 )
Norm@50keV  : 1.00882E-03    (     )
------------------------------------------------------------
#Fit statistic : Chi-Squared =          50.61 using 59 PHA bins.
# Reduced chi-squared =         0.9038 for     56 degrees of freedom
# Null hypothesis probability =   6.782889e-01

Photon flux (15-150 keV)    in 65.1 sec: 0.131962 ( -0.014377  0.014196 ) ph/cm2/s
Energy fluence (15-150 keV)             : 6.10862e-07 ( -8.04649e-08  7.86838e-08 ) ergs/cm2
Band function

Time interval is from  -45.792 sec. to   19.312 sec.

Spectral model in the Band function:
------------------------------------------------------------
Parameters  : value       lower 90%   higher 90%
alpha       : 4.95975   ( -4.95975   -4.95975 )
beta        : -1.68262    ( -0.24798   0.217905 )
Epeak [keV] : 19.1772      ( -19.1772 5.99666 )
Norm@50keV   : 613.153    ( -65.9655   746556 )
------------------------------------------------------------
#Fit statistic : Chi-Squared =          50.45 using 59 PHA bins.
# Reduced chi-squared =         0.9172 for     55 degrees of freedom
# Null hypothesis probability =   6.490663e-01

Photon flux (15-150 keV)    in 65.1 sec:  (    ) ph/cm2/s
Energy fluence (15-150 keV)             : 0 ( 0  0 ) ergs/cm2
Single BB

Spectral model blackbody:
------------------------------------------------------------
Parameters  : value    Lower 90%  Upper 90%
kT [keV]    : 11.2345  (-1.72741  2.22987)
R^2/D10^2   : 3.88265E-02  (-0.0185726   0.033022)
(R is the radius in km and D10 is the distance to the source in units of 10 kpc)
------------------------------------------------------------
#Fit statistic : Chi-Squared =          83.70 using 59 PHA bins.
# Reduced chi-squared =          1.468 for     57 degrees of freedom
# Null hypothesis probability =   1.216757e-02

Energy  Fluence     90% Error
[keV]   [erg/cm2]   [erg/cm2]
15- 25  6.692e-08   1.461e-08
25- 50  1.944e-07   2.819e-08
50-150  1.408e-07   3.893e-08
15-150  4.021e-07   6.497e-08
Thermal bremsstrahlung (OTTB)

Spectral model: thermal bremsstrahlung
------------------------------------------------------------
Parameters  : value         Lower 90%    Upper 90%
kT [keV]    : 159.276       (-69.9712      -160.367)
Norm        : 0.536332       (-0.0630906     0.0795113)
------------------------------------------------------------
#Fit statistic : Chi-Squared =          53.21 using 59 PHA bins.
# Reduced chi-squared =         0.9334 for     57 degrees of freedom
# Null hypothesis probability =   6.182140e-01

Energy  Fluence     90% Error
[keV]   [erg/cm2]   [erg/cm2]
15- 25  8.919e-08   4.850e-08
25- 50  1.667e-07   8.805e-08
50-150  3.372e-07   1.939e-07
15-150  5.931e-07   3.294e-07
Double BB
Spectral model: bbodyrad<1> + bbodyrad<2>
------------------------------------------------------------
Parameters  : value         Lower 90%    Upper 90%
kT1 [keV]   : 6.89436        (-1.5249      1.69594)
R1^2/D10^2  : 0.189675        (-0.103047      0.284647)
kT2 [keV]   : 41.1058        (-16.1824      100.33)
R2^2/D10^2  : 4.04814E-04    (-0.000363692   0.0014502)
------------------------------------------------------------
#Fit statistic : Chi-Squared =          48.66 using 59 PHA bins.
# Reduced chi-squared =         0.8847 for     55 degrees of freedom
# Null hypothesis probability =   7.141343e-01

Energy  Fluence     90% Error
[keV]   [erg/cm2]   [erg/cm2]
15- 25  9.842e-08   2.599e-08
25- 50  1.621e-07   5.732e-08
50-150  4.020e-07   2.197e-07
15-150  6.625e-07   2.619e-07
Peak spectrum fit
Power-law model
Time interval is from    0.992 sec. to    1.992 sec.

Spectral model in power-law:
------------------------------------------------------------
Parameters  : value       lower 90%   higher 90%
Photon index: 1.08048     ( -0.39534   0.382626 )
Norm@50keV  : 5.03971E-03    ( -0.000997909   0.000994747 )
------------------------------------------------------------
#Fit statistic : Chi-Squared =          67.63 using 59 PHA bins.
# Reduced chi-squared =          1.186 for     57 degrees of freedom
# Null hypothesis probability =   1.583756e-01

Photon flux (15-150 keV)    in 1 sec: 0.583509 ( -0.118698  0.119092 ) ph/cm2/s
Energy fluence (15-150 keV)             : 5.30254e-08 ( -1.16998e-08  1.18243e-08 ) ergs/cm2
Cutoff power-law model
Time interval is from    0.992 sec. to    1.992 sec.
Spectral model in the cutoff power-law:
------------------------------------------------------------
Parameters  : value       lower 90%   higher 90%
Photon index: 1.07159     ( -0.395808   0.388049 )
Epeak [keV] : 9999.35      ( -9999.36 -9999.36 )
Norm@50keV  : 5.06597E-03    ( -0.000995866   0.0101885 )
------------------------------------------------------------
#Fit statistic : Chi-Squared =          67.64 using 59 PHA bins.
# Reduced chi-squared =          1.208 for     56 degrees of freedom
# Null hypothesis probability =   1.370845e-01

Photon flux (15-150 keV)    in 1 sec: 0.584805 ( -0.119817  0.117653 ) ph/cm2/s
Energy fluence (15-150 keV)             : 5.2569e-08 ( -1.12727e-08  1.22036e-08 ) ergs/cm2
Band function

Time interval is from    0.992 sec. to    1.992 sec.

Spectral model in the Band function:
------------------------------------------------------------
Parameters  : value       lower 90%   higher 90%
alpha       : -0.913288   ( 0.913287   0.913287 )
beta        : -1.08049    ( 1.08049   0.395359 )
Epeak [keV] : 42.6345      ( -42.6344 -42.6344 )
Norm@50keV   : 8.36584E-03    ( -0.00431696   0.811912 )
------------------------------------------------------------
#Fit statistic : Chi-Squared =          67.63 using 59 PHA bins.
# Reduced chi-squared =          1.230 for     55 degrees of freedom
# Null hypothesis probability =   1.179869e-01

Photon flux (15-150 keV)    in 1 sec:  (    ) ph/cm2/s
Energy fluence (15-150 keV)             : 0 ( 0  0 ) ergs/cm2
Single BB
Spectral model blackbody:
------------------------------------------------------------
Parameters  : value    Lower 90%  Upper 90%
kT [keV]    : 24.1389  (-5.7975  8.99424)
R^2/D10^2   : 1.51444E-02  (-0.00926429   0.0205941)
(R is the radius in km and D10 is the distance to the source in units of 10 kpc)
------------------------------------------------------------
#Fit statistic : Chi-Squared =          73.30 using 59 PHA bins.
# Reduced chi-squared =          1.286 for     57 degrees of freedom
# Null hypothesis probability =   7.181406e-02

Energy  Fluence     90% Error
[keV]   [erg/cm2]   [erg/cm2]
15- 25  1.561e-09   7.212e-10
25- 50  8.697e-09   3.435e-09
50-150  3.774e-08   1.666e-08
15-150  4.799e-08   1.791e-08
Thermal bremsstrahlung (OTTB)
Spectral model: thermal bremsstrahlung
------------------------------------------------------------
Parameters  : value         Lower 90%    Upper 90%
kT [keV]    : 200.000       (      )
Norm        : 2.38613       (-0.487038     0.487007)
------------------------------------------------------------
#Fit statistic : Chi-Squared =          72.68 using 59 PHA bins.
# Reduced chi-squared =          1.275 for     57 degrees of freedom
# Null hypothesis probability =   7.878464e-02

Energy  Fluence     90% Error
[keV]   [erg/cm2]   [erg/cm2]
15- 25  5.944e-09   3.487e-09
25- 50  1.143e-08   6.645e-09
50-150  2.508e-08   1.459e-08
15-150  4.246e-08   2.439e-08
Double BB
Spectral model: bbodyrad<1> + bbodyrad<2>
------------------------------------------------------------
Parameters  : value         Lower 90%    Upper 90%
kT1 [keV]   : 2.81540        (-1.56628      2.6392)
R1^2/D10^2  : 35.5755        (-34.3032      28686.8)
kT2 [keV]   : 28.2681        (-7.28942      13.5422)
R2^2/D10^2  : 8.94660E-03    (-0.00598834   0.0130909)
------------------------------------------------------------
#Fit statistic : Chi-Squared =          62.81 using 59 PHA bins.
# Reduced chi-squared =          1.142 for     55 degrees of freedom
# Null hypothesis probability =   2.191872e-01

Energy  Fluence     90% Error
[keV]   [erg/cm2]   [erg/cm2]
15- 25  5.593e-09   2.969e-09
25- 50  7.487e-09   4.014e-09
50-150  4.018e-08   2.262e-08
15-150  5.326e-08   2.672e-08
Pre-slew spectrum (Pre-slew PHA with pre-slew DRM)
Power-law model

Spectral model in power-law:
------------------------------------------------------------
Parameters  : value       lower 90%   higher 90%
Photon index: 1.65211     ( -0.20646   0.211822 )
Norm@50keV  : 1.00924E-03    ( -0.000124899   0.000121976 )
------------------------------------------------------------
#Fit statistic : Chi-Squared =          50.60 using 59 PHA bins.
# Reduced chi-squared =         0.8877 for     57 degrees of freedom
# Null hypothesis probability =   7.124045e-01

Photon flux (15-150 keV)    in 65.1 sec: 0.131873 ( -0.0142617  0.0142694 ) ph/cm2/s
Energy fluence (15-150 keV)             : 6.1092e-07 ( -8.0431e-08  8.20807e-08 ) ergs/cm2
Cutoff power-law model
Spectral model in the cutoff power-law:
------------------------------------------------------------
Parameters  : value       lower 90%   higher 90%
Photon index: 1.65836     ( -0.214643   0.205987 )
Epeak [keV] : 9999.33      ( -9999.35 -9999.36 )
Norm@50keV  : 1.00882E-03    (     )
------------------------------------------------------------
#Fit statistic : Chi-Squared =          50.61 using 59 PHA bins.
# Reduced chi-squared =         0.9038 for     56 degrees of freedom
# Null hypothesis probability =   6.782889e-01

Photon flux (15-150 keV)    in 65.1 sec: 0.131962 ( -0.014377  0.014196 ) ph/cm2/s
Energy fluence (15-150 keV)             : 6.10862e-07 ( -8.04649e-08  7.86838e-08 ) ergs/cm2
Band function

Spectral model in the Band function:
------------------------------------------------------------
Parameters  : value       lower 90%   higher 90%
alpha       : 4.95975   ( -4.95975   -4.95975 )
beta        : -1.68262    ( -0.24798   0.217905 )
Epeak [keV] : 19.1772      ( -19.1772 5.99666 )
Norm@50keV   : 613.153    ( -65.9655   746556 )
------------------------------------------------------------
#Fit statistic : Chi-Squared =          50.45 using 59 PHA bins.
# Reduced chi-squared =         0.9172 for     55 degrees of freedom
# Null hypothesis probability =   6.490663e-01

Photon flux (15-150 keV)    in 65.1 sec:  (    ) ph/cm2/s
Energy fluence (15-150 keV)             : 0 ( 0  0 ) ergs/cm2
S(25-50 keV) vs. S(50-100 keV) plot

S(25-50 keV)  = 1.62e-07
S(50-100 keV) = 2.06e-07
T90 vs. Hardness ratio plot
T90                                   = 61.4479999542236 sec.
Hardness ratio (energy fluence ratio) = 1.2716
Color vs. Color plot

Count Ratio  (25-50 keV) / (15-25 keV) = 1.05864
Count Ratio (50-100 keV) / (15-25 keV) = 0.679103
Mask shadow pattern
IMX = -1.508559943812539E-01, IMY = -1.751670764535747E-02
TIME vs. PHA plot around the trigger time

TIME vs. DetID plot around the trigger time
100 us light curve (15-350 keV)

Spacecraft aspect plot

Bright source in the pre-burst/pre-slew/post-slew images
Pre-burst image of 15-350 keV band
Time interval of the image:
-239.752000 -45.792000

# RAcent  DECcent POSerr Theta    Phi  PeakCts   SNR AngSep     Name
#  [deg]    [deg]    ['] [deg]  [deg]                   [']
135.5537 -40.5808    3.1  27.1   80.1   0.8270   3.8    1.9	Vela X-1
170.0815 -60.5046   43.6  19.5  156.6   0.0412   0.3    9.9	Cen X-3
186.7236 -62.9111    9.1  24.3  174.6   0.2020   1.3    8.6	GX 301-2
146.6697 -58.4223    2.8  12.4  119.9   0.6096   4.1 ------	UNKNOWN
223.2412 -65.1816    2.5  34.8 -160.6   0.8107   4.6 ------	UNKNOWN
 64.3081 -32.3966    2.8  50.1  -12.6   1.4350   4.0 ------	UNKNOWN
 33.9283 -46.8648    2.8  48.9  -48.6   3.5007   4.1 ------	UNKNOWN
Pre-slew background subtracted image of 15-350 keV band
Time interval of the image:
-45.792000 19.312000

# RAcent  DECcent POSerr Theta    Phi  PeakCts   SNR AngSep     Name
#  [deg]    [deg]    ['] [deg]  [deg]                   [']
135.4601 -40.4603    3.6  27.3   79.9   0.4136   3.3    6.5	Vela X-1
170.6944 -60.7227    0.0  19.6  157.7   0.2997   3.3   12.6	Cen X-3
186.9413 -62.6977    5.4  24.5  174.3   0.1991   2.1    9.0	GX 301-2
175.5820 -48.9668    2.3  30.1  143.4   0.5943   5.1 ------	UNKNOWN
150.3180 -68.3146    0.8   8.6  173.4   1.0595  13.9 ------	UNKNOWN
Post-slew image of 15-350 keV band
Time interval of the image:
56.148600 302.311100
480.248000 542.280800
660.248000 722.292800
840.248000 902.295700

# RAcent  DECcent POSerr Theta    Phi  PeakCts   SNR AngSep     Name
#  [deg]    [deg]    ['] [deg]  [deg]                   [']
135.5169 -40.6132    2.8  28.8   60.1   1.7178   4.2    3.6	Vela X-1
170.0042 -60.6204    5.5  11.4  140.8   0.5773   2.1    9.2	Cen X-3
186.3571 -62.8317   35.9  15.6  170.6   0.0919   0.3    9.0	GX 301-2
 98.7769 -80.1723    2.4  17.3  -69.6   1.4951   4.8 ------	UNKNOWN
355.1511 -69.6578    2.5  41.0  -83.5   6.4650   4.5 ------	UNKNOWN
Plot creation:
Sat May 30 22:51:37 EDT 2015