Click here for the BAT GCN circular template
Image
Pre-slew 15.0-350.0 keV image (Event data)

#   RAcent    DECcent   POSerr    Theta     Phi              Peak Cts       SNR   Name
  157.5015    -5.2485   0.0191    33.0788    81.3812         1.6105041     10.026 TRIG_00449074

Foreground time interval of the image:
 24.728  64.776 (delta_t =  40.048 [sec])
Background time interval of the image:
-133.499  24.728 (delta_t = 158.227 [sec])
Lightcurves
Notes:
- 1) The mask-weighted light curves are using the flight position.
- 2) Multiple plots of different time binning/intervals are shown to cover all scenarios of short/long GRBs, rate/image triggers, and real/false positives.
- 3) For all the mask-weighted lightcurves, the y-axis units are counts/sec/det where a det is 0.4 x 0.4 = 0.16 sq cm.
- 4) The verticle lines correspond to following: green dotted lines are T50 interval, black dotted lines are T90 interval, blue solid line(s) is a spacecraft slew start time, and orange solid line(s) is a spacecraft slew end time.
- 5) Time of each bin is in the middle of the bin.
1 s binning
From T0-310 s to T0+310 s

From T100_start - 20 s to T100_end + 30 s

Full time interval

64 ms binning
Full time interval

From T100_start to T100_end

From T0-5 sec to T0+5 sec

16 ms binning
From T100_start-5 s to T100_start+5 s

8 ms binning
From T100_start-3 s to T100_start+3 s

2 ms binning
From T100_start-1 s to T100_start+1 s

SN=5 or 10 sec. binning (whichever binning is satisfied first)

SN=5 or 10 sec. binning (T < 200 sec)

Quad-rate summed light curves (from T0-300s to T0+1000s)

The mask-weighted light curves based on cleaned DPHs

Spectral Evolution

Spectra
Notes:
- 1) The fitting includes the systematic errors.
- 2) When the burst includes telescope slew time periods, the fitting uses an average response file made from multiple 5-s response files through out the slew time plus single time preiod for the non-slew times, and weighted by the total counts in the corresponding time period using addrmf. An average response file is needed becuase a spectral fit using the pre-slew DRM will introduce some errors in both a spectral shape and a normalization if the PHA file contains a lot of the slew/post-slew time interval.
- 3) For fits to more complicated models (e.g. a power-law over a cutoff power-law), the BAT team has decided to require a chi-square improvement of more than 6 for each extra dof.
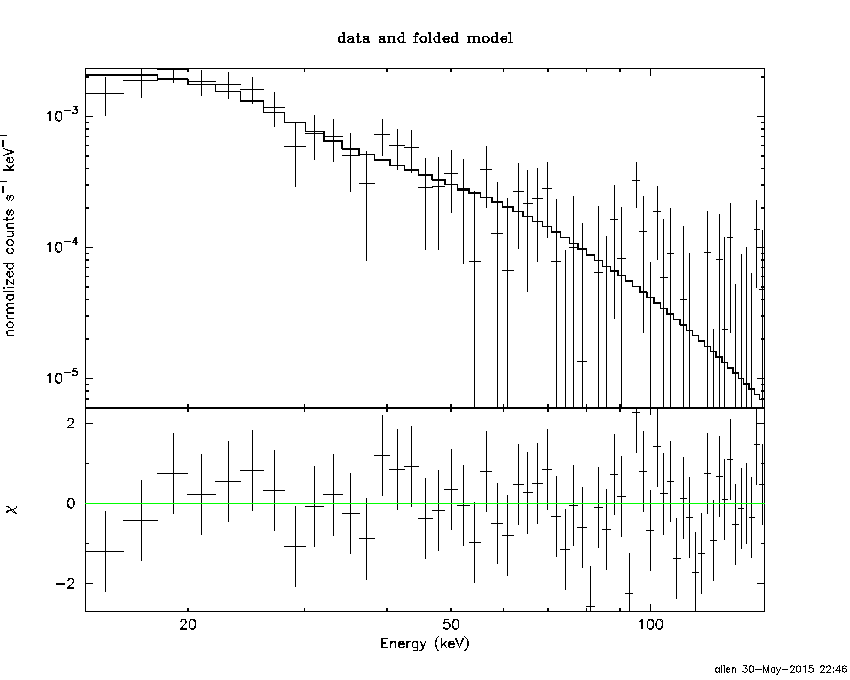
Time averaged spectrum fit using the average DRM
Power-law model

Time interval is from   24.728 sec. to   64.776 sec.

Spectral model in power-law:
------------------------------------------------------------
Parameters  : value       lower 90%   higher 90%
Photon index: 2.33265     ( -0.248326   0.271473 )
Norm@50keV  : 2.10710E-03    ( -0.00041114   0.000406723 )
------------------------------------------------------------
#Fit statistic : Chi-Squared =          47.95 using 59 PHA bins.
# Reduced chi-squared =         0.8413 for     57 degrees of freedom
# Null hypothesis probability =   7.977318e-01

Photon flux (15-150 keV)    in 40.05 sec: 0.375042 ( -0.0451939  0.0452026 ) ph/cm2/s
Energy fluence (15-150 keV)             : 8.11485e-07 ( -1.24803e-07  1.30531e-07 ) ergs/cm2
Cutoff power-law model

Time interval is from   24.728 sec. to   64.776 sec.
Spectral model in the cutoff power-law:
------------------------------------------------------------
Parameters  : value       lower 90%   higher 90%
Photon index: 1.52556     ( -1.45708   0.767341 )
Epeak [keV] : 20.5969      (   )
Norm@50keV  : 6.94226E-03    (     )
------------------------------------------------------------
#Fit statistic : Chi-Squared =          46.45 using 59 PHA bins.
# Reduced chi-squared =         0.8295 for     56 degrees of freedom
# Null hypothesis probability =   8.146238e-01

Photon flux (15-150 keV)    in 40.05 sec: 0.365353 ( -0.046155  0.046714 ) ph/cm2/s
Energy fluence (15-150 keV)             : 7.3656e-07 ( -1.32638e-07  1.63096e-07 ) ergs/cm2
Band function

Time interval is from   24.728 sec. to   64.776 sec.

Spectral model in the Band function:
------------------------------------------------------------
Parameters  : value       lower 90%   higher 90%
alpha       : 4.93833   ( -4.93833   -4.93833 )
beta        : -2.54210    ( -0.482361   0.323607 )
Epeak [keV] : 20.6095      ( -20.6095 3.49906 )
Norm@50keV   : 1542.71    ( -184.364   4.30832e+06 )
------------------------------------------------------------
#Fit statistic : Chi-Squared =          45.40 using 59 PHA bins.
# Reduced chi-squared =         0.8254 for     55 degrees of freedom
# Null hypothesis probability =   8.187004e-01

Photon flux (15-150 keV)    in 40.05 sec:  (    ) ph/cm2/s
Energy fluence (15-150 keV)             : 7.80787e-07 ( 0  0 ) ergs/cm2
Single BB

Spectral model blackbody:
------------------------------------------------------------
Parameters  : value    Lower 90%  Upper 90%
kT [keV]    : 7.51533  (-1.04471  1.19605)
R^2/D10^2   : 0.524750  (-0.235995   0.445509)
(R is the radius in km and D10 is the distance to the source in units of 10 kpc)
------------------------------------------------------------
#Fit statistic : Chi-Squared =          56.01 using 59 PHA bins.
# Reduced chi-squared =         0.9827 for     57 degrees of freedom
# Null hypothesis probability =   5.120820e-01

Energy  Fluence     90% Error
[keV]   [erg/cm2]   [erg/cm2]
15- 25  2.041e-07   4.363e-08
25- 50  3.195e-07   5.767e-08
50-150  6.800e-08   2.782e-08
15-150  5.916e-07   1.023e-07
Thermal bremsstrahlung (OTTB)

Spectral model: thermal bremsstrahlung
------------------------------------------------------------
Parameters  : value         Lower 90%    Upper 90%
kT [keV]    : 36.8494       (-10.0451      15.7084)
Norm        : 2.56499       (-0.573534     0.791073)
------------------------------------------------------------
#Fit statistic : Chi-Squared =          46.50 using 59 PHA bins.
# Reduced chi-squared =         0.8159 for     57 degrees of freedom
# Null hypothesis probability =   8.382534e-01

Energy  Fluence     90% Error
[keV]   [erg/cm2]   [erg/cm2]
15- 25  2.291e-07   3.384e-08
25- 50  2.905e-07   4.888e-08
50-150  2.049e-07   9.205e-08
15-150  7.245e-07   1.284e-07
Double BB

Spectral model: bbodyrad<1> + bbodyrad<2>
------------------------------------------------------------
Parameters  : value         Lower 90%    Upper 90%
kT1 [keV]   : 4.47432        (-1.51313      1.85842)
R1^2/D10^2  : 3.00138        (-2.11237      4.35199)
kT2 [keV]   : 13.0339        (-3.89681      11.6978)
R2^2/D10^2  : 3.75970E-02    (-0.0353397   0.144614)
------------------------------------------------------------
#Fit statistic : Chi-Squared =          45.77 using 59 PHA bins.
# Reduced chi-squared =         0.8322 for     55 degrees of freedom
# Null hypothesis probability =   8.079316e-01

Energy  Fluence     90% Error
[keV]   [erg/cm2]   [erg/cm2]
15- 25  2.377e-07   1.277e-07
25- 50  2.775e-07   1.425e-07
50-150  2.036e-07   1.244e-07
15-150  7.188e-07   3.735e-07
Peak spectrum fit
Power-law model

Time interval is from   44.204 sec. to   45.204 sec.

Spectral model in power-law:
------------------------------------------------------------
Parameters  : value       lower 90%   higher 90%
Photon index: 1.84912     ( -0.468376   0.52711 )
Norm@50keV  : 8.34142E-03    ( -0.00253136   0.00232784 )
------------------------------------------------------------
#Fit statistic : Chi-Squared =          59.86 using 59 PHA bins.
# Reduced chi-squared =          1.050 for     57 degrees of freedom
# Null hypothesis probability =   3.724263e-01

Photon flux (15-150 keV)    in 1 sec: 1.17205 ( -0.275011  0.275319 ) ph/cm2/s
Energy fluence (15-150 keV)             : 7.6698e-08 ( -2.18505e-08  2.27733e-08 ) ergs/cm2
Cutoff power-law model

Time interval is from   44.204 sec. to   45.204 sec.
Spectral model in the cutoff power-law:
------------------------------------------------------------
Parameters  : value       lower 90%   higher 90%
Photon index: 2.33902     (     )
Epeak [keV] : 126.578      (   )
Norm@50keV  : 4.69820E-03    (     )
------------------------------------------------------------
#Fit statistic : Chi-Squared =          59.51 using 59 PHA bins.
# Reduced chi-squared =          1.063 for     56 degrees of freedom
# Null hypothesis probability =   3.491149e-01

Photon flux (15-150 keV)    in 1 sec: 1.17396 ( -0.27843  0.27397 ) ph/cm2/s
Energy fluence (15-150 keV)             : 7.62086e-08 ( -2.13836e-08  2.29694e-08 ) ergs/cm2
Band function

Time interval is from   44.204 sec. to   45.204 sec.

Spectral model in the Band function:
------------------------------------------------------------
Parameters  : value       lower 90%   higher 90%
alpha       : -1.50891   ( 1.50908   1.50908 )
beta        : -1.84929    ( 1.84925   0.468858 )
Epeak [keV] : 22.9649      ( -22.8325 -22.8325 )
Norm@50keV   : 1.73098E-02    ( -0.0110538   17.1347 )
------------------------------------------------------------
#Fit statistic : Chi-Squared =          59.86 using 59 PHA bins.
# Reduced chi-squared =          1.088 for     55 degrees of freedom
# Null hypothesis probability =   3.038996e-01

Photon flux (15-150 keV)    in 1 sec:  (    ) ph/cm2/s
Energy fluence (15-150 keV)             : 0 ( 0  0 ) ergs/cm2
Single BB

Spectral model blackbody:
------------------------------------------------------------
Parameters  : value    Lower 90%  Upper 90%
kT [keV]    : 13.6370  (-4.41006  5.67402)
R^2/D10^2   : 0.166609  (-0.116857   0.511535)
(R is the radius in km and D10 is the distance to the source in units of 10 kpc)
------------------------------------------------------------
#Fit statistic : Chi-Squared =          68.54 using 59 PHA bins.
# Reduced chi-squared =          1.202 for     57 degrees of freedom
# Null hypothesis probability =   1.408269e-01

Energy  Fluence     90% Error
[keV]   [erg/cm2]   [erg/cm2]
15- 25  6.559e-09   3.935e-09
25- 50  2.375e-08   1.381e-08
50-150  2.869e-08   1.739e-08
15-150  5.900e-08   2.681e-08
Thermal bremsstrahlung (OTTB)

Spectral model: thermal bremsstrahlung
------------------------------------------------------------
Parameters  : value         Lower 90%    Upper 90%
kT [keV]    : 105.877       (-62.8409      -106.694)
Norm        : 5.03696       (-1.41468     2.34347)
------------------------------------------------------------
#Fit statistic : Chi-Squared =          60.88 using 59 PHA bins.
# Reduced chi-squared =          1.068 for     57 degrees of freedom
# Null hypothesis probability =   3.379806e-01

Energy  Fluence     90% Error
[keV]   [erg/cm2]   [erg/cm2]
15- 25  1.316e-08   7.664e-09
25- 50  2.302e-08   1.377e-08
50-150  3.850e-08   2.832e-08
15-150  7.468e-08   4.856e-08
Double BB

Spectral model: bbodyrad<1> + bbodyrad<2>
------------------------------------------------------------
Parameters  : value         Lower 90%    Upper 90%
kT1 [keV]   : 3.47446        (-1.26149      1.86623)
R1^2/D10^2  : 31.8145        (-27.7991      413.854)
kT2 [keV]   : 19.8279        (-6.17246      13.251)
R2^2/D10^2  : 3.81990E-02    (-0.0311846   0.104793)
------------------------------------------------------------
#Fit statistic : Chi-Squared =          57.12 using 59 PHA bins.
# Reduced chi-squared =          1.039 for     55 degrees of freedom
# Null hypothesis probability =   3.962244e-01

Energy  Fluence     90% Error
[keV]   [erg/cm2]   [erg/cm2]
15- 25  1.691e-08   9.395e-09
25- 50  1.770e-08   9.465e-09
50-150  4.189e-08   2.687e-08
15-150  7.651e-08   4.238e-08
Pre-slew spectrum (Pre-slew PHA with pre-slew DRM)
Power-law model
Spectral model in power-law:
------------------------------------------------------------
Parameters  : value       lower 90%   higher 90%
Photon index: 2.33265     ( -0.248326   0.271473 )
Norm@50keV  : 2.10710E-03    ( -0.00041114   0.000406723 )
------------------------------------------------------------
#Fit statistic : Chi-Squared =          47.95 using 59 PHA bins.
# Reduced chi-squared =         0.8413 for     57 degrees of freedom
# Null hypothesis probability =   7.977318e-01

Photon flux (15-150 keV)    in 40.05 sec: 0.375042 ( -0.0451939  0.0452026 ) ph/cm2/s
Energy fluence (15-150 keV)             : 8.11485e-07 ( -1.24803e-07  1.30531e-07 ) ergs/cm2
Cutoff power-law model

Spectral model in the cutoff power-law:
------------------------------------------------------------
Parameters  : value       lower 90%   higher 90%
Photon index: 1.52556     ( -1.45708   0.767341 )
Epeak [keV] : 20.5969      (   )
Norm@50keV  : 6.94226E-03    (     )
------------------------------------------------------------
#Fit statistic : Chi-Squared =          46.45 using 59 PHA bins.
# Reduced chi-squared =         0.8295 for     56 degrees of freedom
# Null hypothesis probability =   8.146238e-01

Photon flux (15-150 keV)    in 40.05 sec: 0.365353 ( -0.046155  0.046714 ) ph/cm2/s
Energy fluence (15-150 keV)             : 7.3656e-07 ( -1.32638e-07  1.63096e-07 ) ergs/cm2
Band function

Spectral model in the Band function:
------------------------------------------------------------
Parameters  : value       lower 90%   higher 90%
alpha       : 4.93833   ( -4.93833   -4.93833 )
beta        : -2.54210    ( -0.482361   0.323607 )
Epeak [keV] : 20.6095      ( -20.6095 3.49906 )
Norm@50keV   : 1542.71    ( -184.364   4.30832e+06 )
------------------------------------------------------------
#Fit statistic : Chi-Squared =          45.40 using 59 PHA bins.
# Reduced chi-squared =         0.8254 for     55 degrees of freedom
# Null hypothesis probability =   8.187004e-01

Photon flux (15-150 keV)    in 40.05 sec:  (    ) ph/cm2/s
Energy fluence (15-150 keV)             : 7.80787e-07 ( 0  0 ) ergs/cm2
S(25-50 keV) vs. S(50-100 keV) plot

S(25-50 keV)  = 2.63e-07
S(50-100 keV) = 2.09e-07
T90 vs. Hardness ratio plot

T90                                   = 35.1360000371933 sec.
Hardness ratio (energy fluence ratio) = 0.794677
Color vs. Color plot

Count Ratio  (25-50 keV) / (15-25 keV) = 0.860975
Count Ratio (50-100 keV) / (15-25 keV) = 0.29292
Mask shadow pattern
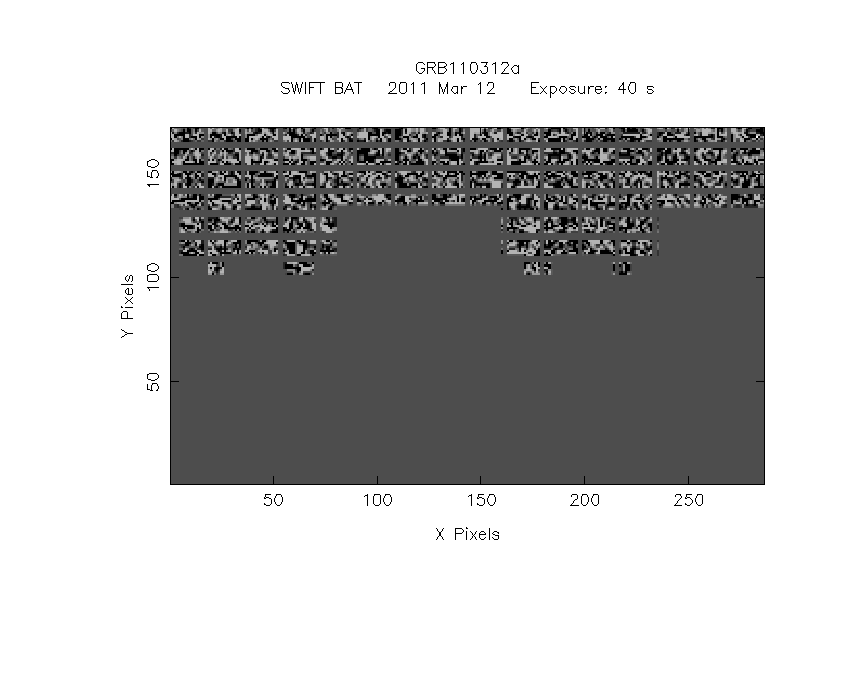
IMX = 9.761395287750096E-02, IMY = -6.440098545552502E-01
TIME vs. PHA plot around the trigger time

TIME vs. DetID plot around the trigger time

100 us light curve (15-350 keV)

Spacecraft aspect plot

Bright source in the pre-burst/pre-slew/post-slew images
Pre-burst image of 15-350 keV band
Time interval of the image:
-133.499410 24.728000

# RAcent  DECcent POSerr Theta    Phi  PeakCts   SNR AngSep     Name
#  [deg]    [deg]    ['] [deg]  [deg]                   [']
135.5276 -40.5328    1.3  17.0  -23.1   1.4418   8.7    1.3	Vela X-1
170.1533 -60.6159    5.2  23.7 -114.4   0.4225   2.2    4.8	Cen X-3
186.4957 -62.7335    5.1  30.1 -125.2   0.5056   2.3    4.9	GX 301-2
189.9443  -7.6090    2.6  42.5  133.4   2.3863   4.4 ------	UNKNOWN
132.1855 -18.8571    2.4  29.3   25.7   0.9258   4.9 ------	UNKNOWN
209.2856 -31.3967    2.4  42.6  178.2   1.3703   4.8 ------	UNKNOWN
165.2340 -41.9674    2.4   7.0 -155.0   0.7211   4.8 ------	UNKNOWN
116.8714 -28.4762    2.7  34.9   -4.8   0.8645   4.2 ------	UNKNOWN
105.9640 -26.0590    2.6  44.6   -8.6   1.1784   4.5 ------	UNKNOWN
138.6884 -61.7681    2.8  26.1  -78.6   0.8748   4.2 ------	UNKNOWN
234.4169 -40.6506    2.9  57.5 -160.1   3.3889   3.9 ------	UNKNOWN
 87.9354 -26.6532    2.6  58.4  -19.5   4.0303   4.5 ------	UNKNOWN
 85.0375 -30.0422    2.9  58.9  -24.4   4.9576   4.0 ------	UNKNOWN
Pre-slew background subtracted image of 15-350 keV band
Time interval of the image:
24.728000 64.776000

# RAcent  DECcent POSerr Theta    Phi  PeakCts   SNR AngSep     Name
#  [deg]    [deg]    ['] [deg]  [deg]                   [']
135.4650 -40.4428    3.2  17.0  -22.8  -0.2734  -3.6    7.3	Vela X-1
170.1703 -60.6978    8.7  23.8 -114.4  -0.1149  -1.3    6.2	Cen X-3
186.3478 -62.7582   10.7  30.0 -125.1  -0.1101  -1.1    8.5	GX 301-2
157.5015  -5.2485    1.1  33.1   81.4   1.6101  10.0 ------	UNKNOWN
174.8128 -20.7926    2.0  23.1  126.7   0.5455   5.8 ------	UNKNOWN
158.8245 -63.2338    2.1  24.9 -100.3   0.5138   5.4 ------	UNKNOWN
Post-slew image of 15-350 keV band
Time interval of the image:
146.700650 963.160000

# RAcent  DECcent POSerr Theta    Phi  PeakCts   SNR AngSep     Name
#  [deg]    [deg]    ['] [deg]  [deg]                   [']
135.5021 -40.5318    1.1  40.4 -124.5   9.3784  10.1    1.8	Vela X-1
170.2574 -60.6358   17.7  56.2 -158.0  -1.4477  -0.6    1.9	Cen X-3
155.5829 -35.6594    2.5  30.5 -147.5   2.3892   4.7 ------	UNKNOWN
148.6460 -60.0888    4.0  55.3 -145.2   9.2846   2.9 ------	UNKNOWN
Plot creation:
Sat May 30 22:47:55 EDT 2015