Click here for the BAT GCN circular template
Image
Pre-slew 15.0-350.0 keV image (Event data)
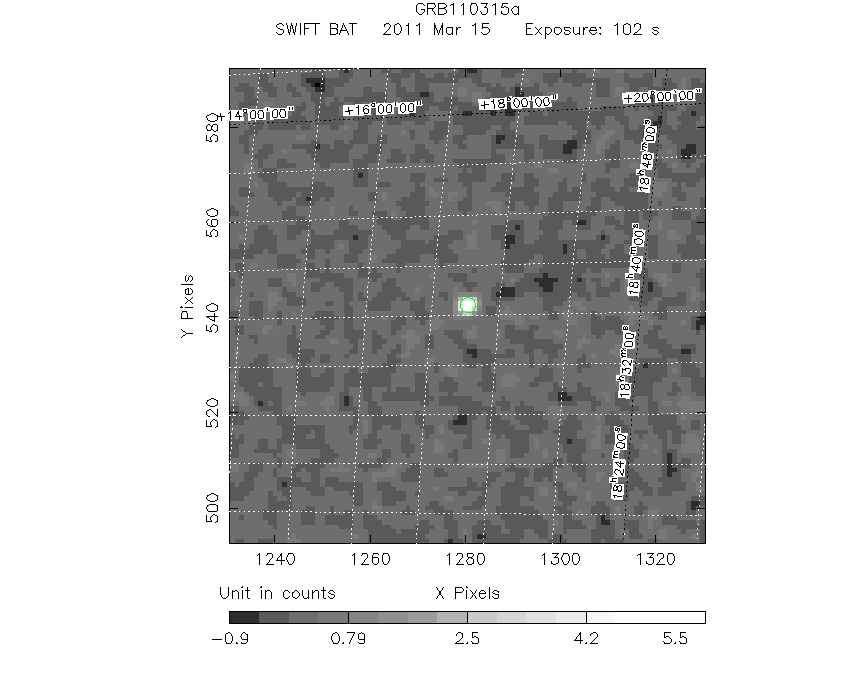
#   RAcent    DECcent   POSerr    Theta     Phi              Peak Cts       SNR   Name
  279.2047    17.5368   0.0066    40.4920  -170.6491         6.5049972     28.895 TRIG_00449399

Foreground time interval of the image:
-66.764  35.405 (delta_t = 102.169 [sec])
Background time interval of the image:
-239.296 -66.764 (delta_t = 172.532 [sec])
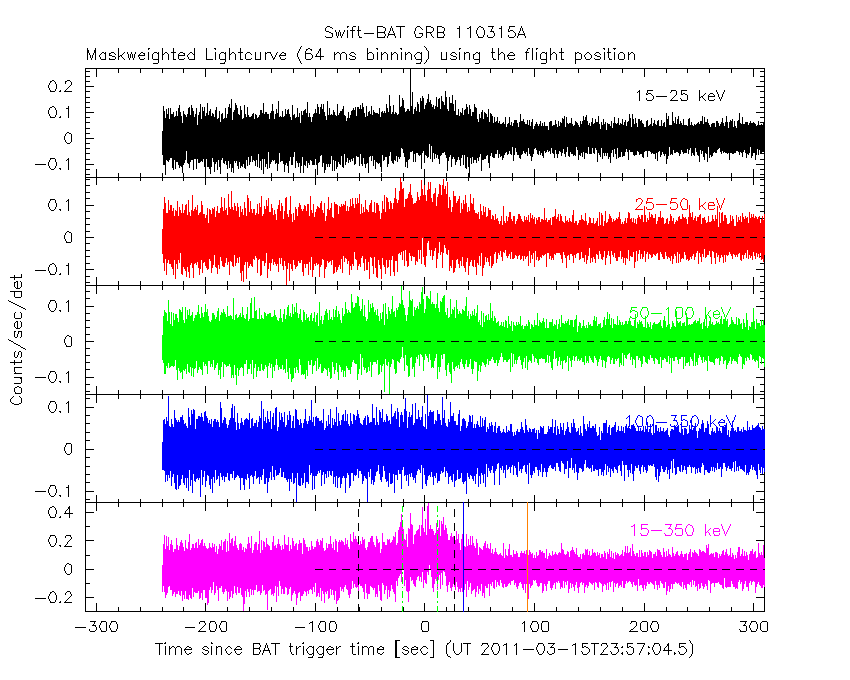
Lightcurves
Notes:
- 1) The mask-weighted light curves are using the flight position.
- 2) Multiple plots of different time binning/intervals are shown to cover all scenarios of short/long GRBs, rate/image triggers, and real/false positives.
- 3) For all the mask-weighted lightcurves, the y-axis units are counts/sec/det where a det is 0.4 x 0.4 = 0.16 sq cm.
- 4) The verticle lines correspond to following: green dotted lines are T50 interval, black dotted lines are T90 interval, blue solid line(s) is a spacecraft slew start time, and orange solid line(s) is a spacecraft slew end time.
- 5) Time of each bin is in the middle of the bin.
1 s binning
From T0-310 s to T0+310 s

From T100_start - 20 s to T100_end + 30 s

Full time interval

64 ms binning
Full time interval
From T100_start to T100_end

From T0-5 sec to T0+5 sec

16 ms binning
From T100_start-5 s to T100_start+5 s

Blue+Cyan dotted lines: Time interval of the scaled map
From 0.000000 to 4.096000
8 ms binning
From T100_start-3 s to T100_start+3 s

Blue+Cyan dotted lines: Time interval of the scaled map
From 0.000000 to 4.096000
2 ms binning
From T100_start-1 s to T100_start+1 s
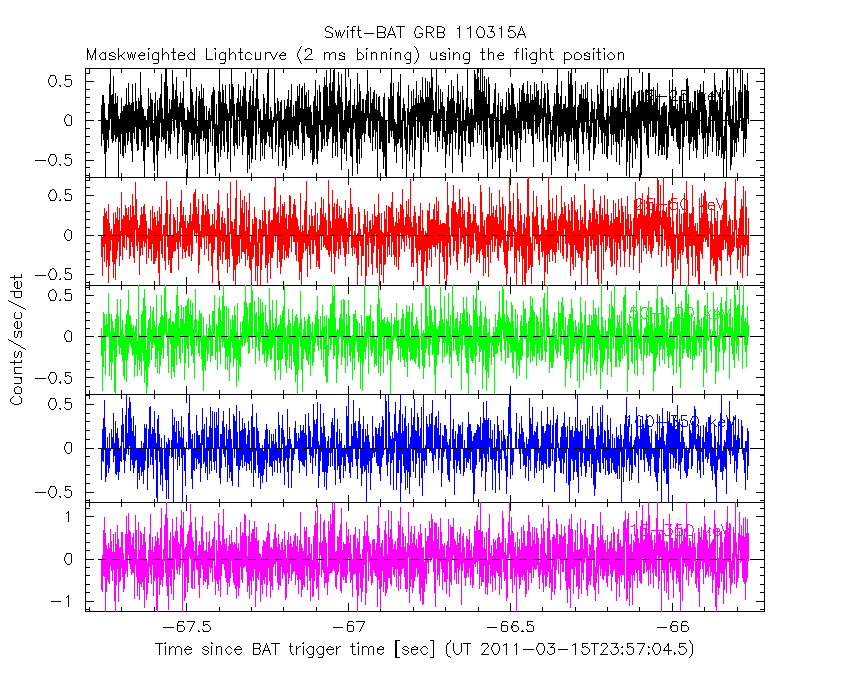
Blue+Cyan dotted lines: Time interval of the scaled map
From 0.000000 to 4.096000
SN=5 or 10 sec. binning (whichever binning is satisfied first)

SN=5 or 10 sec. binning (T < 200 sec)

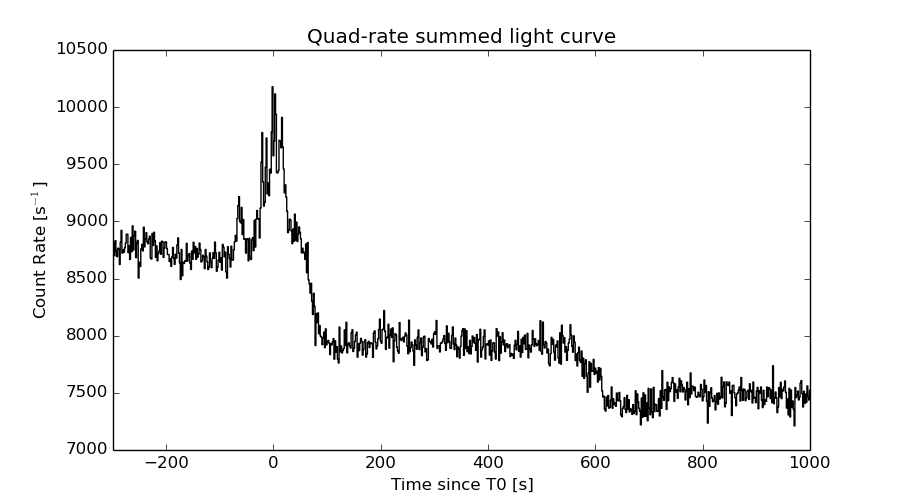
Quad-rate summed light curves (from T0-300s to T0+1000s)
The mask-weighted light curves based on cleaned DPHs

Spectral Evolution

Spectra
Notes:
- 1) The fitting includes the systematic errors.
- 2) When the burst includes telescope slew time periods, the fitting uses an average response file made from multiple 5-s response files through out the slew time plus single time preiod for the non-slew times, and weighted by the total counts in the corresponding time period using addrmf. An average response file is needed becuase a spectral fit using the pre-slew DRM will introduce some errors in both a spectral shape and a normalization if the PHA file contains a lot of the slew/post-slew time interval.
- 3) For fits to more complicated models (e.g. a power-law over a cutoff power-law), the BAT team has decided to require a chi-square improvement of more than 6 for each extra dof.
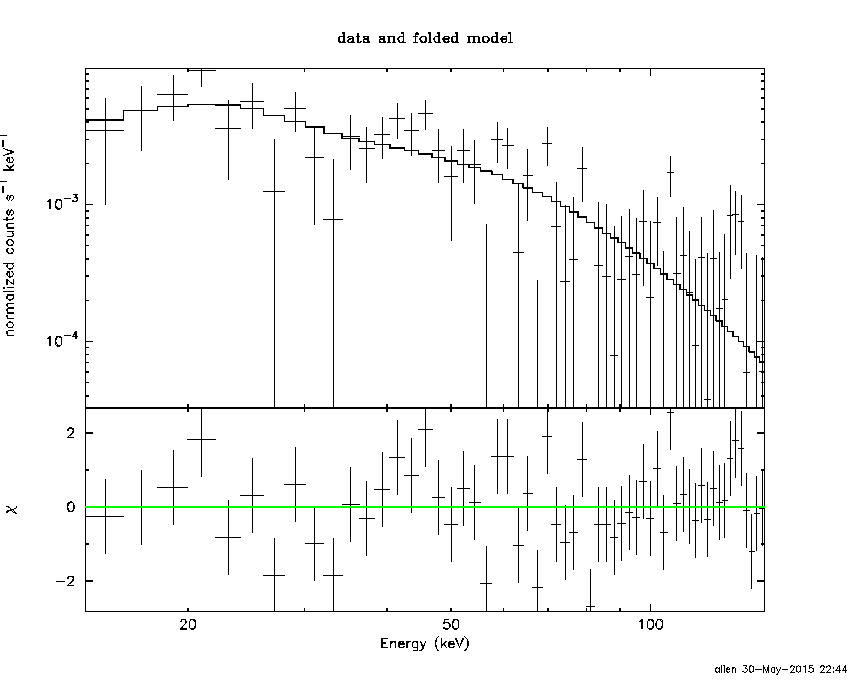
Time averaged spectrum fit using the average DRM
Power-law model

Time interval is from  -66.764 sec. to   38.840 sec.

Spectral model in power-law:
------------------------------------------------------------
Parameters  : value       lower 90%   higher 90%
Photon index: 1.76706     ( -0.080343   0.0809815 )
Norm@50keV  : 4.18892E-03    ( -0.000181151   0.000180617 )
------------------------------------------------------------
#Fit statistic : Chi-Squared =          48.50 using 59 PHA bins.
# Reduced chi-squared =         0.8508 for     57 degrees of freedom
# Null hypothesis probability =   7.812731e-01

Photon flux (15-150 keV)    in 105.6 sec: 0.570017 ( -0.026015  0.0261223 ) ph/cm2/s
Energy fluence (15-150 keV)             : 4.07801e-06 ( -1.80796e-07  1.81564e-07 ) ergs/cm2
Cutoff power-law model

Time interval is from  -66.764 sec. to   38.840 sec.
Spectral model in the cutoff power-law:
------------------------------------------------------------
Parameters  : value       lower 90%   higher 90%
Photon index: 1.65500     ( -0.326616   0.183155 )
Epeak [keV] : 155.583      ( -121.496 -155.627 )
Norm@50keV  : 4.75905E-03    ( -0.000807806   0.00208478 )
------------------------------------------------------------
#Fit statistic : Chi-Squared =          48.12 using 59 PHA bins.
# Reduced chi-squared =         0.8593 for     56 degrees of freedom
# Null hypothesis probability =   7.639419e-01

Photon flux (15-150 keV)    in 105.6 sec: 0.565348 ( -0.028746  0.028694 ) ph/cm2/s
Energy fluence (15-150 keV)             : 4.04282e-06 ( -2.07831e-07  2.03966e-07 ) ergs/cm2
Band function

Time interval is from  -66.764 sec. to   38.840 sec.

Spectral model in the Band function:
------------------------------------------------------------
Parameters  : value       lower 90%   higher 90%
alpha       : -1.36403   ( 1.32344   1.32344 )
beta        : -1.84170    ( 1.84042   0.138598 )
Epeak [keV] : 62.2259      ( -59.5713 -59.5713 )
Norm@50keV   : 7.12656E-03    ( -0.00277262   0 )
------------------------------------------------------------
#Fit statistic : Chi-Squared =          47.55 using 59 PHA bins.
# Reduced chi-squared =         0.8646 for     55 degrees of freedom
# Null hypothesis probability =   7.518871e-01

Photon flux (15-150 keV)    in 105.6 sec:  (    ) ph/cm2/s
Energy fluence (15-150 keV)             : 4.02824e-06 ( 0  0 ) ergs/cm2
Single BB

Spectral model blackbody:
------------------------------------------------------------
Parameters  : value    Lower 90%  Upper 90%
kT [keV]    : 13.5134  (  )
R^2/D10^2   : 8.43312E-02  (   )
(R is the radius in km and D10 is the distance to the source in units of 10 kpc)
------------------------------------------------------------
#Fit statistic : Chi-Squared =         183.37 using 59 PHA bins.
# Reduced chi-squared =         3.2169 for     57 degrees of freedom
# Null hypothesis probability =   3.460110e-15

Energy  Fluence     90% Error
[keV]   [erg/cm2]   [erg/cm2]
15- 25  3.444e-07   2.814e-08
25- 50  1.236e-06   6.970e-08
50-150  1.458e-06   1.220e-07
15-150  3.039e-06   1.373e-07
Thermal bremsstrahlung (OTTB)

Spectral model: thermal bremsstrahlung
------------------------------------------------------------
Parameters  : value         Lower 90%    Upper 90%
kT [keV]    : 125.813       (      )
Norm        : 2.34911       (-0.129898     0.16978)
------------------------------------------------------------
#Fit statistic : Chi-Squared =          51.49 using 59 PHA bins.
# Reduced chi-squared =         0.9034 for     57 degrees of freedom
# Null hypothesis probability =   6.809554e-01

Energy  Fluence     90% Error
[keV]   [erg/cm2]   [erg/cm2]
15- 25  6.372e-07   4.736e-08
25- 50  1.154e-06   6.970e-08
50-150  2.130e-06   5.660e-07
15-150  3.920e-06   6.172e-07
Double BB

Spectral model: bbodyrad<1> + bbodyrad<2>
------------------------------------------------------------
Parameters  : value         Lower 90%    Upper 90%
kT1 [keV]   : 7.01976        (-1.03417      1.11438)
R1^2/D10^2  : 0.664416        (-0.260528      0.51415)
kT2 [keV]   : 25.8047        (-4.10292      6.63993)
R2^2/D10^2  : 5.98055E-03    (-0.00334668   0.00565731)
------------------------------------------------------------
#Fit statistic : Chi-Squared =          55.75 using 59 PHA bins.
# Reduced chi-squared =          1.014 for     55 degrees of freedom
# Null hypothesis probability =   4.463110e-01

Energy  Fluence     90% Error
[keV]   [erg/cm2]   [erg/cm2]
15- 25  6.289e-07   9.684e-08
25- 50  1.181e-06   1.376e-07
50-150  2.162e-06   4.213e-07
15-150  3.972e-06   5.364e-07
Peak spectrum fit
Power-law model

Time interval is from    3.128 sec. to    4.128 sec.

Spectral model in power-law:
------------------------------------------------------------
Parameters  : value       lower 90%   higher 90%
Photon index: 1.65803     ( -0.241913   0.247375 )
Norm@50keV  : 1.30166E-02    ( -0.0019233   0.00190256 )
------------------------------------------------------------
#Fit statistic : Chi-Squared =          69.98 using 59 PHA bins.
# Reduced chi-squared =          1.228 for     57 degrees of freedom
# Null hypothesis probability =   1.159081e-01

Photon flux (15-150 keV)    in 1 sec: 1.70417 ( -0.24768  0.248434 ) ph/cm2/s
Energy fluence (15-150 keV)             : 1.20963e-07 ( -1.86652e-08  1.8862e-08 ) ergs/cm2
Cutoff power-law model

Time interval is from    3.128 sec. to    4.128 sec.
Spectral model in the cutoff power-law:
------------------------------------------------------------
Parameters  : value       lower 90%   higher 90%
Photon index: 1.15265     ( -1.47313   0.720856 )
Epeak [keV] : 80.2540      ( -33.6925 -80.3556 )
Norm@50keV  : 2.39910E-02    ( -0.0239457   0.117049 )
------------------------------------------------------------
#Fit statistic : Chi-Squared =          69.39 using 59 PHA bins.
# Reduced chi-squared =          1.239 for     56 degrees of freedom
# Null hypothesis probability =   1.078292e-01

Photon flux (15-150 keV)    in 1 sec: 1.67029 ( -0.26208  0.25927 ) ph/cm2/s
Energy fluence (15-150 keV)             : 1.16475e-07 ( -2.17825e-08  2.1249e-08 ) ergs/cm2
Band function
Time interval is from    3.128 sec. to    4.128 sec.

Spectral model in the Band function:
------------------------------------------------------------
Parameters  : value       lower 90%   higher 90%
alpha       : -0.520124   ( 0.796768   0.796768 )
beta        : -2.09769    ( 2.08095   0.586532 )
Epeak [keV] : 56.2379      ( -56.2773 62.452 )
Norm@50keV   : 5.51962E-02    ( -0.055609   985.078 )
------------------------------------------------------------
#Fit statistic : Chi-Squared =          68.43 using 59 PHA bins.
# Reduced chi-squared =          1.244 for     55 degrees of freedom
# Null hypothesis probability =   1.054099e-01

Photon flux (15-150 keV)    in 1 sec:  (    ) ph/cm2/s
Energy fluence (15-150 keV)             : 1.15656e-07 ( 0  0 ) ergs/cm2
Single BB

Spectral model blackbody:
------------------------------------------------------------
Parameters  : value    Lower 90%  Upper 90%
kT [keV]    : 13.0726  (-1.87131  2.27422)
R^2/D10^2   : 0.311749  (-0.140011   0.239049)
(R is the radius in km and D10 is the distance to the source in units of 10 kpc)
------------------------------------------------------------
#Fit statistic : Chi-Squared =          75.87 using 59 PHA bins.
# Reduced chi-squared =          1.331 for     57 degrees of freedom
# Null hypothesis probability =   4.806056e-02

Energy  Fluence     90% Error
[keV]   [erg/cm2]   [erg/cm2]
15- 25  1.130e-08   2.815e-09
25- 50  3.915e-08   8.000e-09
50-150  4.243e-08   1.287e-08
15-150  9.288e-08   1.855e-08
Thermal bremsstrahlung (OTTB)

Spectral model: thermal bremsstrahlung
------------------------------------------------------------
Parameters  : value         Lower 90%    Upper 90%
kT [keV]    : 154.598       (-71.5311      -152.583)
Norm        : 6.98510       (-1.08453     1.53578)
------------------------------------------------------------
#Fit statistic : Chi-Squared =          69.41 using 59 PHA bins.
# Reduced chi-squared =          1.218 for     57 degrees of freedom
# Null hypothesis probability =   1.252623e-01

Energy  Fluence     90% Error
[keV]   [erg/cm2]   [erg/cm2]
15- 25  1.789e-08   9.840e-09
25- 50  3.331e-08   1.794e-08
50-150  6.657e-08   3.854e-08
15-150  1.178e-07   6.600e-08
Double BB

R1^2/D10^2  : 0.537062        (-0.283896      0.523638)
kT2 [keV]   : 200.000        (      )
R2^2/D10^2  : 1.45948E-04    (-6.83082e-05   0.000534002)
------------------------------------------------------------
#Fit statistic : Chi-Squared =          71.18 using 59 PHA bins.
#Fit statistic : Chi-Squared =          67.37 using 59 PHA bins.
#Fit statistic : Chi-Squared =          67.15 using 59 PHA bins.
# Reduced chi-squared =          1.294 for     55 degrees of freedom
# Reduced chi-squared =          1.225 for     55 degrees of freedom
# Reduced chi-squared =          1.221 for     55 degrees of freedom
# Null hypothesis probability =   7.003431e-02
# Null hypothesis probability =   1.223483e-01
# Null hypothesis probability =   1.261302e-01

Energy  Fluence     90% Error
[keV]   [erg/cm2]   [erg/cm2]
15- 25  1.766e-08   8.929e-09
25- 50  3.451e-08   1.582e-08
50-150  5.042e-08   2.356e-08
15-150  1.026e-07   4.362e-08
Pre-slew spectrum (Pre-slew PHA with pre-slew DRM)
Power-law model

Spectral model in power-law:
------------------------------------------------------------
Parameters  : value       lower 90%   higher 90%
Photon index: 1.76598     ( -0.0805935   0.0812189 )
Norm@50keV  : 4.26710E-03    ( -0.000184433   0.000183886 )
------------------------------------------------------------
#Fit statistic : Chi-Squared =          49.08 using 59 PHA bins.
# Reduced chi-squared =         0.8611 for     57 degrees of freedom
# Null hypothesis probability =   7.628397e-01

Photon flux (15-150 keV)    in 102.2 sec: 0.580422 ( -0.0265086  0.0266192 ) ph/cm2/s
Energy fluence (15-150 keV)             : 4.02059e-06 ( -1.7821e-07  1.78967e-07 ) ergs/cm2
Cutoff power-law model

Spectral model in the cutoff power-law:
------------------------------------------------------------
Parameters  : value       lower 90%   higher 90%
Photon index: 1.71094     ( -0.321074   0.356583 )
Epeak [keV] : 264.393      (   )
Norm@50keV  : 4.54350E-03    (     )
------------------------------------------------------------
#Fit statistic : Chi-Squared =          48.99 using 59 PHA bins.
# Reduced chi-squared =         0.8749 for     56 degrees of freedom
# Null hypothesis probability =   7.350596e-01

Photon flux (15-150 keV)    in 102.2 sec: 0.578056 ( -0.029252  0.02814 ) ph/cm2/s
Energy fluence (15-150 keV)             : 4.00454e-06 ( -2.04472e-07  1.92524e-07 ) ergs/cm2
Band function

Spectral model in the Band function:
------------------------------------------------------------
Parameters  : value       lower 90%   higher 90%
alpha       : -1.42544   ( 1.33629   1.33629 )
beta        : -1.82376    ( -1.20018   0.120772 )
Epeak [keV] : 65.2075      ( -57.3482 103.703 )
Norm@50keV   : 6.71793E-03    ( -0.00227637   0 )
------------------------------------------------------------
#Fit statistic : Chi-Squared =          48.43 using 59 PHA bins.
# Reduced chi-squared =         0.8805 for     55 degrees of freedom
# Null hypothesis probability =   7.220789e-01

Photon flux (15-150 keV)    in 102.2 sec:  (    ) ph/cm2/s
Energy fluence (15-150 keV)             : 0 ( 0  0 ) ergs/cm2
S(25-50 keV) vs. S(50-100 keV) plot

S(25-50 keV)  = 1.13e-06
S(50-100 keV) = 1.33e-06
T90 vs. Hardness ratio plot

T90                                   = 87.6759999394417 sec.
Hardness ratio (energy fluence ratio) = 1.17699
Color vs. Color plot
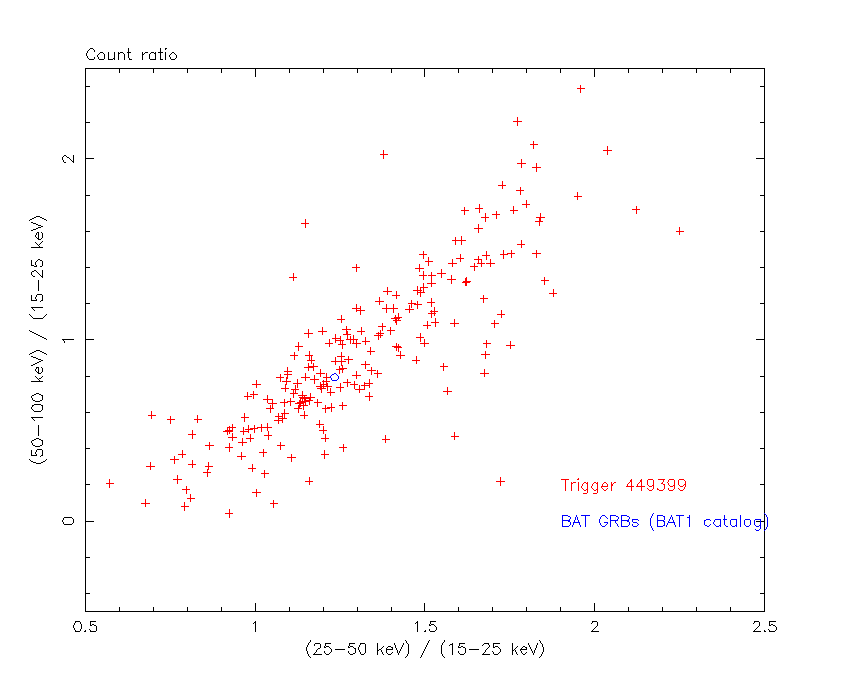
Count Ratio  (25-50 keV) / (15-25 keV) = 1.23368
Count Ratio (50-100 keV) / (15-25 keV) = 0.794076
Mask shadow pattern

IMX = -8.424927693442371E-01, IMY = 1.387327467616037E-01
TIME vs. PHA plot around the trigger time

Blue+Cyan dotted lines: Time interval of the scaled map
From 0.000000 to 4.096000
TIME vs. DetID plot around the trigger time
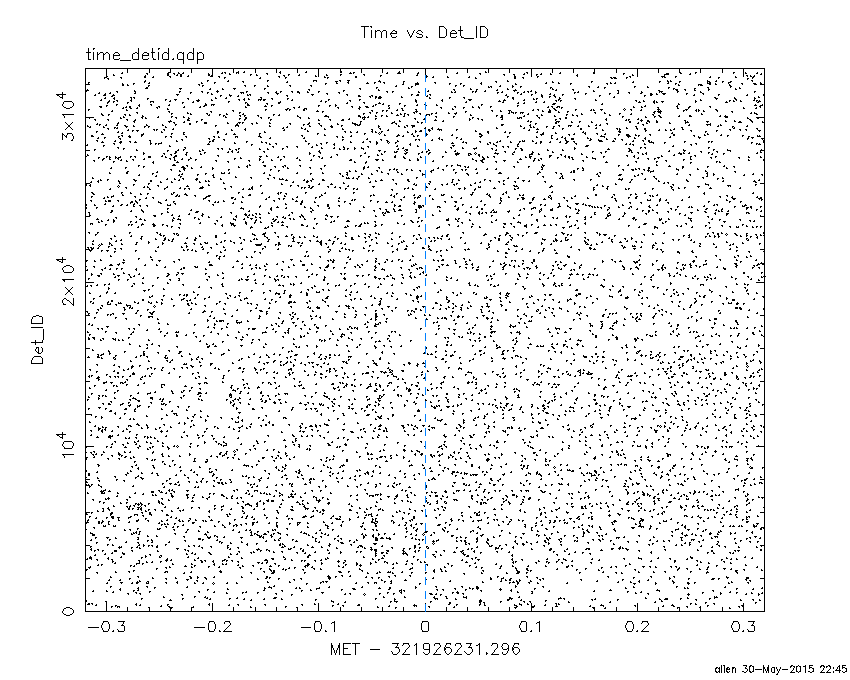
Blue+Cyan dotted lines: Time interval of the scaled map
From 0.000000 to 4.096000
100 us light curve (15-350 keV)
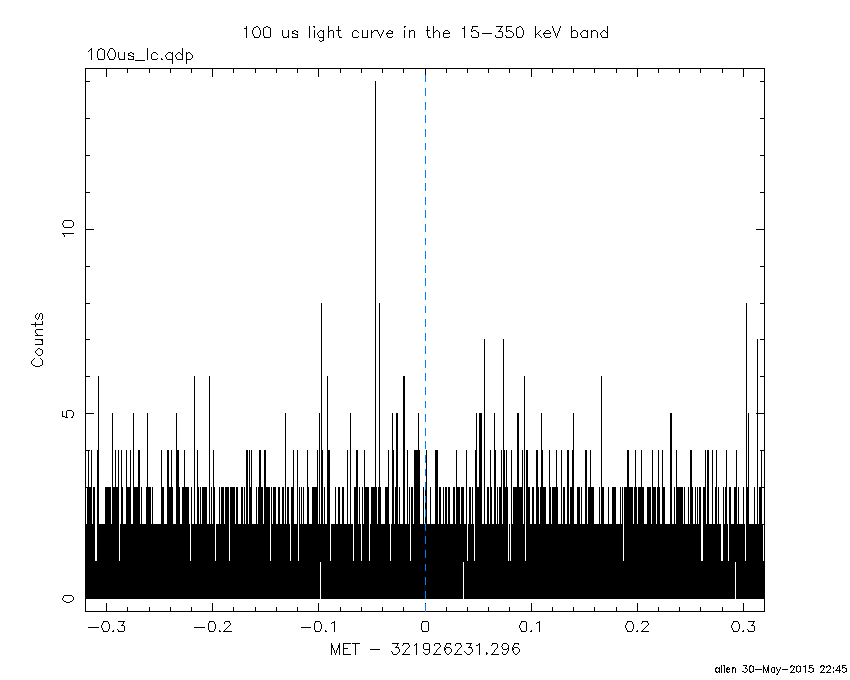
Blue+Cyan dotted lines: Time interval of the scaled map
From 0.000000 to 4.096000
Spacecraft aspect plot

Bright source in the pre-burst/pre-slew/post-slew images
Pre-burst image of 15-350 keV band
Time interval of the image:
-239.296000 -66.764000

# RAcent  DECcent POSerr Theta    Phi  PeakCts   SNR AngSep     Name
#  [deg]    [deg]    ['] [deg]  [deg]                   [']
244.9813 -15.6396    0.4  26.0   98.2   7.2703  28.4    0.1	Sco X-1
255.9185 -37.8373    1.4  20.6   35.6   1.5295   8.0    3.3	4U 1700-377
256.3032 -36.4328    4.9  19.4   37.9   0.4407   2.3    6.4	GX 349+2
263.0921 -24.7381    2.0   8.2   69.0   0.9593   5.7    4.6	GX 1+4
264.5677 -44.2850    0.0  22.8   11.3   0.3553   2.0   12.4	4U 1735-44
268.4029  -1.4177    4.3  21.1  169.2   0.5183   2.7    3.0	SW J1753.5-0127
270.2820 -25.0678    2.6   3.1   21.5   0.8424   4.5    0.7	GX 5-1
270.2121 -25.7243    4.5   3.7   18.3   0.4879   2.6    5.0	GRS 1758-258
274.1583 -14.0741    6.2   8.5 -165.0   0.3360   1.9    9.2	GX 17+2
275.7520 -30.5174    0.0   9.0  -25.1   0.2403   1.4   12.7	H1820-303
285.2083 -25.0269    4.1  12.7  -76.7   0.5053   2.9   11.3	HT1900.1-2455
288.7978  10.9331    1.5  37.2 -153.2   1.8614   7.8    0.7	GRS 1915+105
262.9226 -33.7791    2.5  13.8   29.9   0.7627   4.6    4.7	GX 354-0
238.7225 -14.2669    2.8  32.2   96.8   1.3778   4.1 ------	UNKNOWN
303.7665  23.2510    2.9  55.2 -145.3   5.1629   4.0 ------	UNKNOWN
Pre-slew background subtracted image of 15-350 keV band
Time interval of the image:
-66.764000 35.404600

# RAcent  DECcent POSerr Theta    Phi  PeakCts   SNR AngSep     Name
#  [deg]    [deg]    ['] [deg]  [deg]                   [']
245.0054 -15.5518    2.5  26.0   98.5   1.0023   4.6    5.5	Sco X-1
256.0181 -37.8361  187.2  20.5   35.4  -0.0098  -0.1    1.6	4U 1700-377
256.4355 -36.4234    4.7  19.3   37.7   0.3839   2.5    0.0	GX 349+2
263.1589 -24.9078    0.0   8.2   67.7  -0.1132  -0.8   12.7	GX 1+4
264.7258 -44.3397    6.9  22.8   11.0   0.2513   1.7    6.7	4U 1735-44
268.5000  -1.6065    0.0  20.9  169.4   0.2843   1.8   12.2	SW J1753.5-0127
270.4251 -24.9344    8.3   2.9   20.2   0.1992   1.4   11.6	GX 5-1
270.4748 -25.6065    4.8   3.5   15.3   0.3582   2.5   12.4	GRS 1758-258
273.9717 -13.9578    3.7   8.6 -166.4   0.4312   3.1    5.1	GX 17+2
275.8936 -30.2176   11.8   8.8  -26.7  -0.1358  -1.0    9.1	H1820-303
284.9679 -25.0468    4.7  12.5  -76.4  -0.3596  -2.5    8.4	HT1900.1-2455
288.6538  11.1028    0.0  37.3 -153.5   0.4243   2.1   12.7	GRS 1915+105
263.0800 -33.6935    6.4  13.7   29.7  -0.2431  -1.8    9.6	GX 354-0
228.9457 -42.1475    2.7  40.6   48.7   1.7341   4.2 ------	UNKNOWN
279.2047  17.5367    0.4  40.5 -170.6   6.5046  28.9 ------	UNKNOWN
Post-slew image of 15-350 keV band
Time interval of the image:
93.804590 559.304600

# RAcent  DECcent POSerr Theta    Phi  PeakCts   SNR AngSep     Name
#  [deg]    [deg]    ['] [deg]  [deg]                   [']
244.9749 -15.6469    0.8  47.3   41.5  18.9665  13.6    0.5	Sco X-1
254.4593  35.3465   19.1  28.3  128.0  -0.2761  -0.6    0.3	Her X-1
262.9863 -24.7232    3.2  45.1   15.0   2.4604   3.6    1.8	GX 1+4
268.4278  -1.4826    2.3  21.8   24.3   1.5682   5.0    4.0	SW J1753.5-0127
270.2438 -25.1034    3.7  43.5    5.9   1.6705   3.1    2.6	GX 5-1
270.1980 -25.6868    4.2  44.1    5.7   1.5347   2.7    6.6	GRS 1758-258
273.9243 -14.0241    3.2  32.0    3.7   1.4073   3.6    4.8	GX 17+2
275.8884 -30.4985    5.4  48.1   -2.1  -1.5225  -2.2    8.1	H1820-303
284.9562 -24.9355    9.3  42.8  -13.6   0.6147   1.3    4.4	HT1900.1-2455
288.8081  10.9442    0.5  11.4  -62.0   7.4452  24.6    0.6	GRS 1915+105
299.6094  35.1995    2.2  25.3 -144.1   1.6935   5.2    0.9	Cyg X-1
308.0637  41.1269   14.0  34.2 -145.6   0.3553   0.8   10.7	Cyg X-3
326.3090  38.3049    7.2  45.9 -132.7   1.7817   1.6    6.5	Cyg X-2
263.0931 -33.9582    5.0  53.7   10.6   3.1858   2.3    9.0	GX 354-0
239.8359  17.0201    3.4  37.5   89.4   3.7733   3.4 ------	UNKNOWN
245.3513  18.2019    2.2  32.2   90.6   3.7251   5.3 ------	UNKNOWN
268.3370  23.7797    3.2  11.9  117.6   1.1412   3.6 ------	UNKNOWN
286.5694  71.5135    3.5  54.2  177.0   4.2523   3.3 ------	UNKNOWN
303.5440  39.8085    3.0  30.7 -147.5   1.2951   3.9 ------	UNKNOWN
335.6099  50.0656    5.6  55.3 -145.3   5.0587   2.1 ------	UNKNOWN
Plot creation:
Sat May 30 22:45:47 EDT 2015