Special notes of this burst
Image
Pre-slew 15.0-350.0 keV image (Event data)
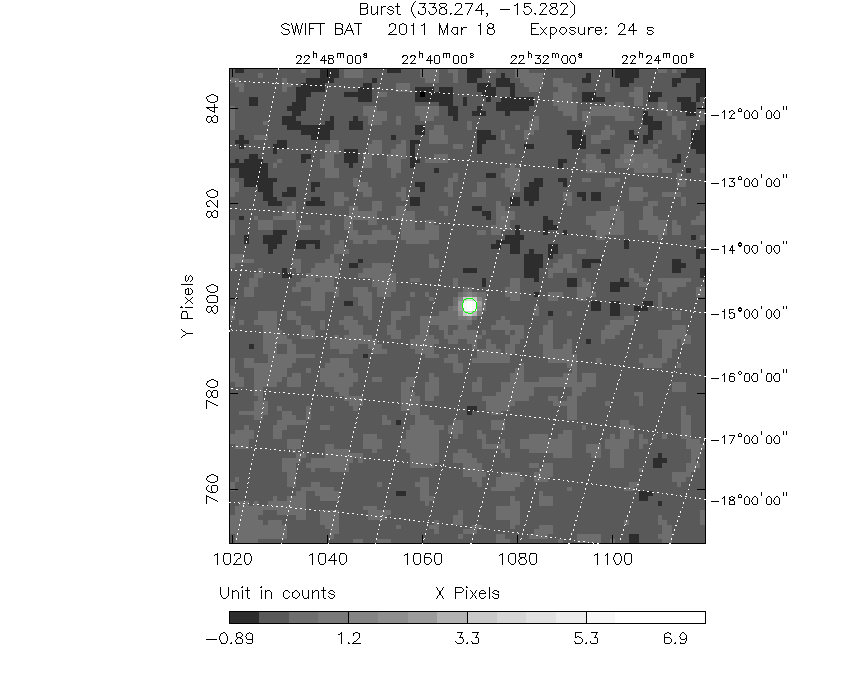
#   RAcent    DECcent   POSerr    Theta     Phi              Peak Cts       SNR   Name
  338.2912   -15.2778   0.0050    38.1579  -120.5873         8.0844562     38.487 TRIG_00449542

Foreground time interval of the image:
-12.988  10.604 (delta_t =  23.592 [sec])
Background time interval of the image:
-119.368 -12.988 (delta_t = 106.380 [sec])
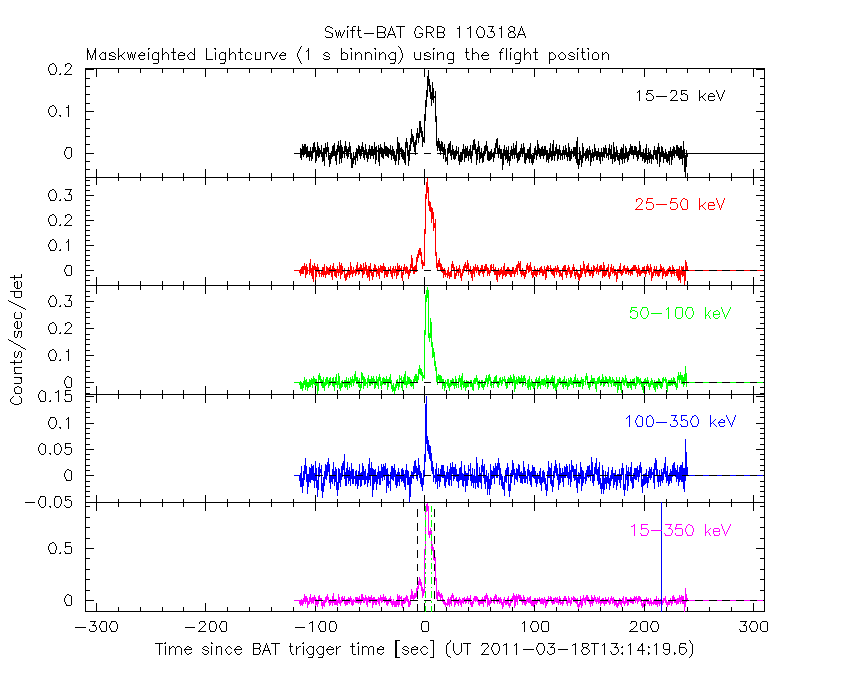
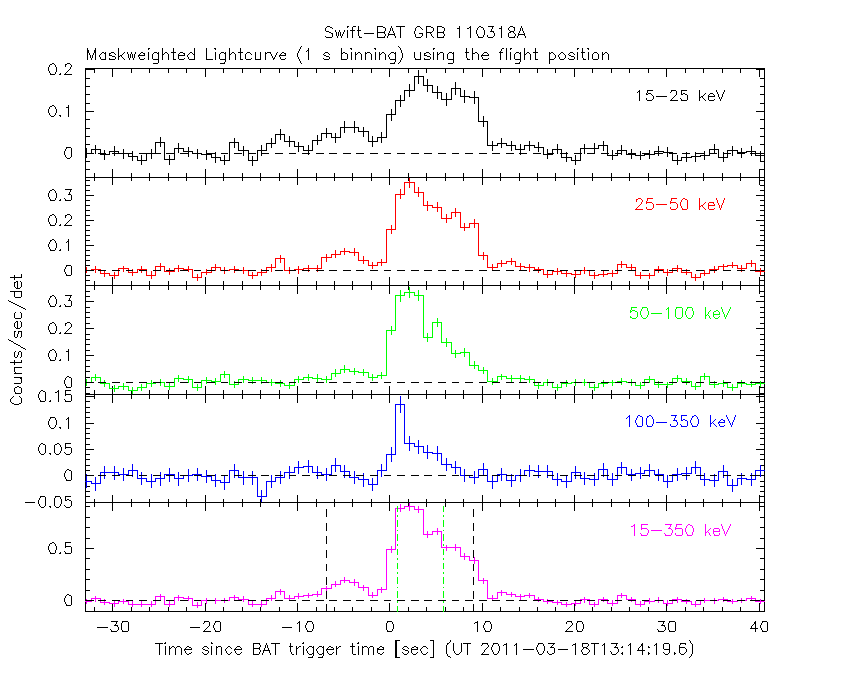
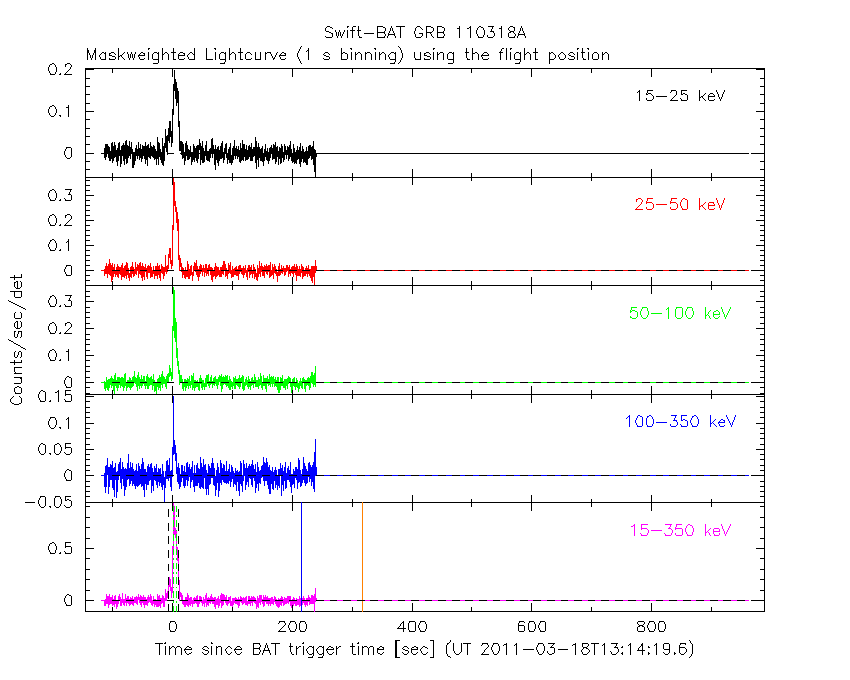
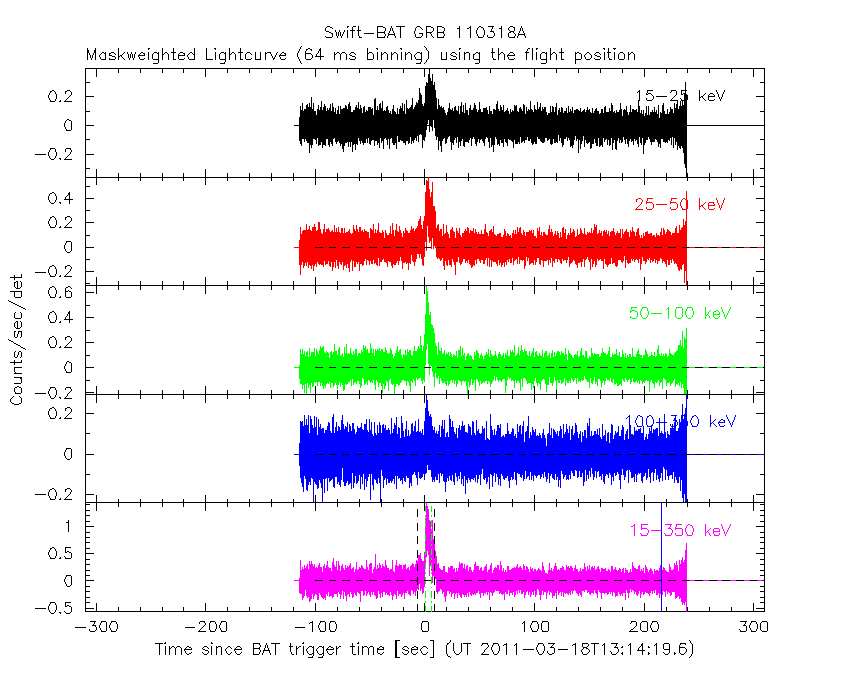
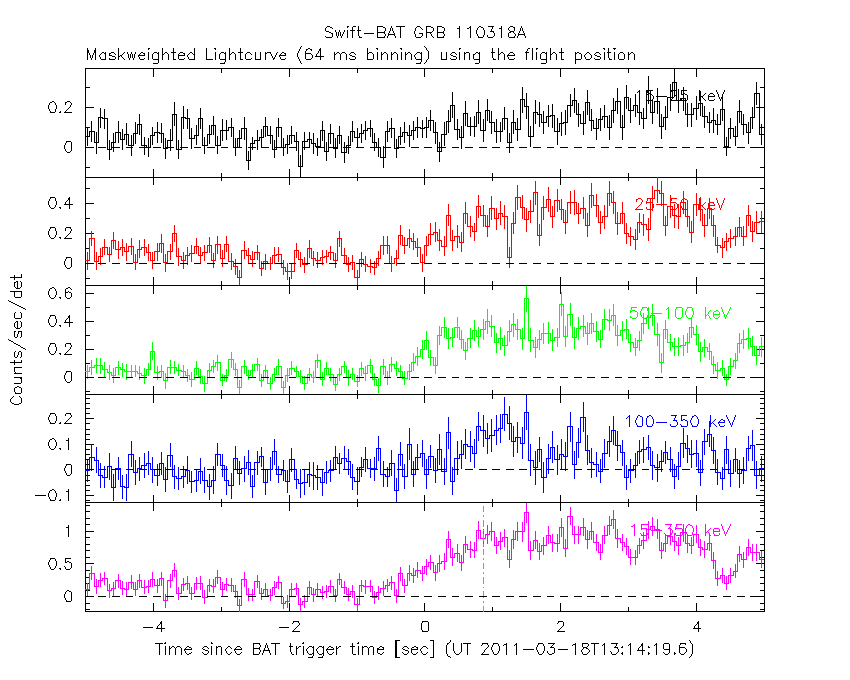
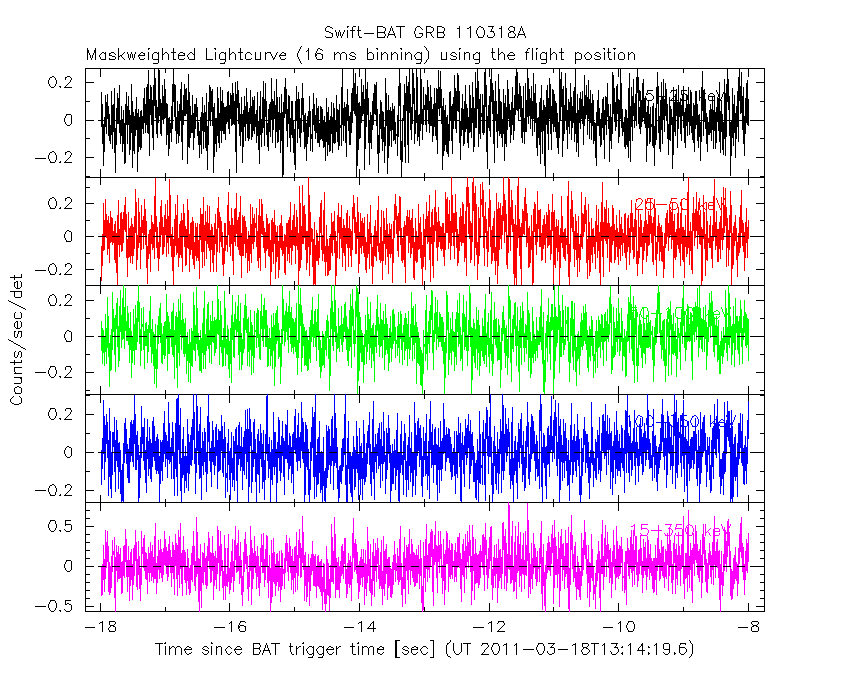
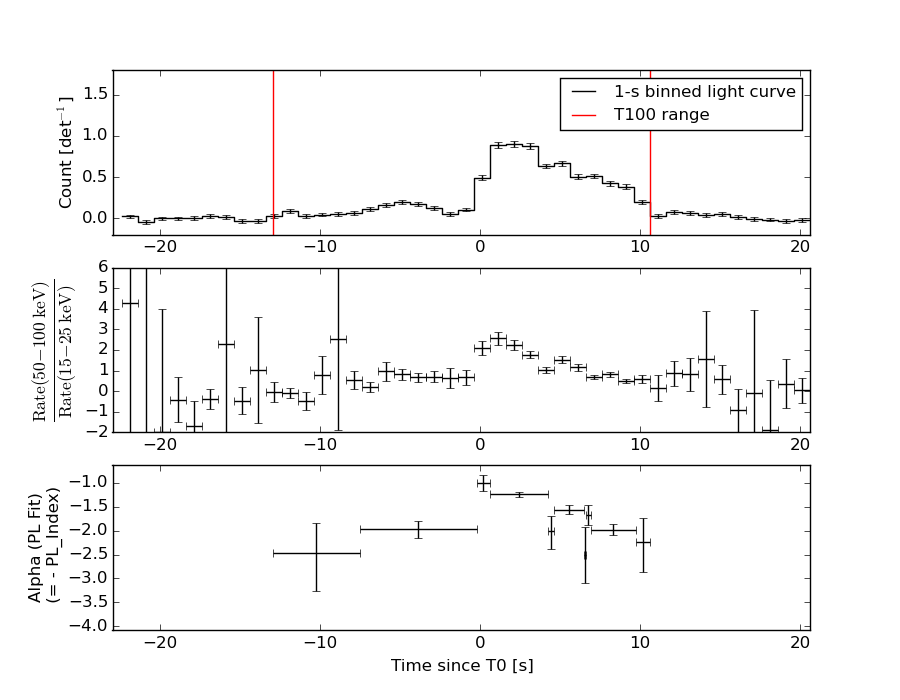
Lightcurves
Notes:
- 1) The mask-weighted light curves are using the flight position.
- 2) Multiple plots of different time binning/intervals are shown to cover all scenarios of short/long GRBs, rate/image triggers, and real/false positives.
- 3) For all the mask-weighted lightcurves, the y-axis units are counts/sec/det where a det is 0.4 x 0.4 = 0.16 sq cm.
- 4) The verticle lines correspond to following: green dotted lines are T50 interval, black dotted lines are T90 interval, blue solid line(s) is a spacecraft slew start time, and orange solid line(s) is a spacecraft slew end time.
- 5) Time of each bin is in the middle of the bin.
1 s binning
From T0-310 s to T0+310 s
From T100_start - 20 s to T100_end + 30 s
Full time interval
64 ms binning
Full time interval
From T100_start to T100_end
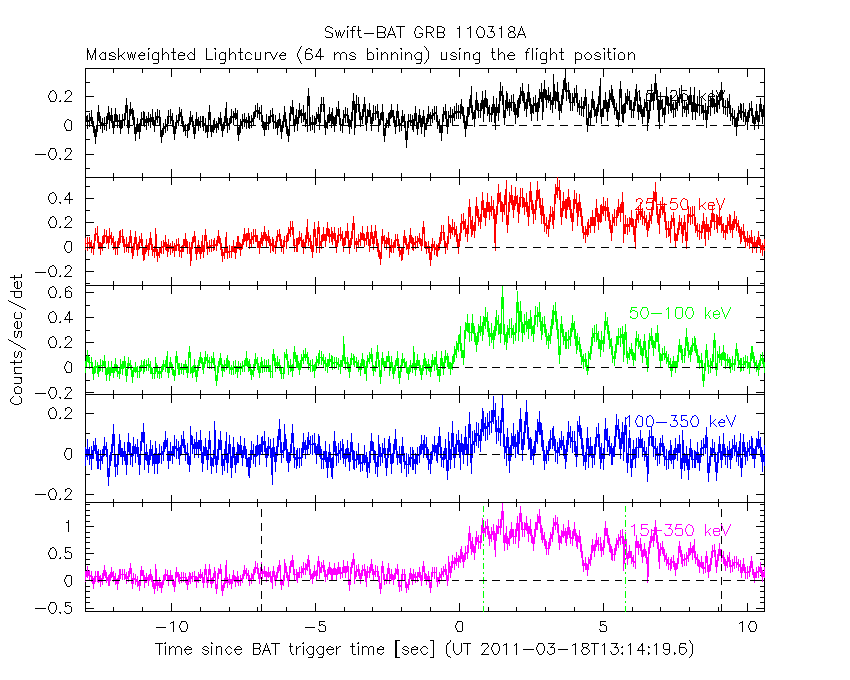
From T0-5 sec to T0+5 sec
16 ms binning
From T100_start-5 s to T100_start+5 s
Blue+Cyan dotted lines: Time interval of the scaled map
From 0.000000 to 1.024000
8 ms binning
From T100_start-3 s to T100_start+3 s
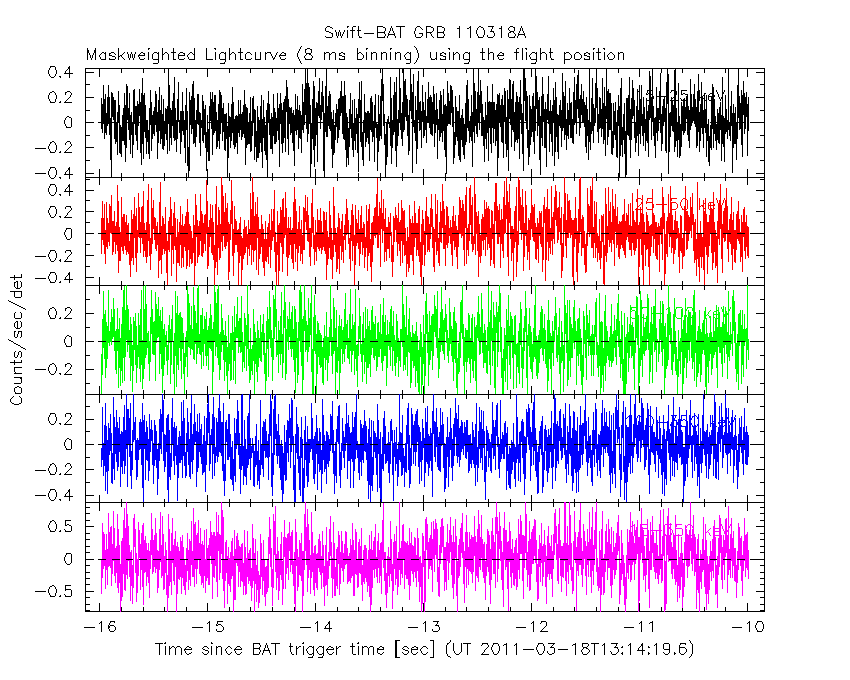
Blue+Cyan dotted lines: Time interval of the scaled map
From 0.000000 to 1.024000
2 ms binning
From T100_start-1 s to T100_start+1 s
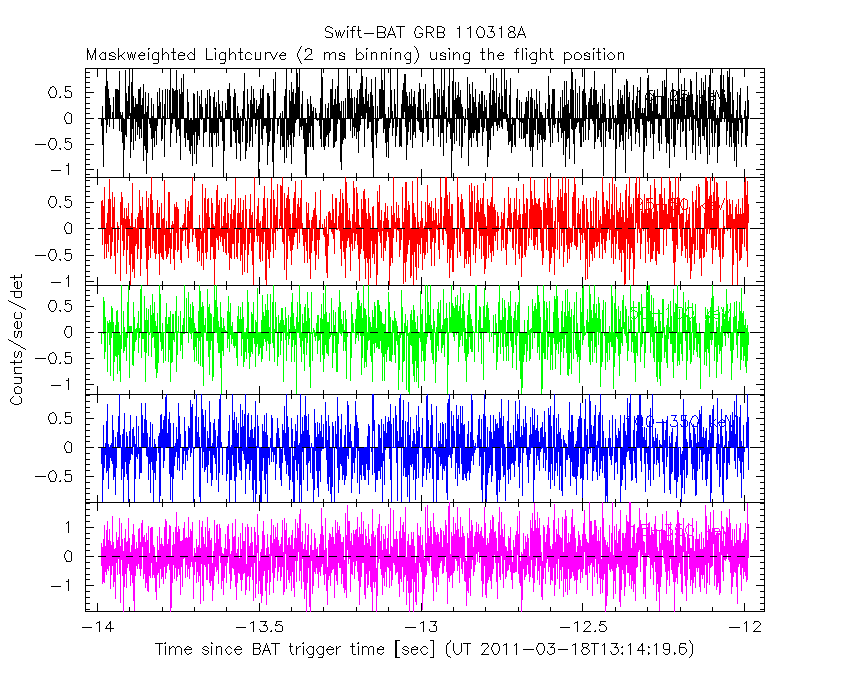
Blue+Cyan dotted lines: Time interval of the scaled map
From 0.000000 to 1.024000
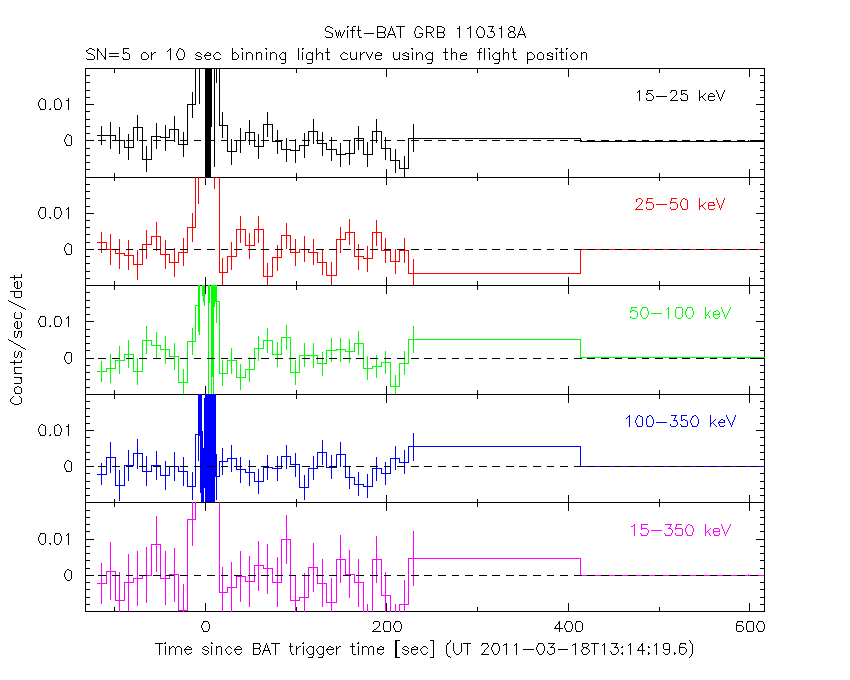
SN=5 or 10 sec. binning (whichever binning is satisfied first)
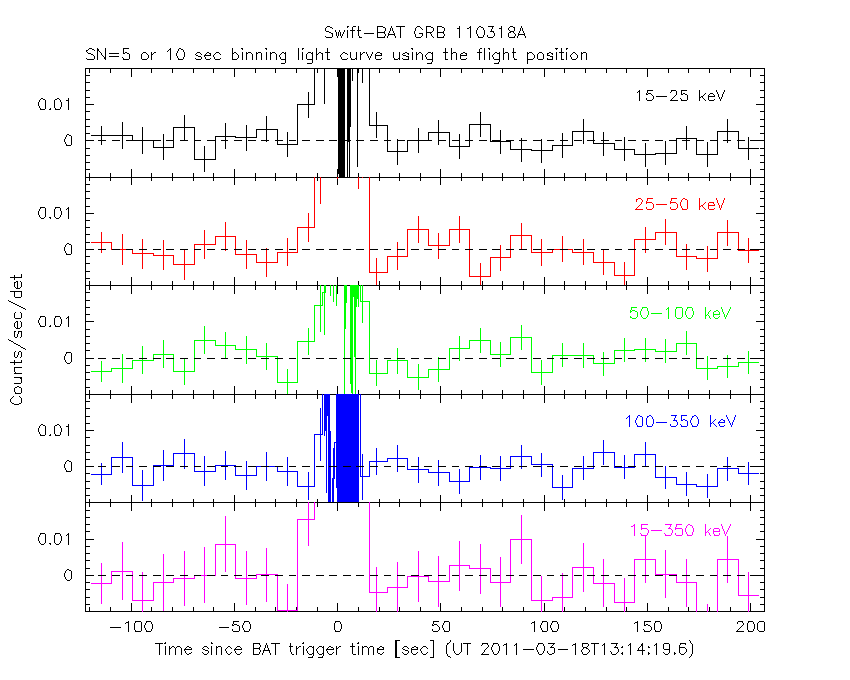
SN=5 or 10 sec. binning (T < 200 sec)
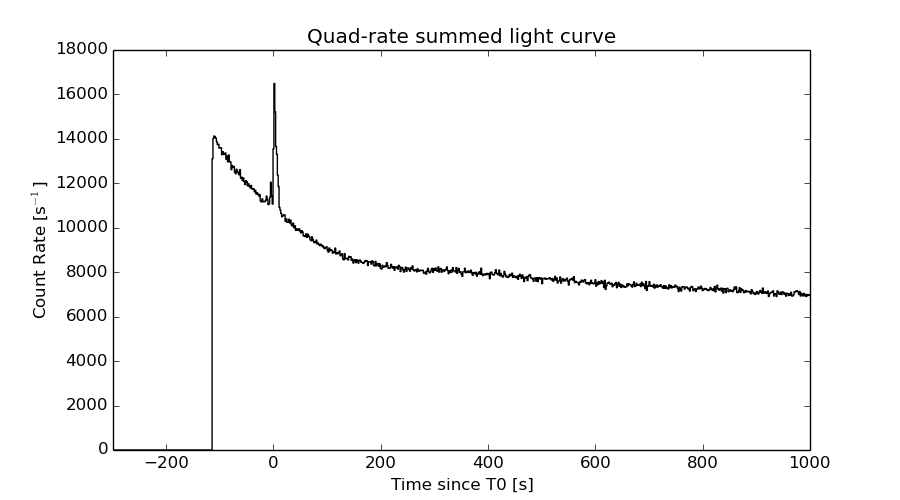
Quad-rate summed light curves (from T0-300s to T0+1000s)
Spectral Evolution
Spectra
Notes:
- 1) The fitting includes the systematic errors.
- 2) When the burst includes telescope slew time periods, the fitting uses an average response file made from multiple 5-s response files through out the slew time plus single time preiod for the non-slew times, and weighted by the total counts in the corresponding time period using addrmf. An average response file is needed becuase a spectral fit using the pre-slew DRM will introduce some errors in both a spectral shape and a normalization if the PHA file contains a lot of the slew/post-slew time interval.
- 3) For fits to more complicated models (e.g. a power-law over a cutoff power-law), the BAT team has decided to require a chi-square improvement of more than 6 for each extra dof.
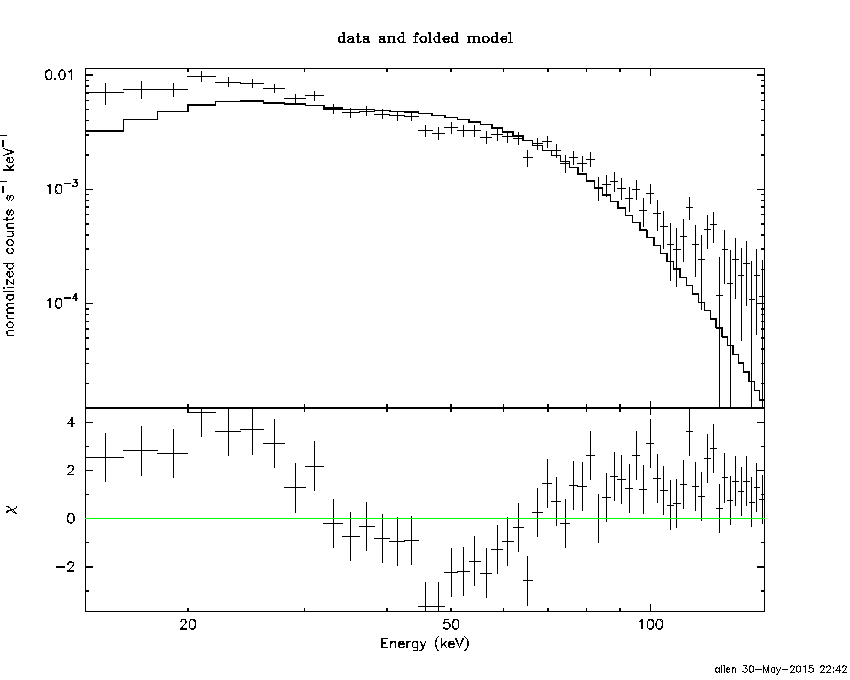
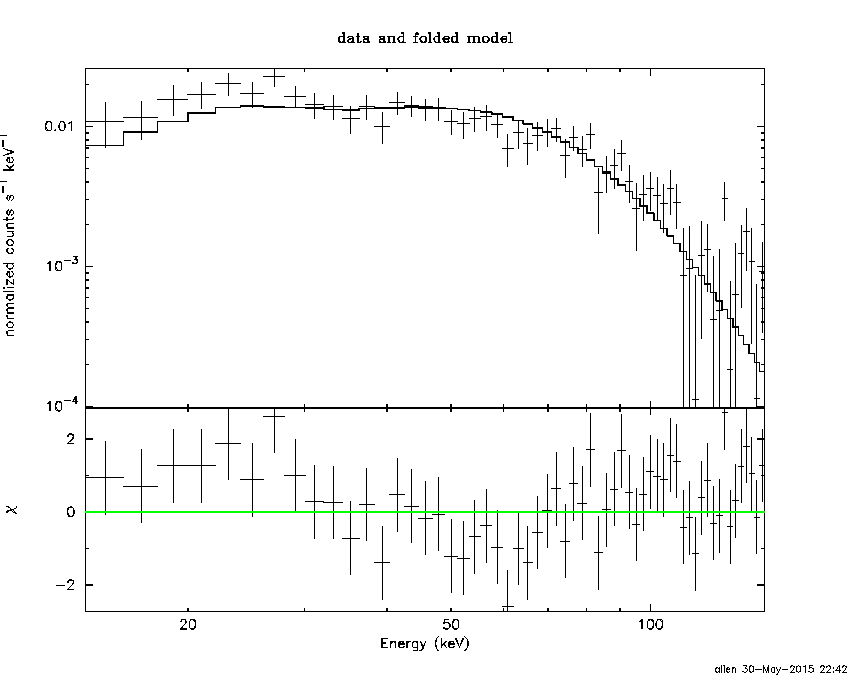
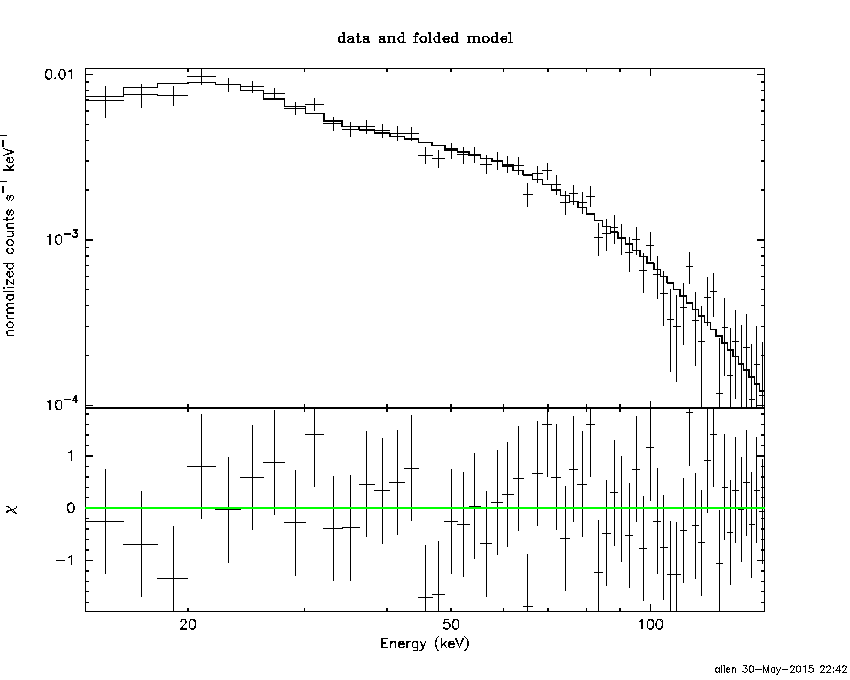
Time averaged spectrum fit using the average DRM
Power-law model
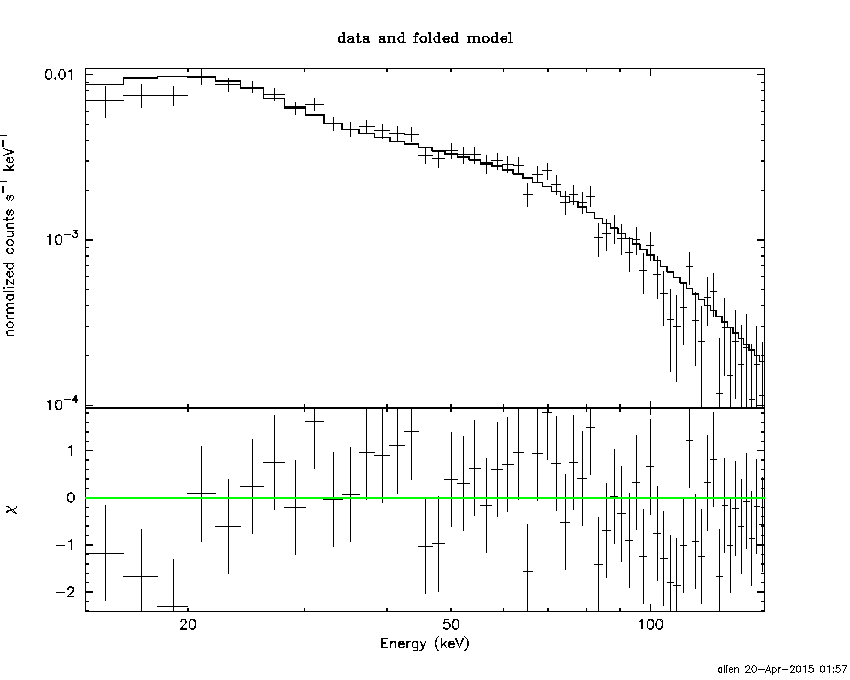
Time interval is from  -12.988 sec. to   10.604 sec.

Spectral model in power-law:
------------------------------------------------------------
Parameters  : value       lower 90%   higher 90%
Photon index: 1.57966     ( -0.0543272   0.0545001 )
Norm@50keV  : 2.30839E-02    ( -0.000700819   0.000700376 )
------------------------------------------------------------
#Fit statistic : Chi-Squared =          58.31 using 59 PHA bins.
# Reduced chi-squared =          1.023 for     57 degrees of freedom
# Null hypothesis probability =   4.271114e-01

Photon flux (15-150 keV)    in 23.59 sec: 2.94800 ( -0.0950736  0.0952705 ) ph/cm2/s
Energy fluence (15-150 keV)             : 5.10575e-06 ( -1.641e-07  1.64416e-07 ) ergs/cm2
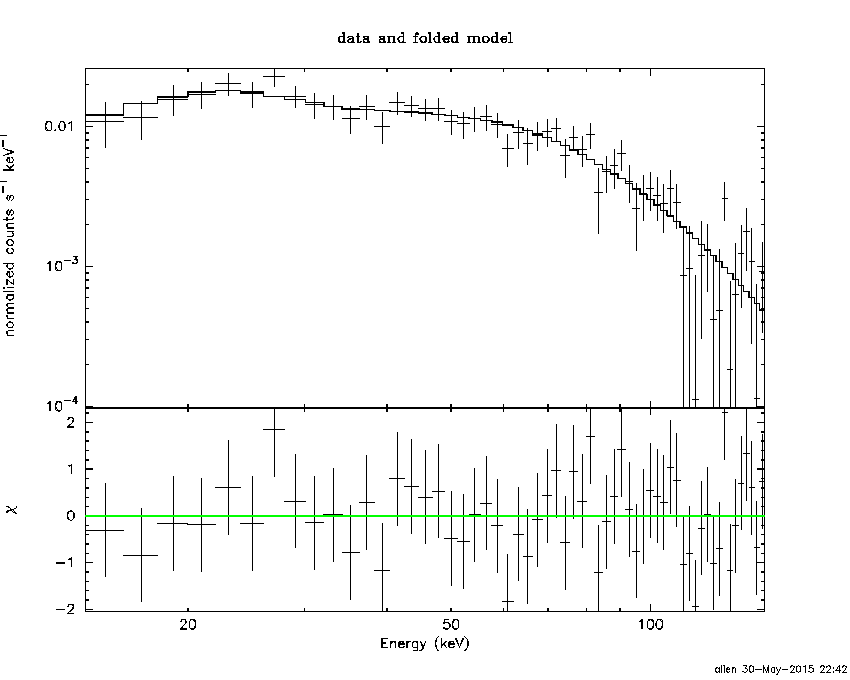
Cutoff power-law model
Time interval is from  -12.988 sec. to   10.604 sec.
Spectral model in the cutoff power-law:
------------------------------------------------------------
Parameters  : value       lower 90%   higher 90%
Photon index: 1.06002     ( -0.24068   0.22854 )
Epeak [keV] : 94.6469      ( -14.8382 33.3747 )
Norm@50keV  : 4.10066E-02    ( -0.00894936   0.0121905 )
------------------------------------------------------------
#Fit statistic : Chi-Squared =          42.29 using 59 PHA bins.
# Reduced chi-squared =         0.7553 for     56 degrees of freedom
# Null hypothesis probability =   9.122141e-01

Photon flux (15-150 keV)    in 23.59 sec: 2.85282 ( -0.10247  0.10277 ) ph/cm2/s
Energy fluence (15-150 keV)             : 4.92965e-06 ( -1.82657e-07  1.82209e-07 ) ergs/cm2
Band function

Time interval is from  -12.988 sec. to   10.604 sec.

Spectral model in the Band function:
------------------------------------------------------------
Parameters  : value       lower 90%   higher 90%
alpha       : -1.04792   ( -0.250076   2.95979 )
beta        : -2.21812    ( 2.15205   0.486307 )
Epeak [keV] : 93.2389      ( -46.2466 35.4039 )
Norm@50keV   : 4.16010E-02    ( -0.0102608   1.93756 )
------------------------------------------------------------
#Fit statistic : Chi-Squared =          42.24 using 59 PHA bins.
# Reduced chi-squared =         0.7680 for     55 degrees of freedom
# Null hypothesis probability =   8.963549e-01

Photon flux (15-150 keV)    in 23.59 sec: 2.84901 ( 4.15099  -0.10307 ) ph/cm2/s
Energy fluence (15-150 keV)             : 4.9623e-06 ( -4.96213e-06  -1.75863e-07 ) ergs/cm2
Single BB
Spectral model blackbody:
------------------------------------------------------------
Parameters  : value    Lower 90%  Upper 90%
kT [keV]    : 15.3122  (  )
R^2/D10^2   : 0.301057  (   )
(R is the radius in km and D10 is the distance to the source in units of 10 kpc)
------------------------------------------------------------
#Fit statistic : Chi-Squared =         229.96 using 59 PHA bins.
# Reduced chi-squared =         4.0343 for     57 degrees of freedom
# Null hypothesis probability =   1.233898e-22

Energy  Fluence     90% Error
[keV]   [erg/cm2]   [erg/cm2]
15- 25  3.474e-07   2.064e-08
25- 50  1.406e-06   5.579e-08
50-150  2.264e-06   1.302e-07
15-150  4.018e-06   1.368e-07
Thermal bremsstrahlung (OTTB)

Spectral model: thermal bremsstrahlung
------------------------------------------------------------
Parameters  : value         Lower 90%    Upper 90%
kT [keV]    : 198.074       (      )
Norm        : 11.9348       (-0.366169     0.443555)
------------------------------------------------------------
#Fit statistic : Chi-Squared =          44.38 using 59 PHA bins.
# Reduced chi-squared =         0.7786 for     57 degrees of freedom
# Null hypothesis probability =   8.885721e-01

Energy  Fluence     90% Error
[keV]   [erg/cm2]   [erg/cm2]
15- 25  7.012e-07   2.701e-08
25- 50  1.348e-06   4.895e-08
50-150  2.954e-06   1.109e-07
15-150  5.004e-06   2.100e-07
Double BB
Spectral model: bbodyrad<1> + bbodyrad<2>
------------------------------------------------------------
Parameters  : value         Lower 90%    Upper 90%
kT1 [keV]   : 7.13381        (-0.790498      0.867345)
R1^2/D10^2  : 2.68154        (-0.840208      1.34136)
kT2 [keV]   : 24.2567        (-2.21953      2.94666)
R2^2/D10^2  : 4.57876E-02    (-0.0163396   0.0209046)
------------------------------------------------------------
#Fit statistic : Chi-Squared =          40.18 using 59 PHA bins.
# Reduced chi-squared =         0.7306 for     55 degrees of freedom
# Null hypothesis probability =   9.330840e-01

Energy  Fluence     90% Error
[keV]   [erg/cm2]   [erg/cm2]
15- 25  6.394e-07   7.584e-08
25- 50  1.375e-06   9.412e-08
50-150  2.876e-06   2.949e-07
15-150  4.890e-06   4.057e-07
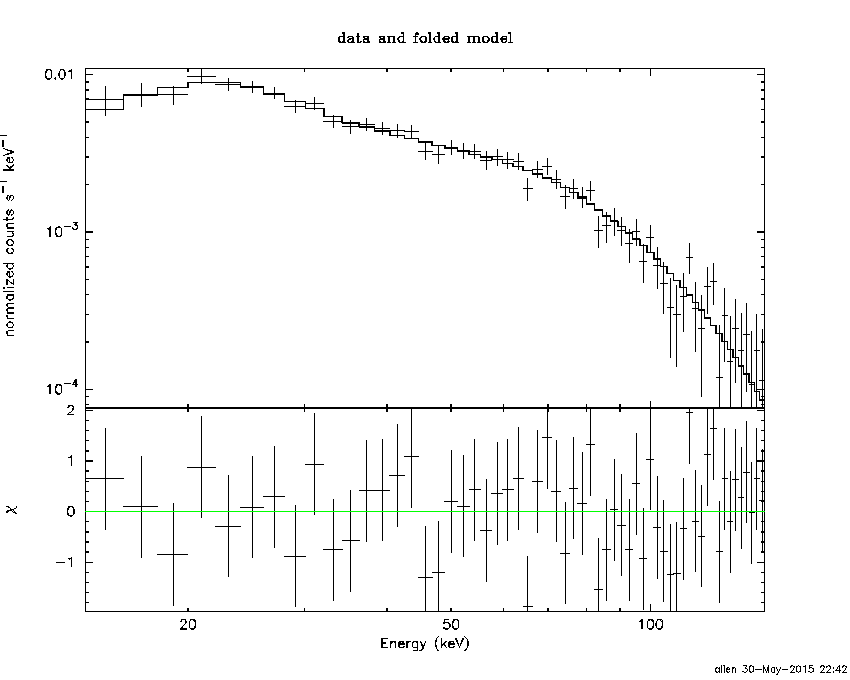
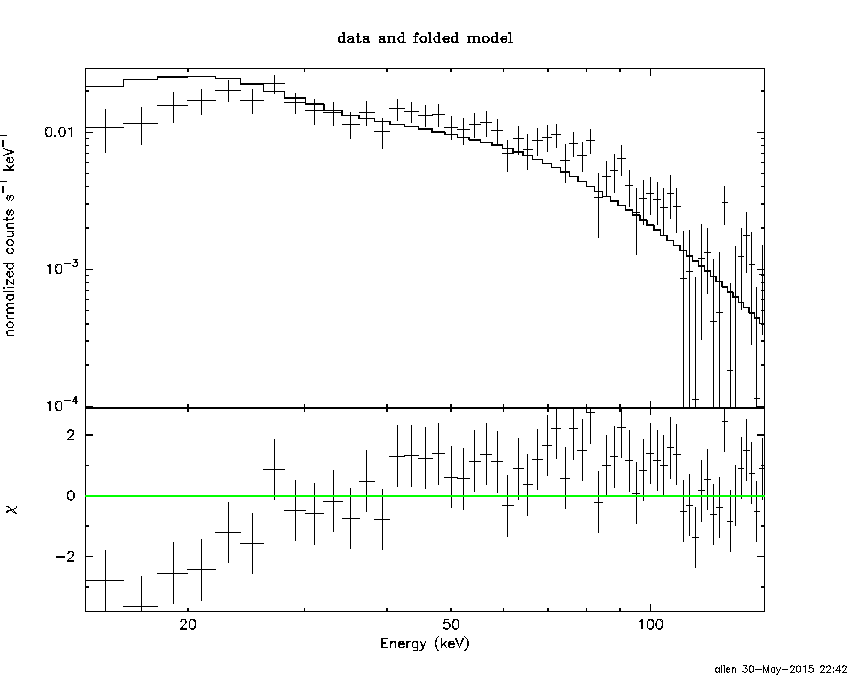
Peak spectrum fit
Power-law model
Time interval is from    1.952 sec. to    2.952 sec.

Spectral model in power-law:
------------------------------------------------------------
Parameters  : value       lower 90%   higher 90%
Photon index: 1.14082     ( -0.0886128   0.0881721 )
Norm@50keV  : 6.90058E-02    ( -0.00391032   0.00390986 )
------------------------------------------------------------
#Fit statistic : Chi-Squared =          62.10 using 59 PHA bins.
# Reduced chi-squared =          1.090 for     57 degrees of freedom
# Null hypothesis probability =   2.993223e-01

Photon flux (15-150 keV)    in 1 sec: 8.03886 ( -0.466357  0.466706 ) ph/cm2/s
Energy fluence (15-150 keV)             : 7.12344e-07 ( -4.37765e-08  4.38779e-08 ) ergs/cm2
Cutoff power-law model

Time interval is from    1.952 sec. to    2.952 sec.
Spectral model in the cutoff power-law:
------------------------------------------------------------
Parameters  : value       lower 90%   higher 90%
Photon index: 0.153751     ( -0.43872   0.399573 )
Epeak [keV] : 104.324      ( -16.6057 33.5978 )
Norm@50keV  : 0.197971    ( -0.0670203   0.112108 )
------------------------------------------------------------
#Fit statistic : Chi-Squared =          42.09 using 59 PHA bins.
# Reduced chi-squared =         0.7516 for     56 degrees of freedom
# Null hypothesis probability =   9.159247e-01

Photon flux (15-150 keV)    in 1 sec: 7.86536 ( -0.47121  0.47258 ) ph/cm2/s
Energy fluence (15-150 keV)             : 6.91303e-07 ( -4.6156e-08  4.5998e-08 ) ergs/cm2
Band function
Time interval is from    1.952 sec. to    2.952 sec.

Spectral model in the Band function:
------------------------------------------------------------
Parameters  : value       lower 90%   higher 90%
alpha       : -0.156249   ( -0.367166   0.417764 )
beta        : -9.37123    ( 9.37162   19.3716 )
Epeak [keV] : 104.483      ( -10.9457 33.2815 )
Norm@50keV   : 0.197380    ( -0.06319   0.0443967 )
------------------------------------------------------------
#Fit statistic : Chi-Squared =          42.09 using 59 PHA bins.
# Reduced chi-squared =         0.7652 for     55 degrees of freedom
# Null hypothesis probability =   8.994400e-01

Photon flux (15-150 keV)    in 1 sec:  (    ) ph/cm2/s
Energy fluence (15-150 keV)             : 6.88829e-07 ( 0  0 ) ergs/cm2
Single BB
Spectral model blackbody:
------------------------------------------------------------
Parameters  : value    Lower 90%  Upper 90%
kT [keV]    : 19.5729  (-1.26839  1.37907)
R^2/D10^2   : 0.428366  (-0.086404   0.106045)
(R is the radius in km and D10 is the distance to the source in units of 10 kpc)
------------------------------------------------------------
#Fit statistic : Chi-Squared =          69.40 using 59 PHA bins.
# Reduced chi-squared =          1.217 for     57 degrees of freedom
# Null hypothesis probability =   1.255776e-01

Energy  Fluence     90% Error
[keV]   [erg/cm2]   [erg/cm2]
15- 25  3.190e-08   3.470e-09
25- 50  1.566e-07   1.260e-08
50-150  4.434e-07   3.945e-08
15-150  6.319e-07   4.215e-08
Thermal bremsstrahlung (OTTB)
Spectral model: thermal bremsstrahlung
------------------------------------------------------------
Parameters  : value         Lower 90%    Upper 90%
kT [keV]    : 200.000       (      )
Norm        : 33.0030       (-1.92471     1.92456)
------------------------------------------------------------
#Fit statistic : Chi-Squared =         110.71 using 59 PHA bins.
# Reduced chi-squared =         1.9423 for     57 degrees of freedom
# Null hypothesis probability =   2.646406e-05

Energy  Fluence     90% Error
[keV]   [erg/cm2]   [erg/cm2]
15- 25  8.216e-08   5.155e-09
25- 50  1.580e-07   1.250e-08
50-150  3.466e-07   6.065e-08
15-150  5.868e-07   8.140e-08
Double BB
Spectral model: bbodyrad<1> + bbodyrad<2>
------------------------------------------------------------
Parameters  : value         Lower 90%    Upper 90%
kT1 [keV]   : 8.70454        (-2.30968      3.05187)
R1^2/D10^2  : 2.47343        (-1.2759      3.53967)
kT2 [keV]   : 26.8703        (-3.86702      8.0035)
R2^2/D10^2  : 0.122841    (-0.0782776   0.0558699)
------------------------------------------------------------
#Fit statistic : Chi-Squared =          40.57 using 59 PHA bins.
# Reduced chi-squared =         0.7377 for     55 degrees of freedom
# Null hypothesis probability =   9.269406e-01

Energy  Fluence     90% Error
[keV]   [erg/cm2]   [erg/cm2]
15- 25  5.064e-08   1.855e-08
25- 50  1.593e-07   4.048e-08
50-150  4.844e-07   1.533e-07
15-150  6.943e-07   1.869e-07
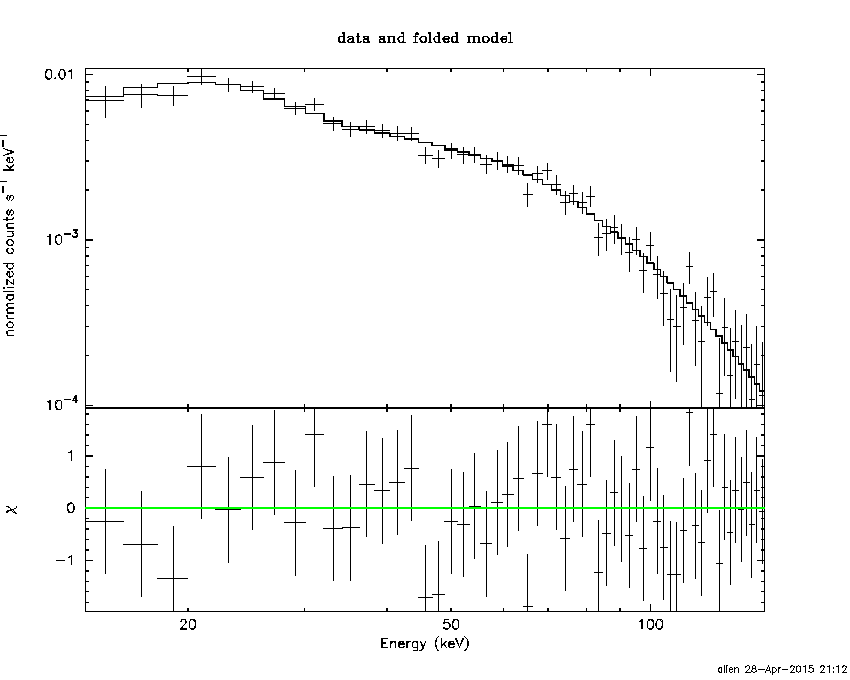
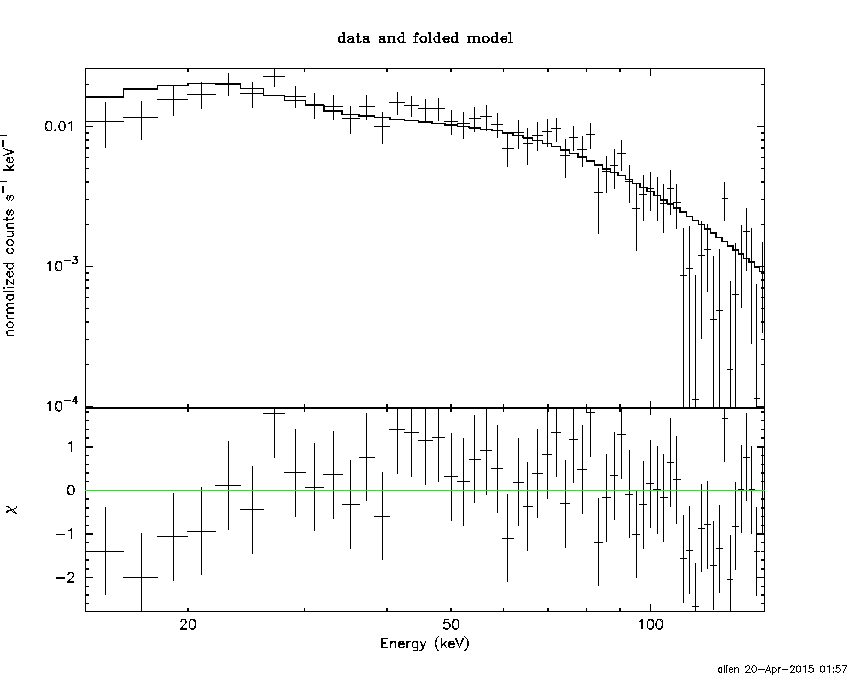
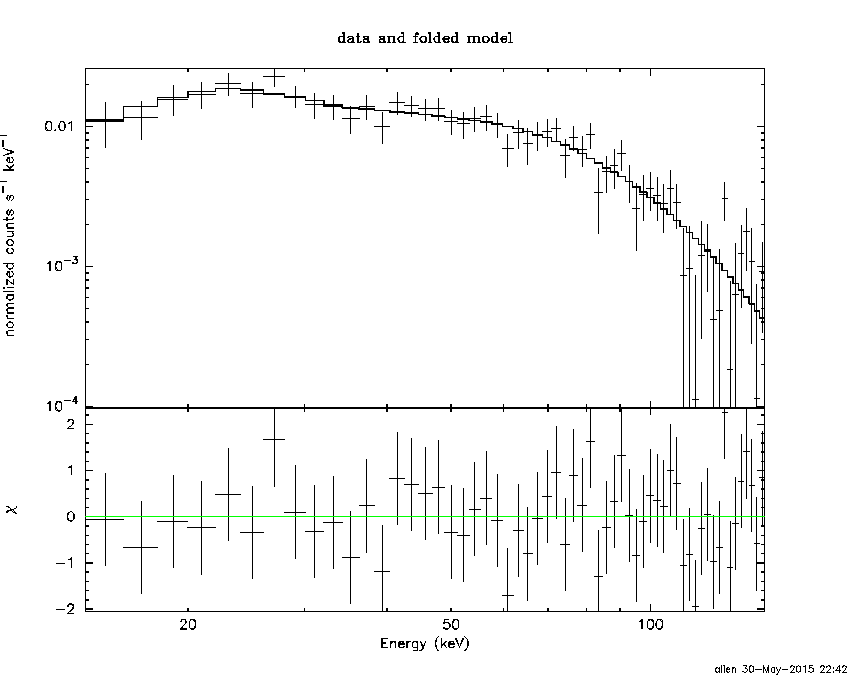
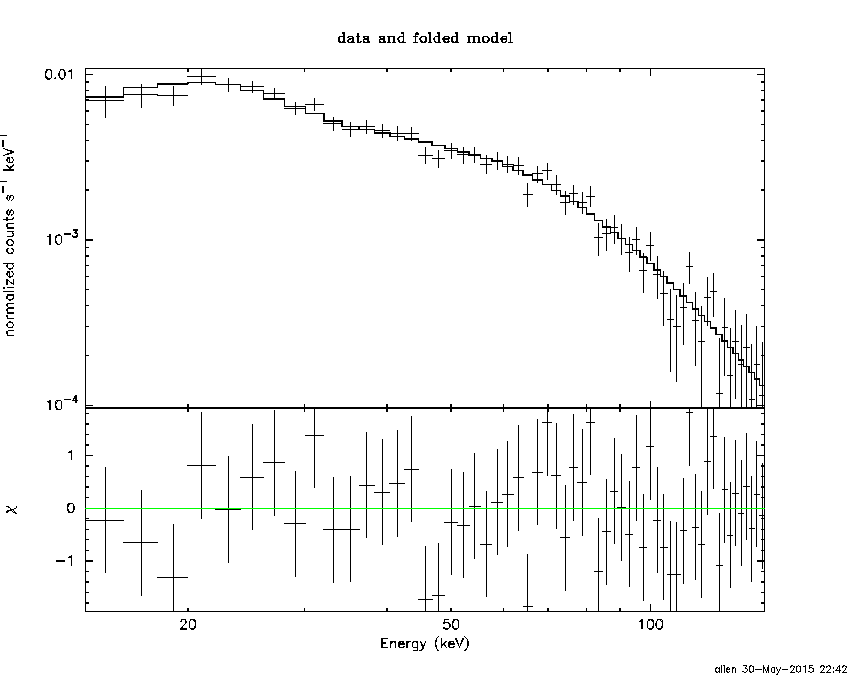
Pre-slew spectrum (Pre-slew PHA with pre-slew DRM)
Power-law model
Spectral model in power-law:
------------------------------------------------------------
Parameters  : value       lower 90%   higher 90%
Photon index: 1.57966     ( -0.0543272   0.0545001 )
Norm@50keV  : 2.30839E-02    ( -0.000700819   0.000700376 )
------------------------------------------------------------
#Fit statistic : Chi-Squared =          58.31 using 59 PHA bins.
# Reduced chi-squared =          1.023 for     57 degrees of freedom
# Null hypothesis probability =   4.271114e-01

Photon flux (15-150 keV)    in 23.59 sec: 2.94800 ( -0.0950736  0.0952705 ) ph/cm2/s
Energy fluence (15-150 keV)             : 5.10575e-06 ( -1.641e-07  1.64416e-07 ) ergs/cm2
Cutoff power-law model
Spectral model in the cutoff power-law:
------------------------------------------------------------
Parameters  : value       lower 90%   higher 90%
Photon index: 1.06002     ( -0.24068   0.22854 )
Epeak [keV] : 94.6469      ( -14.8382 33.3747 )
Norm@50keV  : 4.10066E-02    ( -0.00894936   0.0121905 )
------------------------------------------------------------
#Fit statistic : Chi-Squared =          42.29 using 59 PHA bins.
# Reduced chi-squared =         0.7553 for     56 degrees of freedom
# Null hypothesis probability =   9.122141e-01

Photon flux (15-150 keV)    in 23.59 sec: 2.85282 ( -0.10247  0.10277 ) ph/cm2/s
Energy fluence (15-150 keV)             : 4.92965e-06 ( -1.82657e-07  1.82209e-07 ) ergs/cm2
Band function
Spectral model in the Band function:
------------------------------------------------------------
Parameters  : value       lower 90%   higher 90%
alpha       : -1.04792   ( -0.250076   2.95979 )
beta        : -2.21812    ( 2.15205   0.486307 )
Epeak [keV] : 93.2389      ( -46.2466 35.4039 )
Norm@50keV   : 4.16010E-02    ( -0.0102608   1.68371 )
------------------------------------------------------------
#Fit statistic : Chi-Squared =          42.24 using 59 PHA bins.
# Reduced chi-squared =         0.7680 for     55 degrees of freedom
# Null hypothesis probability =   8.963549e-01

Photon flux (15-150 keV)    in 23.59 sec: 2.84901 ( 4.15099  -0.10307 ) ph/cm2/s
Energy fluence (15-150 keV)             : 4.9623e-06 ( -4.96213e-06  -1.75863e-07 ) ergs/cm2
S(25-50 keV) vs. S(50-100 keV) plot
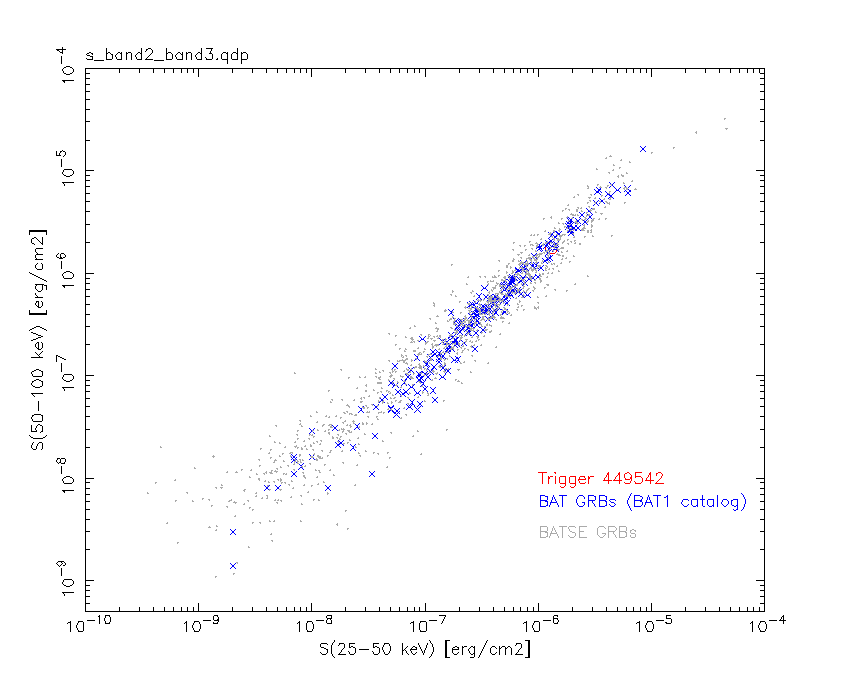
S(25-50 keV)  = 1.31e-06
S(50-100 keV) = 1.75e-06
T90 vs. Hardness ratio plot
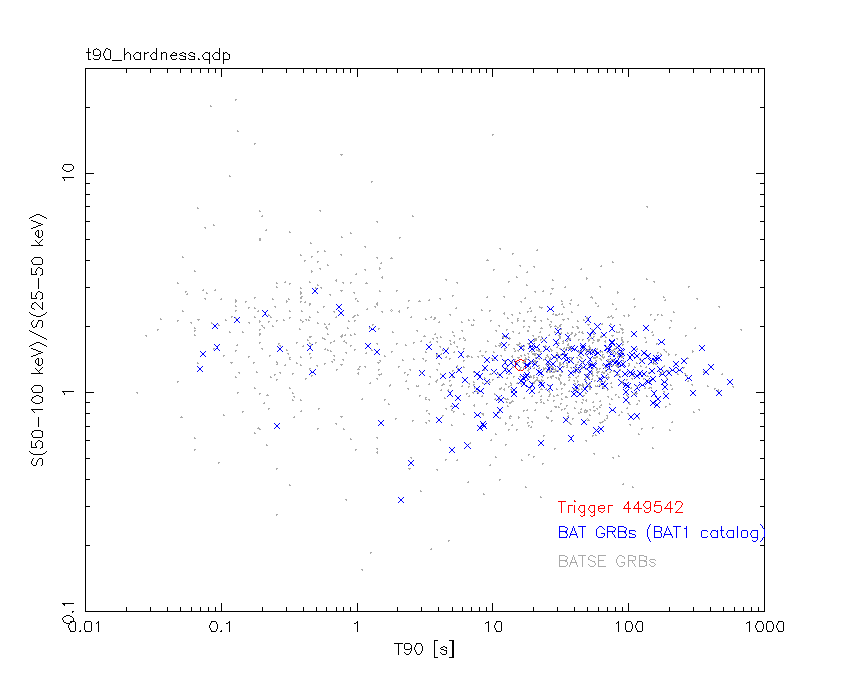
T90                                   = 15.9599999189377 sec.
Hardness ratio (energy fluence ratio) = 1.33588
Color vs. Color plot
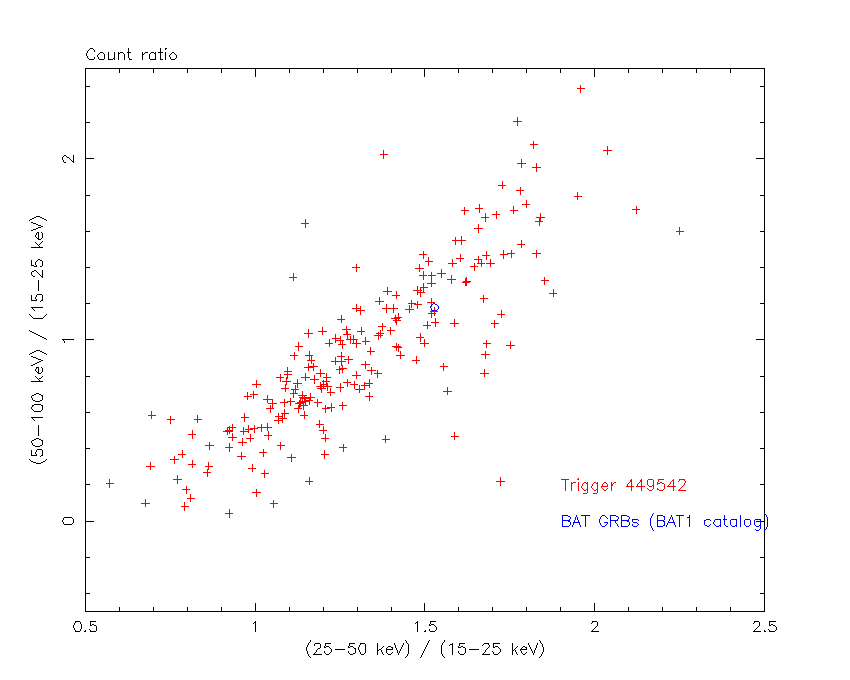
Count Ratio  (25-50 keV) / (15-25 keV) = 1.52755
Count Ratio (50-100 keV) / (15-25 keV) = 1.18105
Mask shadow pattern
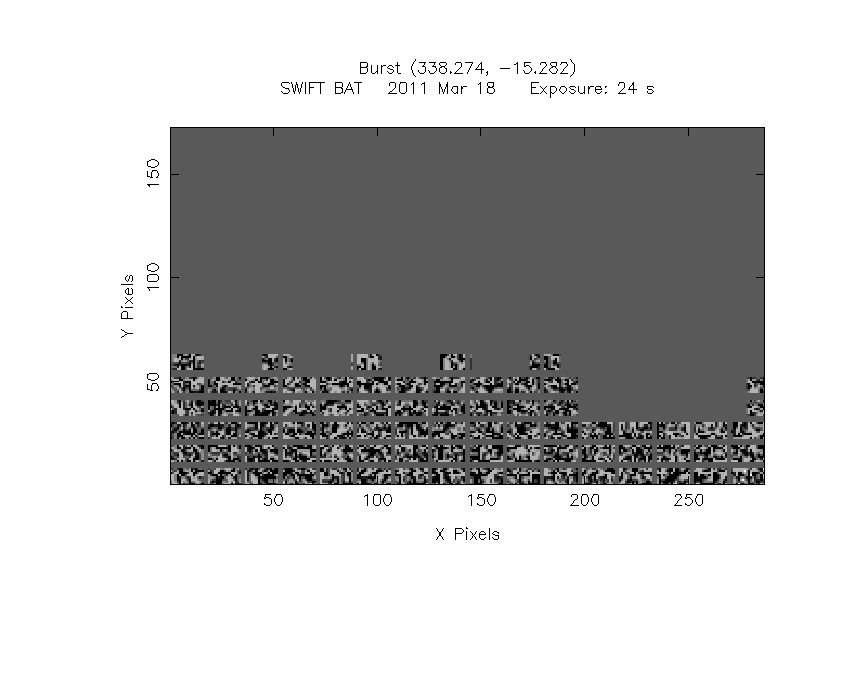
IMX = -3.998211337545512E-01, IMY = 6.764018492904426E-01
TIME vs. PHA plot around the trigger time
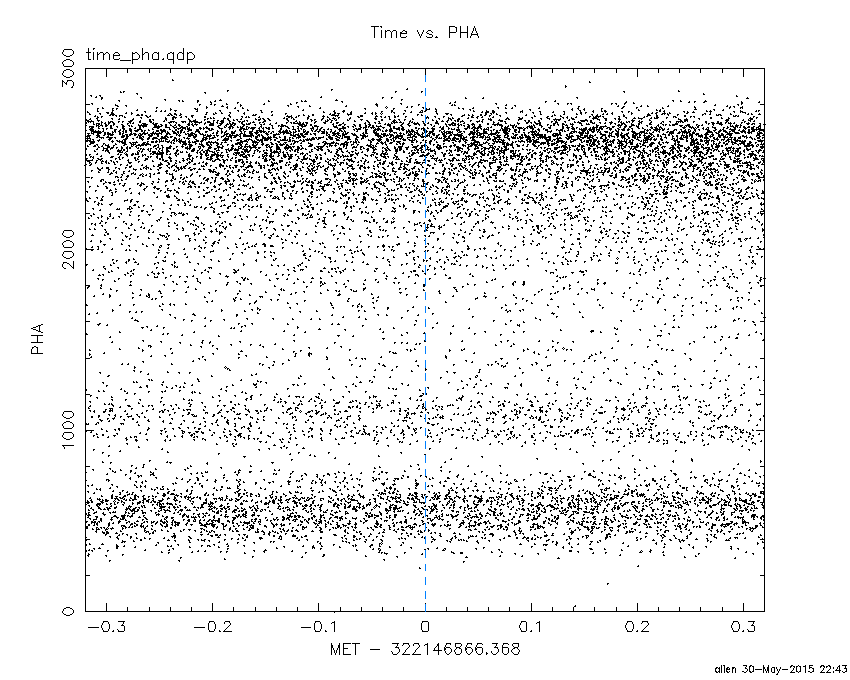
Blue+Cyan dotted lines: Time interval of the scaled map
From 0.000000 to 1.024000
TIME vs. DetID plot around the trigger time
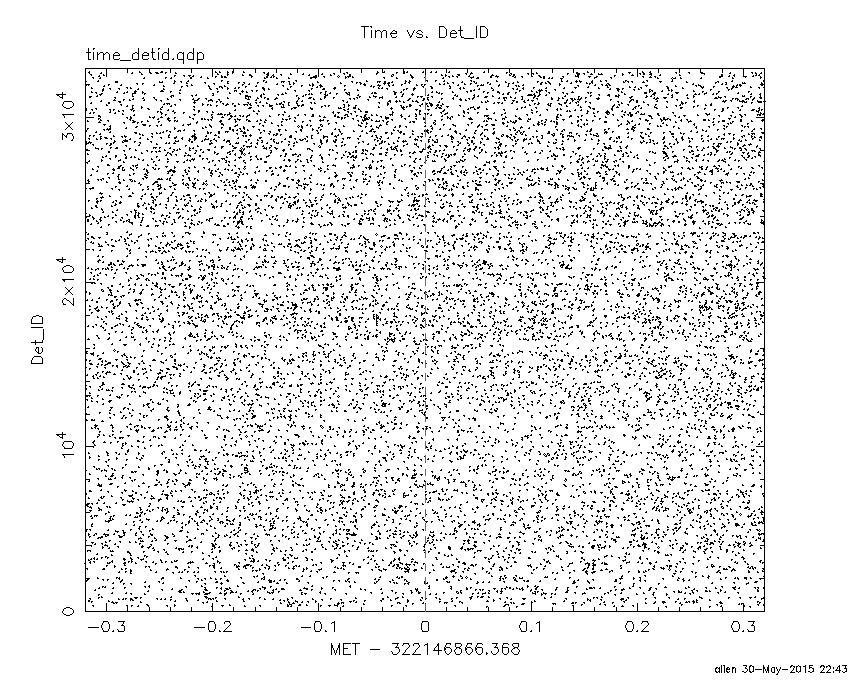
Blue+Cyan dotted lines: Time interval of the scaled map
From 0.000000 to 1.024000
100 us light curve (15-350 keV)
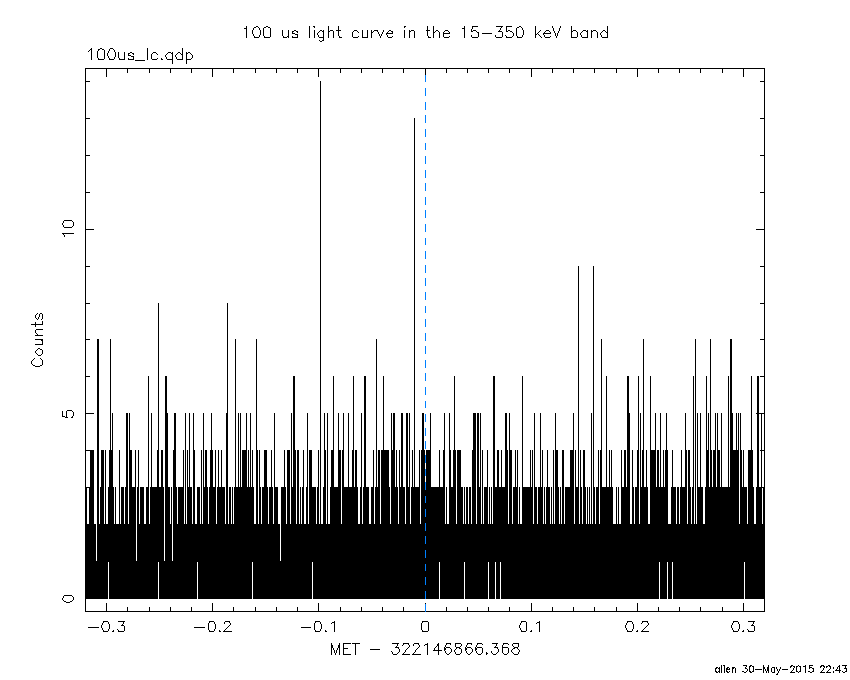
Blue+Cyan dotted lines: Time interval of the scaled map
From 0.000000 to 1.024000
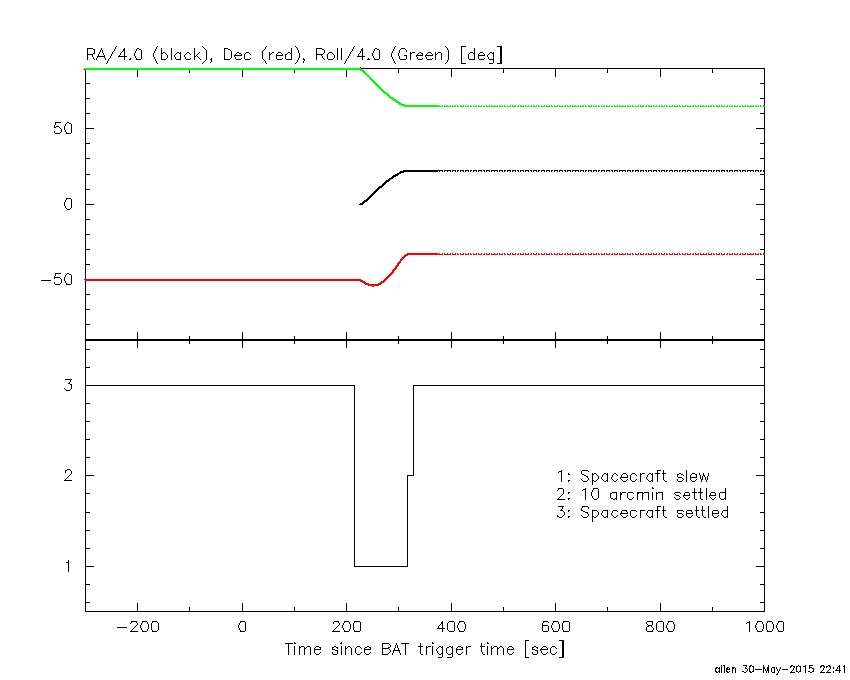
Spacecraft aspect plot
Bright source in the pre-burst/pre-slew/post-slew images
Pre-burst image of 15-350 keV band
Time interval of the image:
-119.368000 -12.988000

# RAcent  DECcent POSerr Theta    Phi  PeakCts   SNR AngSep     Name
#  [deg]    [deg]    ['] [deg]  [deg]                   [']
295.6474 -28.0400    2.8  51.3 -178.1   2.8793   4.1 ------	UNKNOWN
325.3212 -35.5352    3.1  27.6 -160.0   1.0536   3.8 ------	UNKNOWN
 54.3635 -18.8135    4.0  54.4  -12.8   2.3929   2.9 ------	UNKNOWN
357.0201 -21.6230    2.8  28.4  -90.7   1.5780   4.1 ------	UNKNOWN
Pre-slew background subtracted image of 15-350 keV band
Time interval of the image:
-12.988000 10.604000

# RAcent  DECcent POSerr Theta    Phi  PeakCts   SNR AngSep     Name
#  [deg]    [deg]    ['] [deg]  [deg]                   [']
 79.1049 -47.7674    2.5  50.7   31.8   1.6849   4.6 ------	UNKNOWN
 75.3951 -45.5836    2.4  49.9   27.6   1.3677   4.7 ------	UNKNOWN
338.2912 -15.2778    0.3  38.2 -120.6   8.0845  38.5 ------	UNKNOWN
Post-slew image of 15-350 keV band
Time interval of the image:
317.332600 962.662000

# RAcent  DECcent POSerr Theta    Phi  PeakCts   SNR AngSep     Name
#  [deg]    [deg]    ['] [deg]  [deg]                   [']
 83.6300  22.0225    0.9  55.4    4.5  25.0710  12.4    0.5	Crab
135.5198 -40.6373    3.9  37.4  125.9   2.9582   3.0    5.0	Vela X-1
101.4164 -11.4698    2.8  24.4   41.0   1.8315   4.1 ------	UNKNOWN
161.6433 -78.4922    3.6  54.1  177.1   4.8547   3.2 ------	UNKNOWN
 73.7522 -35.7445    2.7  12.9  -95.2   1.7182   4.4 ------	UNKNOWN
 58.5543 -29.0967    2.7  26.4  -78.8   2.3858   4.2 ------	UNKNOWN
 57.0157 -38.4502    4.1  26.4 -100.1   1.5898   2.8 ------	UNKNOWN
Plot creation:
Sat May 30 22:43:30 EDT 2015