Special notes of this burst
Image
Pre-slew 15.0-350.0 keV image (Event data)

#   RAcent    DECcent   POSerr    Theta     Phi              Peak Cts       SNR   Name
  211.6926   -51.5670   0.0127    17.7826   -61.1547         0.4218264     15.067 TRIG_00449549

Foreground time interval of the image:
 -1.692   3.688 (delta_t =   5.380 [sec])
Background time interval of the image:
-239.480  -1.692 (delta_t = 237.788 [sec])
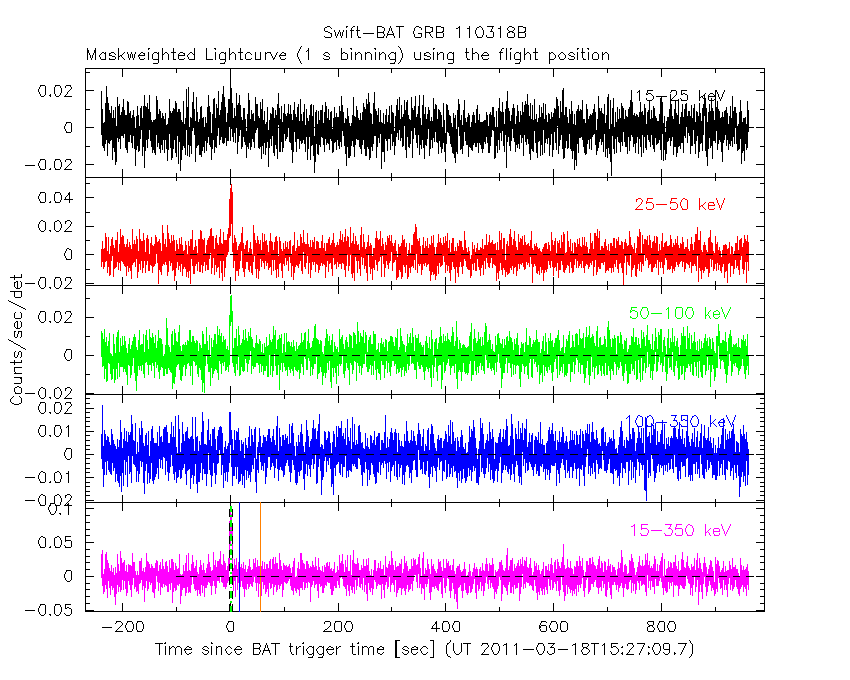
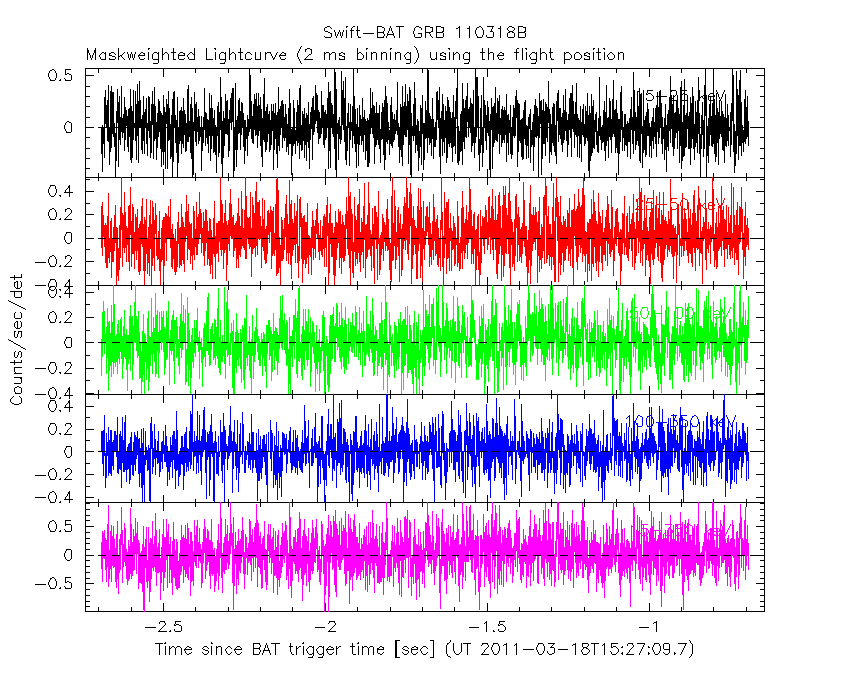
Lightcurves
Notes:
- 1) The mask-weighted light curves are using the flight position.
- 2) Multiple plots of different time binning/intervals are shown to cover all scenarios of short/long GRBs, rate/image triggers, and real/false positives.
- 3) For all the mask-weighted lightcurves, the y-axis units are counts/sec/det where a det is 0.4 x 0.4 = 0.16 sq cm.
- 4) The verticle lines correspond to following: green dotted lines are T50 interval, black dotted lines are T90 interval, blue solid line(s) is a spacecraft slew start time, and orange solid line(s) is a spacecraft slew end time.
- 5) Time of each bin is in the middle of the bin.
1 s binning
From T0-310 s to T0+310 s

From T100_start - 20 s to T100_end + 30 s

Full time interval
64 ms binning
Full time interval

From T100_start to T100_end

From T0-5 sec to T0+5 sec

16 ms binning
From T100_start-5 s to T100_start+5 s

Blue+Cyan dotted lines: Time interval of the scaled map
From 0.000000 to 1.024000
8 ms binning
From T100_start-3 s to T100_start+3 s

Blue+Cyan dotted lines: Time interval of the scaled map
From 0.000000 to 1.024000
2 ms binning
From T100_start-1 s to T100_start+1 s
Blue+Cyan dotted lines: Time interval of the scaled map
From 0.000000 to 1.024000
SN=5 or 10 sec. binning (whichever binning is satisfied first)
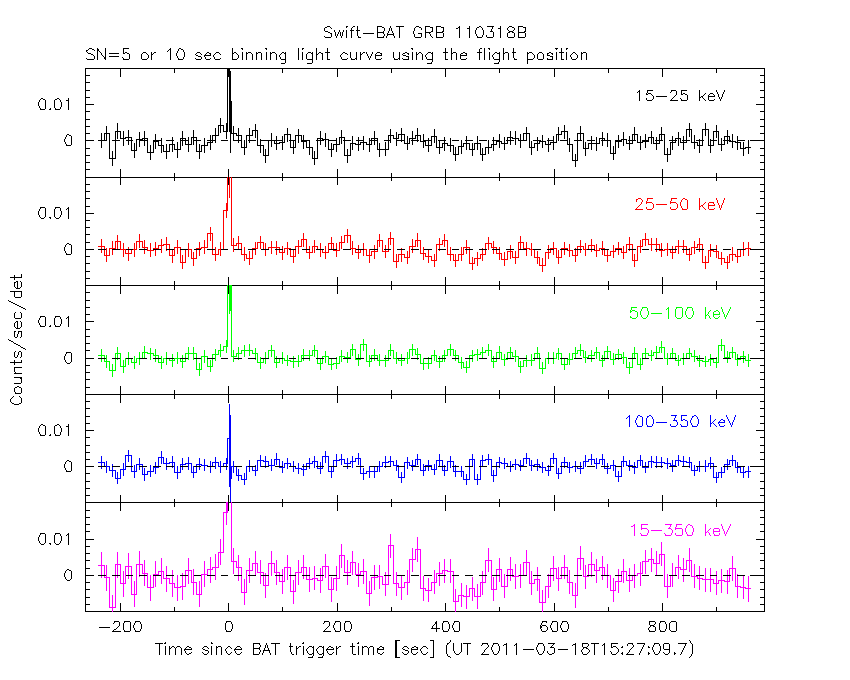
SN=5 or 10 sec. binning (T < 200 sec)

Quad-rate summed light curves (from T0-300s to T0+1000s)

The mask-weighted light curves based on cleaned DPHs

Spectral Evolution

Spectra
Notes:
- 1) The fitting includes the systematic errors.
- 2) When the burst includes telescope slew time periods, the fitting uses an average response file made from multiple 5-s response files through out the slew time plus single time preiod for the non-slew times, and weighted by the total counts in the corresponding time period using addrmf. An average response file is needed becuase a spectral fit using the pre-slew DRM will introduce some errors in both a spectral shape and a normalization if the PHA file contains a lot of the slew/post-slew time interval.
- 3) For fits to more complicated models (e.g. a power-law over a cutoff power-law), the BAT team has decided to require a chi-square improvement of more than 6 for each extra dof.
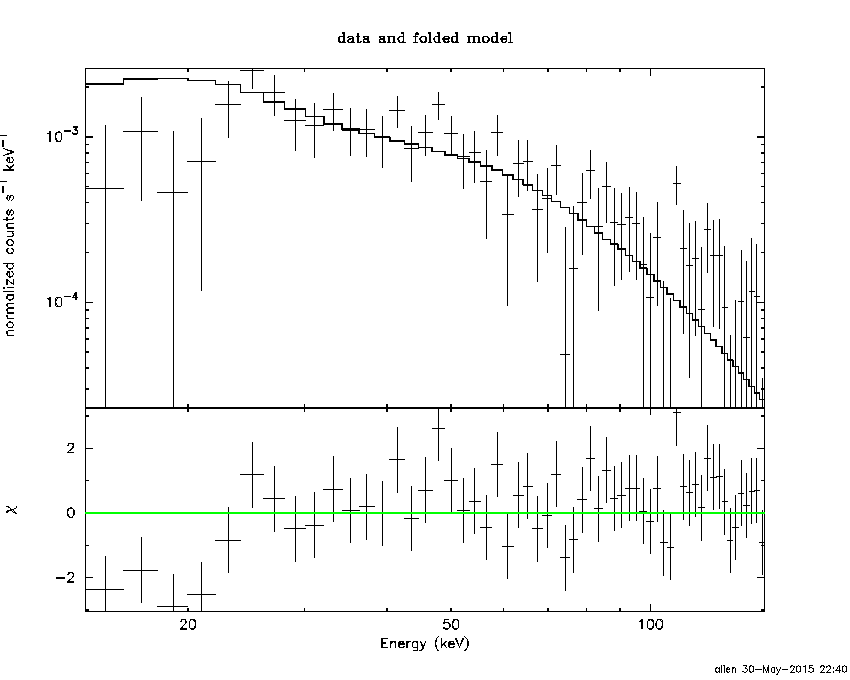
Time averaged spectrum fit using the average DRM
Power-law model
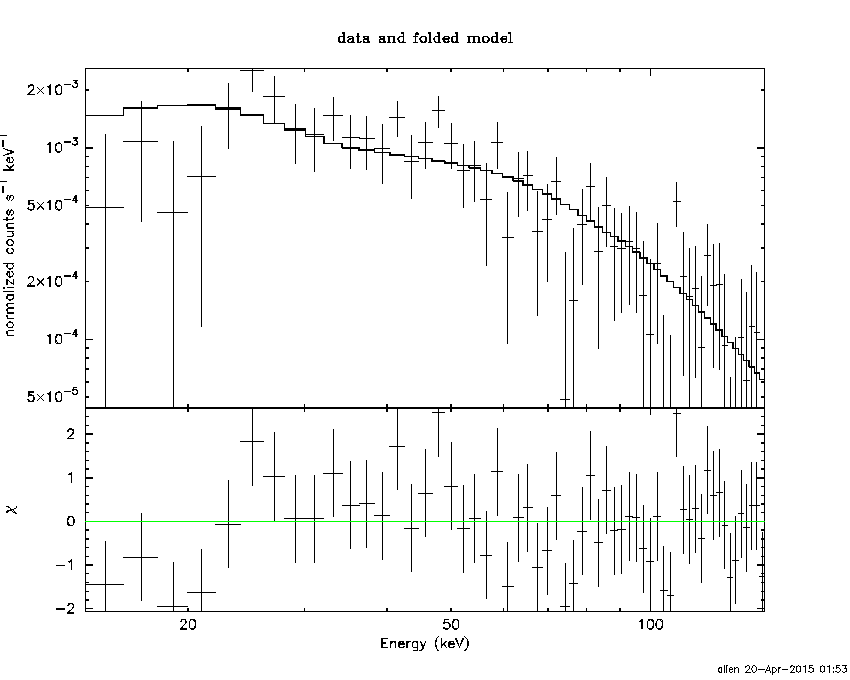
Time interval is from   -1.692 sec. to    3.688 sec.

Spectral model in power-law:
------------------------------------------------------------
Parameters  : value       lower 90%   higher 90%
Photon index: 1.09207     ( -0.173881   0.168714 )
Norm@50keV  : 5.09002E-03    ( -0.000506376   0.000505784 )
------------------------------------------------------------
#Fit statistic : Chi-Squared =          59.13 using 59 PHA bins.
# Reduced chi-squared =          1.037 for     57 degrees of freedom
# Null hypothesis probability =   3.975736e-01

Photon flux (15-150 keV)    in 5.38 sec: 0.589970 ( -0.0603451  0.0605417 ) ph/cm2/s
Energy fluence (15-150 keV)             : 2.87038e-07 ( -3.08396e-08  3.10911e-08 ) ergs/cm2
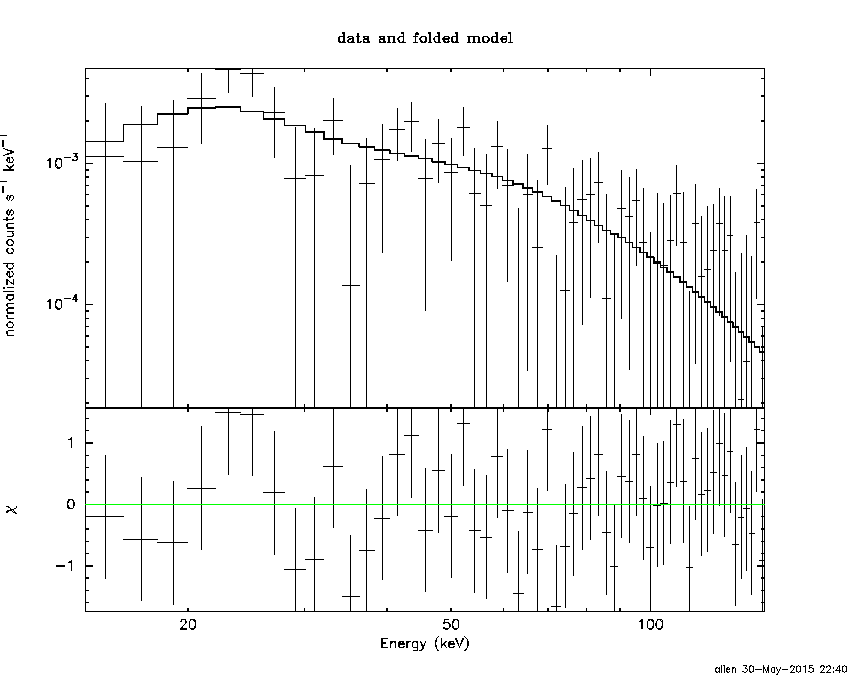
Cutoff power-law model

Time interval is from   -1.692 sec. to    3.688 sec.
Spectral model in the cutoff power-law:
------------------------------------------------------------
Parameters  : value       lower 90%   higher 90%
Photon index: 0.169232     ( -0.937812   0.750812 )
Epeak [keV] : 103.234      ( -29.5273 202.016 )
Norm@50keV  : 1.42319E-02    ( -0.00795332   0.025701 )
------------------------------------------------------------
#Fit statistic : Chi-Squared =          54.56 using 59 PHA bins.
# Reduced chi-squared =         0.9743 for     56 degrees of freedom
# Null hypothesis probability =   5.294489e-01

Photon flux (15-150 keV)    in 5.38 sec: 0.565112 ( -0.063815  0.063801 ) ph/cm2/s
Energy fluence (15-150 keV)             : 2.65543e-07 ( -3.69724e-08  3.63403e-08 ) ergs/cm2
Band function

Time interval is from   -1.692 sec. to    3.688 sec.

Spectral model in the Band function:
------------------------------------------------------------
Parameters  : value       lower 90%   higher 90%
alpha       : 5.00000   ( -4.32493   -5 )
beta        : -1.47962    ( -0.379557   0.259027 )
Epeak [keV] : 38.8427      ( -6.90376 6.2537 )
Norm@50keV   : 32.0979    ( -3.10402   66.6356 )
------------------------------------------------------------
#Fit statistic : Chi-Squared =          47.24 using 59 PHA bins.
# Reduced chi-squared =         0.8589 for     55 degrees of freedom
# Null hypothesis probability =   7.622612e-01

Photon flux (15-150 keV)    in 5.38 sec:  (    ) ph/cm2/s
Energy fluence (15-150 keV)             : 0 ( 0  0 ) ergs/cm2
Single BB

Spectral model blackbody:
------------------------------------------------------------
Parameters  : value    Lower 90%  Upper 90%
kT [keV]    : 18.0337  (-2.19696  2.67572)
R^2/D10^2   : 3.90613E-02  (-0.0143722   0.0213639)
(R is the radius in km and D10 is the distance to the source in units of 10 kpc)
------------------------------------------------------------
#Fit statistic : Chi-Squared =          62.15 using 59 PHA bins.
# Reduced chi-squared =          1.090 for     57 degrees of freedom
# Null hypothesis probability =   2.977636e-01

Energy  Fluence     90% Error
[keV]   [erg/cm2]   [erg/cm2]
15- 25  1.368e-08   2.916e-09
25- 50  6.333e-08   8.826e-09
50-150  1.496e-07   2.771e-08
15-150  2.266e-07   2.843e-08
Thermal bremsstrahlung (OTTB)
Spectral model: thermal bremsstrahlung
------------------------------------------------------------
Parameters  : value         Lower 90%    Upper 90%
kT [keV]    : 200.000       (      )
Norm        : 2.45042       (-0.249678     0.249652)
------------------------------------------------------------
#Fit statistic : Chi-Squared =          75.72 using 59 PHA bins.
# Reduced chi-squared =          1.328 for     57 degrees of freedom
# Null hypothesis probability =   4.920380e-02

Energy  Fluence     90% Error
[keV]   [erg/cm2]   [erg/cm2]
15- 25  3.284e-08   1.814e-08
25- 50  6.317e-08   3.419e-08
50-150  1.385e-07   7.551e-08
15-150  2.345e-07   1.275e-07
Double BB

Spectral model: bbodyrad<1> + bbodyrad<2>
------------------------------------------------------------
Parameters  : value         Lower 90%    Upper 90%
kT1 [keV]   : 12.1665        (-2.91213      3.04799)
R1^2/D10^2  : 0.105394        (-0.0452261      0.0859465)
kT2 [keV]   : 56.9981        (-49.9019      -81.5226)
R2^2/D10^2  : 7.52331E-04    (-0.000274989   0.00407668)
------------------------------------------------------------
#Fit statistic : Chi-Squared =          48.24 using 59 PHA bins.
# Reduced chi-squared =         0.8772 for     55 degrees of freedom
# Null hypothesis probability =   7.284865e-01

Energy  Fluence     90% Error
[keV]   [erg/cm2]   [erg/cm2]
15- 25  1.906e-08   9.282e-09
25- 50  6.645e-08   3.376e-08
50-150  1.834e-07   9.753e-08
15-150  2.689e-07   1.321e-07
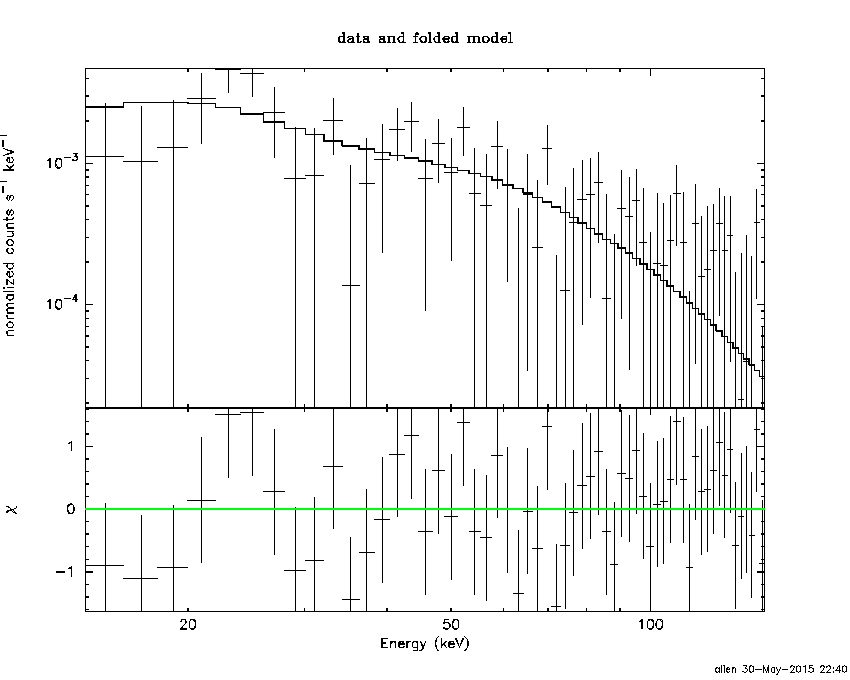
Peak spectrum fit
Power-law model

Time interval is from    0.756 sec. to    1.756 sec.

Spectral model in power-law:
------------------------------------------------------------
Parameters  : value       lower 90%   higher 90%
Photon index: 1.32248     ( -0.369411   0.358539 )
Norm@50keV  : 5.98371E-03    ( -0.00119287   0.00118809 )
------------------------------------------------------------
#Fit statistic : Chi-Squared =          37.36 using 59 PHA bins.
# Reduced chi-squared =         0.6554 for     57 degrees of freedom
# Null hypothesis probability =   9.794809e-01

Photon flux (15-150 keV)    in 1 sec: 0.716911 ( -0.144283  0.144892 ) ph/cm2/s
Energy fluence (15-150 keV)             : 5.88123e-08 ( -1.30923e-08  1.34341e-08 ) ergs/cm2
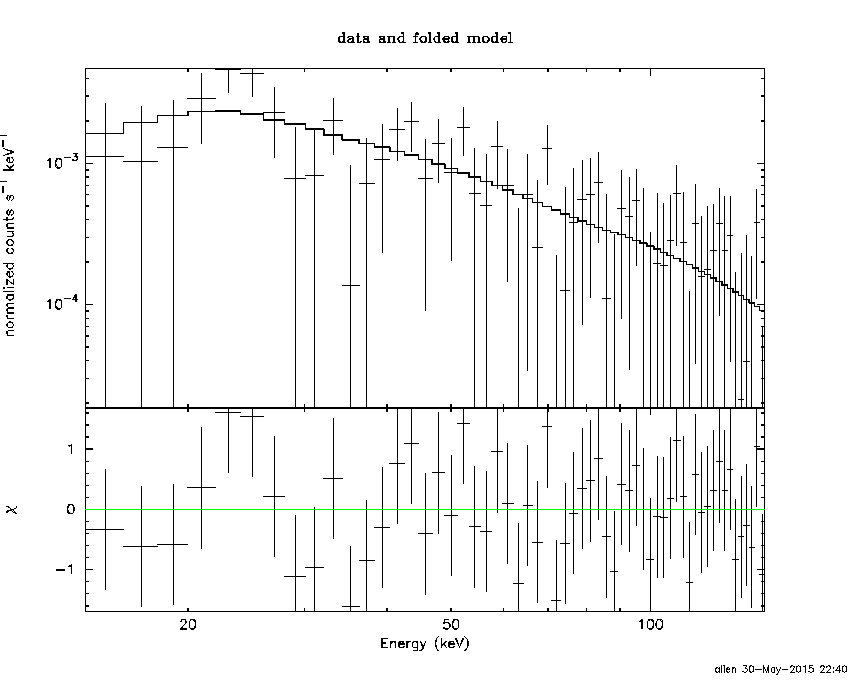
Cutoff power-law model

Time interval is from    0.756 sec. to    1.756 sec.
Spectral model in the cutoff power-law:
------------------------------------------------------------
Parameters  : value       lower 90%   higher 90%
Photon index: 1.32050     ( -1.20068   0.359667 )
Epeak [keV] : 9999.34      ( -9999.36 -9999.36 )
Norm@50keV  : 6.00549E-03    ( -0.00119841   0.0334375 )
------------------------------------------------------------
#Fit statistic : Chi-Squared =          37.36 using 59 PHA bins.
# Reduced chi-squared =         0.6671 for     56 degrees of freedom
# Null hypothesis probability =   9.739346e-01

Photon flux (15-150 keV)    in 1 sec: 0.716797 ( -0.14424  0.144583 ) ph/cm2/s
Energy fluence (15-150 keV)             : 5.8787e-08 ( -1.56752e-08  1.33281e-08 ) ergs/cm2
Band function
Time interval is from    0.756 sec. to    1.756 sec.

Spectral model in the Band function:
------------------------------------------------------------
Parameters  : value       lower 90%   higher 90%
alpha       : 4.98883   ( -4.98883   -4.98883 )
beta        : -1.51699    ( -0.527305   0.441689 )
Epeak [keV] : 28.2367      ( -28.2367 8.4852 )
Norm@50keV   : 273.040    ( -53.141   2.40735e+06 )
------------------------------------------------------------
#Fit statistic : Chi-Squared =          35.61 using 59 PHA bins.
# Reduced chi-squared =         0.6475 for     55 degrees of freedom
# Null hypothesis probability =   9.802763e-01

Photon flux (15-150 keV)    in 1 sec:  (    ) ph/cm2/s
Energy fluence (15-150 keV)             : 0 ( 0  0 ) ergs/cm2
Single BB

Spectral model blackbody:
------------------------------------------------------------
Parameters  : value    Lower 90%  Upper 90%
kT [keV]    : 14.5969  (-3.51186  5.6636)
R^2/D10^2   : 8.91333E-02  (-0.0598037   0.145705)
(R is the radius in km and D10 is the distance to the source in units of 10 kpc)
------------------------------------------------------------
#Fit statistic : Chi-Squared =          43.48 using 59 PHA bins.
# Reduced chi-squared =         0.7629 for     57 degrees of freedom
# Null hypothesis probability =   9.063785e-01

Energy  Fluence     90% Error
[keV]   [erg/cm2]   [erg/cm2]
15- 25  3.992e-09   1.738e-09
25- 50  1.546e-08   5.495e-09
50-150  2.215e-08   9.683e-09
15-150  4.160e-08   1.698e-08
Thermal bremsstrahlung (OTTB)
Spectral model: thermal bremsstrahlung
------------------------------------------------------------
Parameters  : value         Lower 90%    Upper 90%
kT [keV]    : 199.363       (-92.0074      -199.363)
Norm        : 2.95425       (-0.586723     0.586741)
------------------------------------------------------------
#Fit statistic : Chi-Squared =          38.41 using 59 PHA bins.
# Reduced chi-squared =         0.6739 for     57 degrees of freedom
# Null hypothesis probability =   9.721074e-01

Energy  Fluence     90% Error
[keV]   [erg/cm2]   [erg/cm2]
15- 25  7.356e-09   4.252e-09
25- 50  1.415e-08   8.100e-09
50-150  3.104e-08   1.783e-08
15-150  5.254e-08   2.995e-08
Double BB
Spectral model: bbodyrad<1> + bbodyrad<2>
------------------------------------------------------------
Parameters  : value         Lower 90%    Upper 90%
kT1 [keV]   : 9.16464        (-3.77489      4.14098)
R1^2/D10^2  : 0.346835        (-0.189558      1.18945)
kT2 [keV]   : 57.3189        (-53.0744      -75.7732)
R2^2/D10^2  : 9.90753E-04    (-0.000458239   0.0153415)
------------------------------------------------------------
#Fit statistic : Chi-Squared =          35.65 using 59 PHA bins.
# Reduced chi-squared =         0.6481 for     55 degrees of freedom
# Null hypothesis probability =   9.800759e-01

Energy  Fluence     90% Error
[keV]   [erg/cm2]   [erg/cm2]
15- 25  6.042e-09   3.621e-09
25- 50  1.488e-08   8.725e-09
50-150  3.786e-08   2.168e-08
15-150  5.878e-08   3.087e-08
Pre-slew spectrum (Pre-slew PHA with pre-slew DRM)
Power-law model

Spectral model in power-law:
------------------------------------------------------------
Parameters  : value       lower 90%   higher 90%
Photon index: 1.09207     ( -0.173881   0.168714 )
Norm@50keV  : 5.09002E-03    ( -0.000506376   0.000505784 )
------------------------------------------------------------
#Fit statistic : Chi-Squared =          59.13 using 59 PHA bins.
# Reduced chi-squared =          1.037 for     57 degrees of freedom
# Null hypothesis probability =   3.975736e-01

Photon flux (15-150 keV)    in 5.38 sec: 0.589970 ( -0.0603451  0.0605417 ) ph/cm2/s
Energy fluence (15-150 keV)             : 2.87038e-07 ( -3.08396e-08  3.10911e-08 ) ergs/cm2
Cutoff power-law model

Spectral model in the cutoff power-law:
------------------------------------------------------------
Parameters  : value       lower 90%   higher 90%
Photon index: 0.169232     ( -0.937812   0.750812 )
Epeak [keV] : 103.234      ( -29.5273 202.016 )
Norm@50keV  : 1.42319E-02    ( -0.00795332   0.025701 )
------------------------------------------------------------
#Fit statistic : Chi-Squared =          54.56 using 59 PHA bins.
# Reduced chi-squared =         0.9743 for     56 degrees of freedom
# Null hypothesis probability =   5.294489e-01

Photon flux (15-150 keV)    in 5.38 sec: 0.565112 ( -0.063815  0.063801 ) ph/cm2/s
Energy fluence (15-150 keV)             : 2.65543e-07 ( -3.69724e-08  3.63403e-08 ) ergs/cm2
Band function

Spectral model in the Band function:
------------------------------------------------------------
Parameters  : value       lower 90%   higher 90%
alpha       : 5.00000   ( -4.32493   -5 )
beta        : -1.47962    ( -0.379557   0.259027 )
Epeak [keV] : 38.8427      ( -6.90376 6.2537 )
Norm@50keV   : 32.0979    ( -3.10402   66.6356 )
------------------------------------------------------------
#Fit statistic : Chi-Squared =          47.24 using 59 PHA bins.
# Reduced chi-squared =         0.8589 for     55 degrees of freedom
# Null hypothesis probability =   7.622612e-01

Photon flux (15-150 keV)    in 5.38 sec:  (    ) ph/cm2/s
Energy fluence (15-150 keV)             : 0 ( 0  0 ) ergs/cm2
S(25-50 keV) vs. S(50-100 keV) plot

S(25-50 keV)  = 5.64e-08
S(50-100 keV) = 1.06e-07
T90 vs. Hardness ratio plot

T90                                   = 4.78799992799759 sec.
Hardness ratio (energy fluence ratio) = 1.87943
Color vs. Color plot
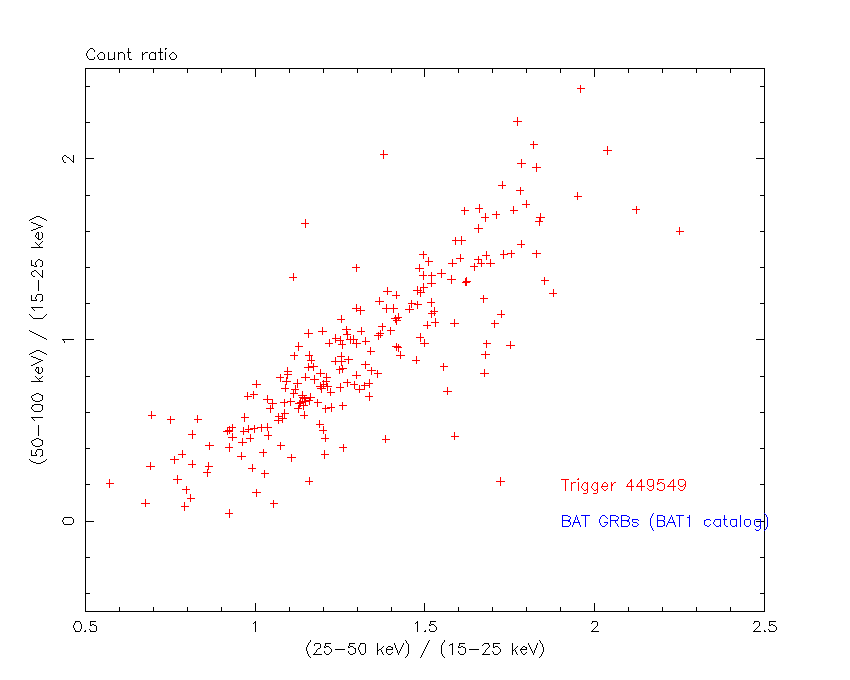
Count Ratio  (25-50 keV) / (15-25 keV) = 3.11091
Count Ratio (50-100 keV) / (15-25 keV) = 2.19051
Mask shadow pattern

IMX = 1.547348947023835E-01, IMY = 2.809354982755758E-01
TIME vs. PHA plot around the trigger time

Blue+Cyan dotted lines: Time interval of the scaled map
From 0.000000 to 1.024000
TIME vs. DetID plot around the trigger time

Blue+Cyan dotted lines: Time interval of the scaled map
From 0.000000 to 1.024000
100 us light curve (15-350 keV)

Blue+Cyan dotted lines: Time interval of the scaled map
From 0.000000 to 1.024000
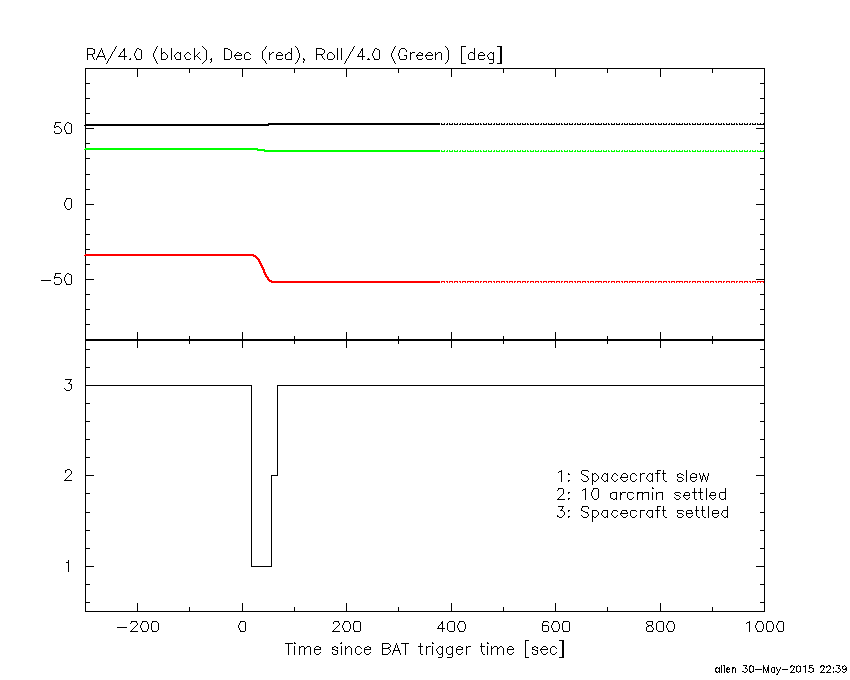
Spacecraft aspect plot
Bright source in the pre-burst/pre-slew/post-slew images
Pre-burst image of 15-350 keV band
Time interval of the image:
-239.480000 -1.692000

# RAcent  DECcent POSerr Theta    Phi  PeakCts   SNR AngSep     Name
#  [deg]    [deg]    ['] [deg]  [deg]                   [']
170.6460 -60.7103   87.5  36.4  -24.7   0.0383   0.1   11.0	Cen X-3
186.6543 -62.7112    1.9  32.0  -36.4   1.6970   6.1    3.5	GX 301-2
244.9803 -15.6458    0.2  37.2 -165.8  15.4886  52.5    0.3	Sco X-1
256.0500 -37.7215    6.9  38.0 -125.7  -0.7161  -1.7    7.9	4U 1700-377
256.4179 -36.2559   19.9  38.6 -128.0  -0.2555  -0.6   10.1	GX 349+2
263.0271 -24.7796   19.1  47.5 -141.5   0.3702   0.6    2.3	GX 1+4
262.9665 -33.7869    7.8  44.4 -129.7   0.8815   1.5    3.1	GX 354-0
155.3300 -19.5907    2.2  49.4   37.1   5.5787   5.2 ------	UNKNOWN
223.1947   0.5241    2.4  36.9  148.8   1.9643   4.9 ------	UNKNOWN
166.5673 -49.1982    2.9  34.6   -4.7   1.0386   4.0 ------	UNKNOWN
259.3687  -3.7535    2.8  55.7 -166.8   2.9592   4.1 ------	UNKNOWN
Pre-slew background subtracted image of 15-350 keV band
Time interval of the image:
-1.692000 3.688000

# RAcent  DECcent POSerr Theta    Phi  PeakCts   SNR AngSep     Name
#  [deg]    [deg]    ['] [deg]  [deg]                   [']
170.3047 -60.5969    4.1  36.4  -24.4  -0.0967  -2.8    1.6	Cen X-3
186.6118 -62.7618    5.4  32.1  -36.4   0.0679   2.1    1.3	GX 301-2
244.9755 -15.6059    2.6  37.2 -165.9  -0.1477  -4.5    2.1	Sco X-1
256.0357 -37.9884    6.1  38.0 -125.3  -0.0854  -1.9    9.0	4U 1700-377
256.5857 -36.3471   12.4  38.7 -127.8  -0.0414  -0.9    8.6	GX 349+2
262.9003 -24.7903   41.0  47.4 -141.5   0.0184   0.3    6.5	GX 1+4
262.9886 -33.6831    8.1  44.4 -129.9   0.0979   1.4    9.1	GX 354-0
229.8212  -6.5425    2.4  33.5  164.5   0.1655   4.8 ------	UNKNOWN
211.6926 -51.5670    0.8  17.8  -61.2   0.4219  15.1 ------	UNKNOWN
Post-slew image of 15-350 keV band
Time interval of the image:
56.820600 962.580900

# RAcent  DECcent POSerr Theta    Phi  PeakCts   SNR AngSep     Name
#  [deg]    [deg]    ['] [deg]  [deg]                   [']
135.5697 -40.5701    4.0  51.5   20.8   8.1917   2.9    2.1	Vela X-1
170.3873 -60.6615    5.7  24.3    2.2  -1.2027  -2.0    3.1	Cen X-3
186.6499 -62.7679    0.8  17.4   -9.4   7.6868  15.4    0.2	GX 301-2
244.9679 -15.6387    0.3  44.6  179.1  40.4429  39.2    0.7	Sco X-1
256.0515 -37.7722   43.9  33.8 -146.1  -0.1857  -0.3    5.3	4U 1700-377
256.3785 -36.4057    2.1  34.9 -147.6   4.1154   5.6    2.9	GX 349+2
263.0080 -24.7463    3.5  47.1 -154.3   4.4283   3.3    0.1	GX 1+4
264.5621 -44.2777    7.5  35.4 -130.2   1.4029   1.5   12.9	4U 1735-44
270.2854 -25.0798   10.9  51.3 -147.5  -1.7400  -1.1    0.1	GX 5-1
270.2970 -25.7430   31.1  50.8 -146.9   0.6045   0.4    0.3	GRS 1758-258
275.7537 -30.2089   24.8  51.0 -138.4   1.5262   0.5   13.0	H1820-303
262.9907 -33.8494    4.6  40.6 -145.0   2.4134   2.5    0.9	GX 354-0
229.0094 -38.1079    2.6  18.1  179.2   2.1713   4.4 ------	UNKNOWN
251.3843 -45.5059    2.5  26.6 -137.0   2.7975   4.5 ------	UNKNOWN
 97.8550 -64.5498    3.0  53.2  -20.3   6.1049   3.8 ------	UNKNOWN
 83.8053 -62.2678    3.8  59.0  -24.3  14.9796   3.0 ------	UNKNOWN
294.8699 -68.3172    2.6  41.0  -83.7  11.6593   4.4 ------	UNKNOWN
Plot creation:
Sat May 30 22:41:40 EDT 2015