Click here for the BAT GCN circular template
Image
Pre-slew 15.0-350.0 keV image (Event data)
#   RAcent    DECcent   POSerr    Theta     Phi              Peak Cts       SNR   Name
  356.5075   -66.0083   0.0046     9.1476  -122.2227         1.6000691     42.036 TRIG_00449578

Foreground time interval of the image:
 -0.252  10.917 (delta_t =  11.169 [sec])
Background time interval of the image:
-236.683  -0.252 (delta_t = 236.431 [sec])
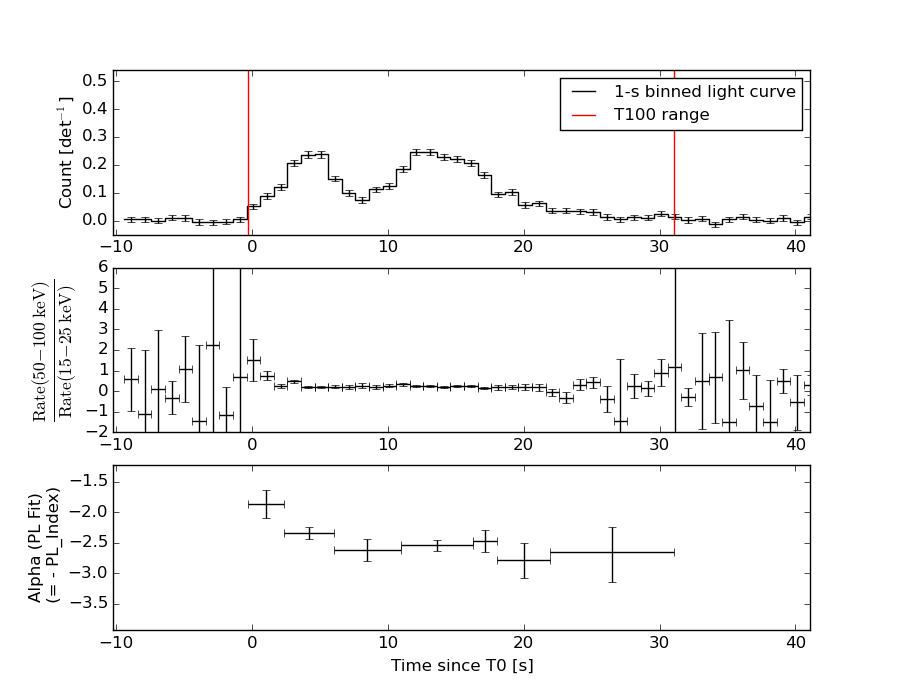
Lightcurves
Notes:
- 1) The mask-weighted light curves are using the flight position.
- 2) Multiple plots of different time binning/intervals are shown to cover all scenarios of short/long GRBs, rate/image triggers, and real/false positives.
- 3) For all the mask-weighted lightcurves, the y-axis units are counts/sec/det where a det is 0.4 x 0.4 = 0.16 sq cm.
- 4) The verticle lines correspond to following: green dotted lines are T50 interval, black dotted lines are T90 interval, blue solid line(s) is a spacecraft slew start time, and orange solid line(s) is a spacecraft slew end time.
- 5) Time of each bin is in the middle of the bin.
1 s binning
From T0-310 s to T0+310 s
From T100_start - 20 s to T100_end + 30 s
Full time interval
64 ms binning
Full time interval
From T100_start to T100_end
From T0-5 sec to T0+5 sec

16 ms binning
From T100_start-5 s to T100_start+5 s
8 ms binning
From T100_start-3 s to T100_start+3 s
2 ms binning
From T100_start-1 s to T100_start+1 s
SN=5 or 10 sec. binning (whichever binning is satisfied first)
SN=5 or 10 sec. binning (T < 200 sec)
Quad-rate summed light curves (from T0-300s to T0+1000s)

The mask-weighted light curves based on cleaned DPHs

Spectral Evolution
Spectra
Notes:
- 1) The fitting includes the systematic errors.
- 2) When the burst includes telescope slew time periods, the fitting uses an average response file made from multiple 5-s response files through out the slew time plus single time preiod for the non-slew times, and weighted by the total counts in the corresponding time period using addrmf. An average response file is needed becuase a spectral fit using the pre-slew DRM will introduce some errors in both a spectral shape and a normalization if the PHA file contains a lot of the slew/post-slew time interval.
- 3) For fits to more complicated models (e.g. a power-law over a cutoff power-law), the BAT team has decided to require a chi-square improvement of more than 6 for each extra dof.
Time averaged spectrum fit using the average DRM
Power-law model

Time interval is from   -0.252 sec. to   31.072 sec.

Spectral model in power-law:
------------------------------------------------------------
Parameters  : value       lower 90%   higher 90%
Photon index: 2.55061     ( -0.0772689   0.0787472 )
Norm@50keV  : 5.04302E-03    ( -0.000235621   0.000234254 )
------------------------------------------------------------
#Fit statistic : Chi-Squared =          84.01 using 59 PHA bins.
# Reduced chi-squared =          1.474 for     57 degrees of freedom
# Null hypothesis probability =   1.147416e-02

Photon flux (15-150 keV)    in 31.32 sec: 1.02221 ( -0.0388356  0.0390675 ) ph/cm2/s
Energy fluence (15-150 keV)             : 1.60188e-06 ( -5.6453e-08  5.66381e-08 ) ergs/cm2
Cutoff power-law model
Time interval is from   -0.252 sec. to   31.072 sec.
Spectral model in the cutoff power-law:
------------------------------------------------------------
Parameters  : value       lower 90%   higher 90%
Photon index: 1.37547     ( -0.448076   0.406548 )
Epeak [keV] : 21.0354      ( -9.98038 5.44967 )
Norm@50keV  : 2.40311E-02    ( -0.00997441   0.0197387 )
------------------------------------------------------------
#Fit statistic : Chi-Squared =          54.84 using 59 PHA bins.
# Reduced chi-squared =         0.9793 for     56 degrees of freedom
# Null hypothesis probability =   5.188601e-01

Photon flux (15-150 keV)    in 31.32 sec: 0.939890 ( -0.045739  0.046128 ) ph/cm2/s
Energy fluence (15-150 keV)             : 1.43235e-06 ( -7.08083e-08  7.32543e-08 ) ergs/cm2
Band function

Time interval is from   -0.252 sec. to   31.072 sec.

Spectral model in the Band function:
------------------------------------------------------------
Parameters  : value       lower 90%   higher 90%
alpha       : -1.37555   ( -0.33735   0.103977 )
beta        : -10.00000    ( 10   20 )
Epeak [keV] : 21.0296      ( -1.69123 5.45274 )
Norm@50keV   : 2.40255E-02    ( -0.00996863   0.00733636 )
------------------------------------------------------------
#Fit statistic : Chi-Squared =          54.84 using 59 PHA bins.
# Reduced chi-squared =         0.9971 for     55 degrees of freedom
# Null hypothesis probability =   4.807691e-01

Photon flux (15-150 keV)    in 31.32 sec:  (    ) ph/cm2/s
Energy fluence (15-150 keV)             : 1.4381e-06 ( 0  0 ) ergs/cm2
Single BB
Spectral model blackbody:
------------------------------------------------------------
Parameters  : value    Lower 90%  Upper 90%
kT [keV]    : 8.42426  (  )
R^2/D10^2   : 0.799444  (   )
(R is the radius in km and D10 is the distance to the source in units of 10 kpc)
------------------------------------------------------------
#Fit statistic : Chi-Squared =         132.48 using 59 PHA bins.
# Reduced chi-squared =         2.3242 for     57 degrees of freedom
# Null hypothesis probability =   6.030483e-08

Energy  Fluence     90% Error
[keV]   [erg/cm2]   [erg/cm2]
15- 25  3.330e-07   2.120e-08
25- 50  6.363e-07   2.349e-08
50-150  1.975e-07   2.078e-08
15-150  1.167e-06   4.322e-08
Thermal bremsstrahlung (OTTB)
Spectral model: thermal bremsstrahlung
------------------------------------------------------------
Parameters  : value         Lower 90%    Upper 90%
kT [keV]    : 34.2303       (-2.70516      3.0347)
Norm        : 6.98923       (-0.563384     0.620672)
------------------------------------------------------------
#Fit statistic : Chi-Squared =          54.82 using 59 PHA bins.
# Reduced chi-squared =         0.9617 for     57 degrees of freedom
# Null hypothesis probability =   5.574632e-01

Energy  Fluence     90% Error
[keV]   [erg/cm2]   [erg/cm2]
15- 25  4.738e-07   2.443e-08
25- 50  5.800e-07   1.895e-08
50-150  3.751e-07   3.946e-08
15-150  1.429e-06   5.090e-08
Double BB
Spectral model: bbodyrad<1> + bbodyrad<2>
------------------------------------------------------------
Parameters  : value         Lower 90%    Upper 90%
kT1 [keV]   : 5.02473        (-0.823493      0.858736)
R1^2/D10^2  : 4.64149        (-2.02169      4.89339)
kT2 [keV]   : 12.8348        (-1.66008      2.54861)
R2^2/D10^2  : 9.07313E-02    (-0.0545018   0.0679013)
------------------------------------------------------------
#Fit statistic : Chi-Squared =          57.02 using 59 PHA bins.
# Reduced chi-squared =          1.037 for     55 degrees of freedom
# Null hypothesis probability =   3.998963e-01

Energy  Fluence     90% Error
[keV]   [erg/cm2]   [erg/cm2]
15- 25  4.599e-07   7.345e-08
25- 50  5.756e-07   7.705e-08
50-150  3.585e-07   8.566e-08
15-150  1.394e-06   2.288e-07
Peak spectrum fit
Power-law model
Time interval is from   13.104 sec. to   14.104 sec.

Spectral model in power-law:
------------------------------------------------------------
Parameters  : value       lower 90%   higher 90%
Photon index: 2.60093     ( -0.168388   0.178374 )
Norm@50keV  : 1.04540E-02    ( -0.00132476   0.00131844 )
------------------------------------------------------------
#Fit statistic : Chi-Squared =          55.90 using 59 PHA bins.
# Reduced chi-squared =         0.9806 for     57 degrees of freedom
# Null hypothesis probability =   5.165443e-01

Photon flux (15-150 keV)    in 1 sec: 2.18751 ( -0.169147  0.169242 ) ph/cm2/s
Energy fluence (15-150 keV)             : 1.07636e-07 ( -9.59317e-09  9.77864e-09 ) ergs/cm2
Cutoff power-law model
Time interval is from   13.104 sec. to   14.104 sec.
Spectral model in the cutoff power-law:
------------------------------------------------------------
Parameters  : value       lower 90%   higher 90%
Photon index: 1.64421     ( -1.13064   0.350123 )
Epeak [keV] : 12.7972      (   )
Norm@50keV  : 4.30613E-02    (     )
------------------------------------------------------------
#Fit statistic : Chi-Squared =          52.09 using 59 PHA bins.
# Reduced chi-squared =         0.9302 for     56 degrees of freedom
# Null hypothesis probability =   6.235243e-01

Photon flux (15-150 keV)    in 1 sec: 2.11497 ( -0.1788  0.1795 ) ph/cm2/s
Energy fluence (15-150 keV)             : 9.80336e-08 ( -1.08974e-08  1.23064e-08 ) ergs/cm2
Band function
Time interval is from   13.104 sec. to   14.104 sec.

Spectral model in the Band function:
------------------------------------------------------------
Parameters  : value       lower 90%   higher 90%
alpha       : 0.456790   ( -2.23924   0.414908 )
beta        : -3.00320    ( 3.00553   0.367959 )
Epeak [keV] : 22.2697      ( -6.72346 3.74176 )
Norm@50keV   : 1.56762    ( -1.56188   2225.18 )
------------------------------------------------------------
#Fit statistic : Chi-Squared =          49.55 using 59 PHA bins.
# Reduced chi-squared =         0.9010 for     55 degrees of freedom
# Null hypothesis probability =   6.820634e-01

Photon flux (15-150 keV)    in 1 sec:  (    ) ph/cm2/s
Energy fluence (15-150 keV)             : 0 ( 0  0 ) ergs/cm2
Single BB

Spectral model blackbody:
------------------------------------------------------------
Parameters  : value    Lower 90%  Upper 90%
kT [keV]    : 6.87669  (-0.553662  0.603981)
R^2/D10^2   : 4.32240  (-1.32626   1.92381)
(R is the radius in km and D10 is the distance to the source in units of 10 kpc)
------------------------------------------------------------
#Fit statistic : Chi-Squared =          67.70 using 59 PHA bins.
# Reduced chi-squared =          1.188 for     57 degrees of freedom
# Null hypothesis probability =   1.569342e-01

Energy  Fluence     90% Error
[keV]   [erg/cm2]   [erg/cm2]
15- 25  3.222e-08   4.330e-09
25- 50  4.263e-08   4.520e-09
50-150  6.621e-09   2.011e-09
15-150  8.147e-08   8.415e-09
Thermal bremsstrahlung (OTTB)
Spectral model: thermal bremsstrahlung
------------------------------------------------------------
Parameters  : value         Lower 90%    Upper 90%
kT [keV]    : 28.3603       (-4.68793      5.95666)
Norm        : 18.2090       (-3.10791     3.89565)
------------------------------------------------------------
#Fit statistic : Chi-Squared =          52.26 using 59 PHA bins.
# Reduced chi-squared =         0.9168 for     57 degrees of freedom
# Null hypothesis probability =   6.533410e-01

Energy  Fluence     90% Error
[keV]   [erg/cm2]   [erg/cm2]
15- 25  3.597e-08   3.470e-09
25- 50  3.981e-08   3.785e-09
50-150  2.023e-08   5.675e-09
15-150  9.601e-08   9.025e-09
Double BB
Spectral model: bbodyrad<1> + bbodyrad<2>
------------------------------------------------------------
Parameters  : value         Lower 90%    Upper 90%
kT1 [keV]   : 5.40688        (-1.07816      0.928689)
R1^2/D10^2  : 10.0761        (-4.53662      6.07621)
kT2 [keV]   : 16.7731        (-5.90659      14.9765)
R2^2/D10^2  : 4.86094E-02    (-0.0444064   0.325678)
------------------------------------------------------------
#Fit statistic : Chi-Squared =          49.96 using 59 PHA bins.
# Reduced chi-squared =         0.9083 for     55 degrees of freedom
# Null hypothesis probability =   6.671871e-01

Energy  Fluence     90% Error
[keV]   [erg/cm2]   [erg/cm2]
15- 25  3.597e-08   1.019e-08
25- 50  3.839e-08   1.045e-08
50-150  2.600e-08   1.429e-08
15-150  1.003e-07   2.845e-08
Pre-slew spectrum (Pre-slew PHA with pre-slew DRM)
Power-law model
Spectral model in power-law:
------------------------------------------------------------
Parameters  : value       lower 90%   higher 90%
Photon index: 2.39117     ( -0.093056   0.0955541 )
Norm@50keV  : 6.54476E-03    ( -0.000387378   0.000384248 )
------------------------------------------------------------
#Fit statistic : Chi-Squared =          82.13 using 59 PHA bins.
# Reduced chi-squared =          1.441 for     57 degrees of freedom
# Null hypothesis probability =   1.632635e-02

Photon flux (15-150 keV)    in 11.17 sec: 1.20472 ( -0.054919  0.0551041 ) ph/cm2/s
Energy fluence (15-150 keV)             : 7.117e-07 ( -3.34899e-08  3.37306e-08 ) ergs/cm2
Cutoff power-law model

Spectral model in the cutoff power-law:
------------------------------------------------------------
Parameters  : value       lower 90%   higher 90%
Photon index: 1.19960     ( -0.534245   0.478244 )
Epeak [keV] : 26.8827      ( -9.31628 4.92407 )
Norm@50keV  : 3.18839E-02    ( -0.0148945   0.0331947 )
------------------------------------------------------------
#Fit statistic : Chi-Squared =          60.95 using 59 PHA bins.
# Reduced chi-squared =          1.088 for     56 degrees of freedom
# Null hypothesis probability =   3.026120e-01

Photon flux (15-150 keV)    in 11.17 sec: 1.11901 ( -0.06232  0.06274 ) ph/cm2/s
Energy fluence (15-150 keV)             : 6.3657e-07 ( -3.9047e-08  4.09548e-08 ) ergs/cm2
Band function
Spectral model in the Band function:
------------------------------------------------------------
Parameters  : value       lower 90%   higher 90%
alpha       : -1.19946   ( -0.258099   0.230995 )
beta        : -10.00000    ( 10   20 )
Epeak [keV] : 26.8773      ( -2.57334 4.92336 )
Norm@50keV   : 3.18885E-02    ( -0.014903   0.0193925 )
------------------------------------------------------------
#Fit statistic : Chi-Squared =          60.95 using 59 PHA bins.
# Reduced chi-squared =          1.108 for     55 degrees of freedom
# Null hypothesis probability =   2.706637e-01

Photon flux (15-150 keV)    in 11.17 sec:  (    ) ph/cm2/s
Energy fluence (15-150 keV)             : 6.37352e-07 ( 0  0 ) ergs/cm2
S(25-50 keV) vs. S(50-100 keV) plot
S(25-50 keV)  = 5.34e-07
S(50-100 keV) = 3.64e-07
T90 vs. Hardness ratio plot
T90                                   = 20.6799999475479 sec.
Hardness ratio (energy fluence ratio) = 0.681648
Color vs. Color plot
Count Ratio  (25-50 keV) / (15-25 keV) = 0.845076
Count Ratio (50-100 keV) / (15-25 keV) = 0.2488
Mask shadow pattern
IMX = -8.586079636805807E-02, IMY = 1.362249670017142E-01
TIME vs. PHA plot around the trigger time
TIME vs. DetID plot around the trigger time

100 us light curve (15-350 keV)

Spacecraft aspect plot

Bright source in the pre-burst/pre-slew/post-slew images
Pre-burst image of 15-350 keV band
Time interval of the image:
-236.683400 -0.252000

# RAcent  DECcent POSerr Theta    Phi  PeakCts   SNR AngSep     Name
#  [deg]    [deg]    ['] [deg]  [deg]                   [']
264.6184 -44.4627   21.9  54.1  171.5   0.4187   0.5    5.4	4U 1735-44
222.7819 -58.8347    2.6  47.8  134.8   3.3466   4.4 ------	UNKNOWN
230.8314 -65.6043    2.8  40.4  137.8   1.8019   4.1 ------	UNKNOWN
 62.2034 -19.7997    2.3  58.5  -10.7   4.9102   5.1 ------	UNKNOWN
 56.3209 -20.4417    3.0  56.4  -16.9   2.5467   3.8 ------	UNKNOWN
 50.4025 -16.6144    2.7  58.9  -24.4   4.9335   4.2 ------	UNKNOWN
Pre-slew background subtracted image of 15-350 keV band
Time interval of the image:
-0.252000 10.916590

# RAcent  DECcent POSerr Theta    Phi  PeakCts   SNR AngSep     Name
#  [deg]    [deg]    ['] [deg]  [deg]                   [']
264.8815 -44.5216   10.2  54.0  171.7   0.1804   1.1    7.3	4U 1735-44
356.5075 -66.0084    0.3   9.1 -122.2   1.6001  42.1 ------	UNKNOWN
345.2151 -41.3026    2.0  34.2 -106.7   0.3931   5.9 ------	UNKNOWN
Post-slew image of 15-350 keV band
Time interval of the image:
43.916600 232.265900
233.616000 395.716600

# RAcent  DECcent POSerr Theta    Phi  PeakCts   SNR AngSep     Name
#  [deg]    [deg]    ['] [deg]  [deg]                   [']
264.7839 -44.3176    6.3  50.9  155.2   1.8199   1.8    8.1	4U 1735-44
Plot creation:
Sat May 30 22:39:27 EDT 2015