Special notes of this burst
Image
Pre-slew 15.0-350.0 keV image (Event data)
#   RAcent    DECcent   POSerr    Theta     Phi              Peak Cts       SNR   Name
  197.4297    61.2460   0.0136    48.0710    28.1108         5.0016921     14.093 TRIG_00450545

Foreground time interval of the image:
 -0.376  62.536 (delta_t =  62.912 [sec])
Background time interval of the image:
-239.000  -0.376 (delta_t = 238.624 [sec])
Lightcurves
Notes:
- 1) The mask-weighted light curves are using the flight position.
- 2) Multiple plots of different time binning/intervals are shown to cover all scenarios of short/long GRBs, rate/image triggers, and real/false positives.
- 3) For all the mask-weighted lightcurves, the y-axis units are counts/sec/det where a det is 0.4 x 0.4 = 0.16 sq cm.
- 4) The verticle lines correspond to following: green dotted lines are T50 interval, black dotted lines are T90 interval, blue solid line(s) is a spacecraft slew start time, and orange solid line(s) is a spacecraft slew end time.
- 5) Time of each bin is in the middle of the bin.
1 s binning
From T0-310 s to T0+310 s
From T100_start - 20 s to T100_end + 30 s
Full time interval

64 ms binning
Full time interval

From T100_start to T100_end

From T0-5 sec to T0+5 sec

16 ms binning
From T100_start-5 s to T100_start+5 s
8 ms binning
From T100_start-3 s to T100_start+3 s

2 ms binning
From T100_start-1 s to T100_start+1 s

SN=5 or 10 sec. binning (whichever binning is satisfied first)

SN=5 or 10 sec. binning (T < 200 sec)

Quad-rate summed light curves (from T0-300s to T0+1000s)
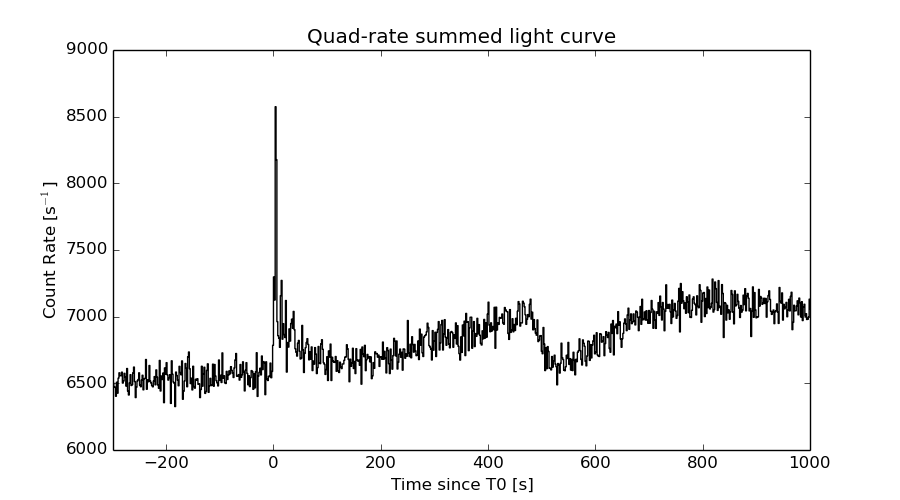
The mask-weighted light curves based on cleaned DPHs

Spectral Evolution

Spectra
Notes:
- 1) The fitting includes the systematic errors.
- 2) When the burst includes telescope slew time periods, the fitting uses an average response file made from multiple 5-s response files through out the slew time plus single time preiod for the non-slew times, and weighted by the total counts in the corresponding time period using addrmf. An average response file is needed becuase a spectral fit using the pre-slew DRM will introduce some errors in both a spectral shape and a normalization if the PHA file contains a lot of the slew/post-slew time interval.
- 3) For fits to more complicated models (e.g. a power-law over a cutoff power-law), the BAT team has decided to require a chi-square improvement of more than 6 for each extra dof.
Time averaged spectrum fit using the average DRM
Power-law model

Time interval is from   -0.376 sec. to   62.536 sec.

Spectral model in power-law:
------------------------------------------------------------
Parameters  : value       lower 90%   higher 90%
Photon index: 1.56299     ( -0.164766   0.166 )
Norm@50keV  : 5.48497E-03    ( -0.000530734   0.000529192 )
------------------------------------------------------------
#Fit statistic : Chi-Squared =          58.10 using 59 PHA bins.
# Reduced chi-squared =          1.019 for     57 degrees of freedom
# Null hypothesis probability =   4.344281e-01

Photon flux (15-150 keV)    in 62.91 sec: 0.697004 ( -0.0697861  0.0699997 ) ph/cm2/s
Energy fluence (15-150 keV)             : 3.24253e-06 ( -3.3292e-07  3.34562e-07 ) ergs/cm2
Cutoff power-law model

Time interval is from   -0.376 sec. to   62.536 sec.
Spectral model in the cutoff power-law:
------------------------------------------------------------
Parameters  : value       lower 90%   higher 90%
Photon index: 1.28863     ( -0.76004   0.41662 )
Epeak [keV] : 132.674      ( -64.7023 -132.696 )
Norm@50keV  : 7.51883E-03    ( -0.00751821   0.0101813 )
------------------------------------------------------------
#Fit statistic : Chi-Squared =          57.62 using 59 PHA bins.
# Reduced chi-squared =          1.029 for     56 degrees of freedom
# Null hypothesis probability =   4.151509e-01

Photon flux (15-150 keV)    in 62.91 sec: 0.688810 ( -0.07259  0.072605 ) ph/cm2/s
Energy fluence (15-150 keV)             : 3.19095e-06 ( -3.63972e-07  3.58178e-07 ) ergs/cm2
Band function

Time interval is from   -0.376 sec. to   62.536 sec.

Spectral model in the Band function:
------------------------------------------------------------
Parameters  : value       lower 90%   higher 90%
alpha       : -0.752930   ( 0.777182   0.777182 )
beta        : -1.77536    ( 1.79332   0.345162 )
Epeak [keV] : 65.1770      ( -64.9881 343.698 )
Norm@50keV   : 1.54288E-02    ( -0.0157112   2148.8 )
------------------------------------------------------------
#Fit statistic : Chi-Squared =          56.70 using 59 PHA bins.
# Reduced chi-squared =          1.031 for     55 degrees of freedom
# Null hypothesis probability =   4.115825e-01

Photon flux (15-150 keV)    in 62.91 sec:  (    ) ph/cm2/s
Energy fluence (15-150 keV)             : 3.16585e-06 ( 0  0 ) ergs/cm2
Single BB

Spectral model blackbody:
------------------------------------------------------------
Parameters  : value    Lower 90%  Upper 90%
kT [keV]    : 14.5691  (-1.63235  1.89397)
R^2/D10^2   : 8.67100E-02  (-0.0310688   0.0466405)
(R is the radius in km and D10 is the distance to the source in units of 10 kpc)
------------------------------------------------------------
#Fit statistic : Chi-Squared =          80.21 using 59 PHA bins.
# Reduced chi-squared =          1.407 for     57 degrees of freedom
# Null hypothesis probability =   2.307980e-02

Energy  Fluence     90% Error
[keV]   [erg/cm2]   [erg/cm2]
15- 25  2.435e-07   4.514e-08
25- 50  9.413e-07   1.205e-07
50-150  1.342e-06   2.482e-07
15-150  2.527e-06   3.215e-07
Thermal bremsstrahlung (OTTB)

Spectral model: thermal bremsstrahlung
------------------------------------------------------------
Parameters  : value         Lower 90%    Upper 90%
kT [keV]    : 198.599       (-72.9734      -198.69)
Norm        : 2.83888       (-0.269224     0.311829)
------------------------------------------------------------
#Fit statistic : Chi-Squared =          57.58 using 59 PHA bins.
# Reduced chi-squared =          1.010 for     57 degrees of freedom
# Null hypothesis probability =   4.535138e-01

Energy  Fluence     90% Error
[keV]   [erg/cm2]   [erg/cm2]
15- 25  4.449e-07   6.266e-08
25- 50  8.555e-07   3.719e-07
50-150  1.874e-06   9.997e-07
15-150  3.174e-06   1.395e-06
Double BB

Spectral model: bbodyrad<1> + bbodyrad<2>
------------------------------------------------------------
Parameters  : value         Lower 90%    Upper 90%
kT1 [keV]   : 9.86245        (-2.67295      2.3124)
R1^2/D10^2  : 0.272001        (-0.130907      0.396949)
kT2 [keV]   : 45.9832        (-23.5784      -48.1193)
R2^2/D10^2  : 1.17375E-03    (-0.000999364   0.00886961)
------------------------------------------------------------
#Fit statistic : Chi-Squared =          57.56 using 59 PHA bins.
# Reduced chi-squared =          1.047 for     55 degrees of freedom
# Null hypothesis probability =   3.805379e-01

Energy  Fluence     90% Error
[keV]   [erg/cm2]   [erg/cm2]
15- 25  3.555e-07   1.179e-07
25- 50  9.511e-07   3.385e-07
50-150  1.857e-06   9.066e-07
15-150  3.163e-06   1.153e-06
Peak spectrum fit
Power-law model

Time interval is from    3.180 sec. to    4.180 sec.

Spectral model in power-law:
------------------------------------------------------------
Parameters  : value       lower 90%   higher 90%
Photon index: 0.954182     ( -0.278913   0.261641 )
Norm@50keV  : 3.58569E-02    ( -0.00574348   0.00561678 )
------------------------------------------------------------
#Fit statistic : Chi-Squared =          43.78 using 59 PHA bins.
# Reduced chi-squared =         0.7680 for     57 degrees of freedom
# Null hypothesis probability =   9.007880e-01

Photon flux (15-150 keV)    in 1 sec: 4.12033 ( -0.662349  0.666767 ) ph/cm2/s
Energy fluence (15-150 keV)             : 3.94216e-07 ( -6.00262e-08  6.01778e-08 ) ergs/cm2
Cutoff power-law model

Time interval is from    3.180 sec. to    4.180 sec.
Spectral model in the cutoff power-law:
------------------------------------------------------------
Parameters  : value       lower 90%   higher 90%
Photon index: 0.953996     ( -0.285713   0.259573 )
Epeak [keV] : 9999.36      ( -9999.36 -9999.36 )
Norm@50keV  : 3.61194E-02    ( -0.00538139   0.0522943 )
------------------------------------------------------------
#Fit statistic : Chi-Squared =          43.78 using 59 PHA bins.
# Reduced chi-squared =         0.7818 for     56 degrees of freedom
# Null hypothesis probability =   8.823902e-01

Photon flux (15-150 keV)    in 1 sec: 4.12492 ( -0.66795  0.65826 ) ph/cm2/s
Energy fluence (15-150 keV)             : 3.94195e-07 ( -5.9873e-08  6.0324e-08 ) ergs/cm2
Band function

Time interval is from    3.180 sec. to    4.180 sec.

Spectral model in the Band function:
------------------------------------------------------------
Parameters  : value       lower 90%   higher 90%
alpha       : -0.782151   ( 0.782151   5.75213 )
beta        : -0.954186    ( 0.954186   0.278912 )
Epeak [keV] : 53.4175      ( -53.4175 -53.4175 )
Norm@50keV   : 5.89621E-02    ( -0.0256862   0 )
------------------------------------------------------------
#Fit statistic : Chi-Squared =          43.78 using 59 PHA bins.
# Reduced chi-squared =         0.7959 for     55 degrees of freedom
# Null hypothesis probability =   8.617760e-01

Photon flux (15-150 keV)    in 1 sec:  (    ) ph/cm2/s
Energy fluence (15-150 keV)             : 0 ( 0  0 ) ergs/cm2
Single BB

Spectral model blackbody:
------------------------------------------------------------
Parameters  : value    Lower 90%  Upper 90%
kT [keV]    : 25.9131  (-5.24168  7.44865)
R^2/D10^2   : 8.91691E-02  (-0.0474597   0.0920084)
(R is the radius in km and D10 is the distance to the source in units of 10 kpc)
------------------------------------------------------------
#Fit statistic : Chi-Squared =          53.51 using 59 PHA bins.
# Reduced chi-squared =         0.9388 for     57 degrees of freedom
# Null hypothesis probability =   6.067154e-01

Energy  Fluence     90% Error
[keV]   [erg/cm2]   [erg/cm2]
15- 25  1.020e-08   3.315e-09
25- 50  5.893e-08   1.584e-08
50-150  2.917e-07   7.415e-08
15-150  3.608e-07   9.730e-08
Thermal bremsstrahlung (OTTB)

Spectral model: thermal bremsstrahlung
------------------------------------------------------------
Parameters  : value         Lower 90%    Upper 90%
kT [keV]    : 200.000       (      )
Norm        : 17.4943       (-2.743     2.74266)
------------------------------------------------------------
#Fit statistic : Chi-Squared =          58.95 using 59 PHA bins.
# Reduced chi-squared =          1.034 for     57 degrees of freedom
# Null hypothesis probability =   4.040190e-01

Energy  Fluence     90% Error
[keV]   [erg/cm2]   [erg/cm2]
15- 25  4.358e-08   2.504e-08
25- 50  8.383e-08   4.695e-08
50-150  1.839e-07   1.037e-07
15-150  3.113e-07   1.757e-07
Double BB
Spectral model: bbodyrad<1> + bbodyrad<2>
------------------------------------------------------------
Parameters  : value         Lower 90%    Upper 90%
kT1 [keV]   : 9.36260        (-4.17618      6.91395)
R1^2/D10^2  : 1.26670        (-0.973647      7.71369)
kT2 [keV]   : 45.1864        (-17.0951      -45.6421)
R2^2/D10^2  : 1.47100E-02    (-0.0120176   0.0337886)
------------------------------------------------------------
#Fit statistic : Chi-Squared =          43.41 using 59 PHA bins.
# Reduced chi-squared =         0.7893 for     55 degrees of freedom
# Null hypothesis probability =   8.705583e-01

Energy  Fluence     90% Error
[keV]   [erg/cm2]   [erg/cm2]
15- 25  2.558e-08   1.609e-08
25- 50  7.475e-08   4.025e-08
50-150  2.965e-07   1.622e-07
15-150  3.968e-07   2.101e-07
Pre-slew spectrum (Pre-slew PHA with pre-slew DRM)
Power-law model

Spectral model in power-law:
------------------------------------------------------------
Parameters  : value       lower 90%   higher 90%
Photon index: 1.56299     ( -0.164766   0.166 )
Norm@50keV  : 5.48497E-03    ( -0.000530734   0.000529192 )
------------------------------------------------------------
#Fit statistic : Chi-Squared =          58.10 using 59 PHA bins.
# Reduced chi-squared =          1.019 for     57 degrees of freedom
# Null hypothesis probability =   4.344281e-01

Photon flux (15-150 keV)    in 62.91 sec: 0.697004 ( -0.0697861  0.0699997 ) ph/cm2/s
Energy fluence (15-150 keV)             : 3.24253e-06 ( -3.3292e-07  3.34562e-07 ) ergs/cm2
Cutoff power-law model

Spectral model in the cutoff power-law:
------------------------------------------------------------
Parameters  : value       lower 90%   higher 90%
Photon index: 1.28863     ( -0.76004   0.41662 )
Epeak [keV] : 132.674      ( -64.7023 -132.696 )
Norm@50keV  : 7.51883E-03    ( -0.00751821   0.0101813 )
------------------------------------------------------------
#Fit statistic : Chi-Squared =          57.62 using 59 PHA bins.
# Reduced chi-squared =          1.029 for     56 degrees of freedom
# Null hypothesis probability =   4.151509e-01

Photon flux (15-150 keV)    in 62.91 sec: 0.688810 ( -0.07259  0.072605 ) ph/cm2/s
Energy fluence (15-150 keV)             : 3.19095e-06 ( -3.63972e-07  3.58178e-07 ) ergs/cm2
Band function

Spectral model in the Band function:
------------------------------------------------------------
Parameters  : value       lower 90%   higher 90%
alpha       : -0.752930   ( 0.777182   0.777182 )
beta        : -1.77536    ( 1.79332   0.345162 )
Epeak [keV] : 65.1770      ( -64.9881 343.699 )
Norm@50keV   : 1.54288E-02    ( -0.0157112   2666.94 )
------------------------------------------------------------
#Fit statistic : Chi-Squared =          56.70 using 59 PHA bins.
# Reduced chi-squared =          1.031 for     55 degrees of freedom
# Null hypothesis probability =   4.115825e-01

Photon flux (15-150 keV)    in 62.91 sec:  (    ) ph/cm2/s
Energy fluence (15-150 keV)             : 3.16585e-06 ( 0  0 ) ergs/cm2
S(25-50 keV) vs. S(50-100 keV) plot

S(25-50 keV)  = 8.26e-07
S(50-100 keV) = 1.12e-06
T90 vs. Hardness ratio plot
T90                                   = 56.2080000042915 sec.
Hardness ratio (energy fluence ratio) = 1.35593
Color vs. Color plot

Count Ratio  (25-50 keV) / (15-25 keV) = 1.53307
Count Ratio (50-100 keV) / (15-25 keV) = 1.09629
Mask shadow pattern

IMX = 9.820485789151535E-01, IMY = -5.246021422344366E-01
TIME vs. PHA plot around the trigger time
TIME vs. DetID plot around the trigger time

100 us light curve (15-350 keV)

Spacecraft aspect plot

Bright source in the pre-burst/pre-slew/post-slew images
Pre-burst image of 15-350 keV band
Time interval of the image:
-239.000000 -0.376000

# RAcent  DECcent POSerr Theta    Phi  PeakCts   SNR AngSep     Name
#  [deg]    [deg]    ['] [deg]  [deg]                   [']
 83.6217  22.0189    0.3  33.4 -152.9   9.5050  42.0    0.7	Crab
 96.7625  13.5343    3.0  37.8 -177.9   0.9335   3.9 ------	UNKNOWN
 99.9314  50.8914    2.5   3.6  -95.5   0.8925   4.6 ------	UNKNOWN
 77.8571   1.4296    2.5  54.5 -157.2   2.9402   4.7 ------	UNKNOWN
 72.1468  12.6862    2.6  46.7 -144.4   2.0297   4.5 ------	UNKNOWN
Pre-slew background subtracted image of 15-350 keV band
Time interval of the image:
-0.376000 62.536000

# RAcent  DECcent POSerr Theta    Phi  PeakCts   SNR AngSep     Name
#  [deg]    [deg]    ['] [deg]  [deg]                   [']
 83.7913  21.8624    0.0  33.5 -153.3   0.1011   0.9   12.7	Crab
197.4297  61.2460    0.8  48.1   28.1   5.0015  14.1 ------	UNKNOWN
121.8558  30.6120    2.2  23.4  130.6   0.5811   5.3 ------	UNKNOWN
 84.2456  47.4098    1.9  14.4 -106.7   0.5344   6.0 ------	UNKNOWN
350.3175  66.8091    2.4  52.9  -38.7   1.9009   4.9 ------	UNKNOWN
 52.8848  33.3922    2.6  41.8 -105.7   1.6602   4.4 ------	UNKNOWN
Post-slew image of 15-350 keV band
Time interval of the image:
528.500590 963.055600

# RAcent  DECcent POSerr Theta    Phi  PeakCts   SNR AngSep     Name
#  [deg]    [deg]    ['] [deg]  [deg]                   [']
254.5366  35.4350    8.6  43.8    2.2   0.8209   1.3    6.8	Her X-1
193.7112  31.1033    3.2  30.3   89.5   2.0370   3.6 ------	UNKNOWN
262.1645  24.3355    3.3  56.7    3.0   6.5862   3.5 ------	UNKNOWN
266.0068  40.0991    3.0  45.6  -12.1   2.0241   3.9 ------	UNKNOWN
152.6964  70.6034    2.8  19.9 -140.3   1.2410   4.2 ------	UNKNOWN
 88.7780  49.6875    4.9  55.3 -145.1   4.4123   2.4 ------	UNKNOWN
Plot creation:
Sat May 30 22:37:35 EDT 2015