Special notes of this burst
Image
Pre-slew 15.0-350.0 keV image (Event data)
#   RAcent    DECcent   POSerr    Theta     Phi              Peak Cts       SNR   Name
  133.4917    13.4875   0.0158    35.5498    74.6875         3.0274022     12.226 TRIG_00451191

Foreground time interval of the image:
 13.656  40.888 (delta_t =  27.232 [sec])
Background time interval of the image:
 -1.699  13.656 (delta_t =  15.355 [sec])
Lightcurves
Notes:
- 1) The mask-weighted light curves are using the flight position.
- 2) Multiple plots of different time binning/intervals are shown to cover all scenarios of short/long GRBs, rate/image triggers, and real/false positives.
- 3) For all the mask-weighted lightcurves, the y-axis units are counts/sec/det where a det is 0.4 x 0.4 = 0.16 sq cm.
- 4) The verticle lines correspond to following: green dotted lines are T50 interval, black dotted lines are T90 interval, blue solid line(s) is a spacecraft slew start time, and orange solid line(s) is a spacecraft slew end time.
- 5) Time of each bin is in the middle of the bin.
1 s binning
From T0-310 s to T0+310 s
From T100_start - 20 s to T100_end + 30 s
Full time interval
64 ms binning
Full time interval
From T100_start to T100_end
From T0-5 sec to T0+5 sec
16 ms binning
From T100_start-5 s to T100_start+5 s
Blue+Cyan dotted lines: Time interval of the scaled map
From 0.000000 to 80.000000
8 ms binning
From T100_start-3 s to T100_start+3 s
Blue+Cyan dotted lines: Time interval of the scaled map
From 0.000000 to 80.000000
2 ms binning
From T100_start-1 s to T100_start+1 s
Blue+Cyan dotted lines: Time interval of the scaled map
From 0.000000 to 80.000000
SN=5 or 10 sec. binning (whichever binning is satisfied first)
SN=5 or 10 sec. binning (T < 200 sec)
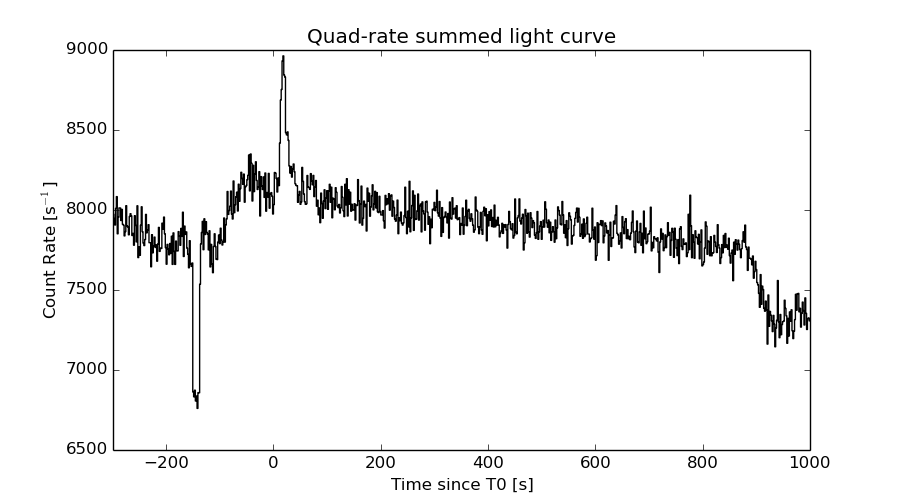
Quad-rate summed light curves (from T0-300s to T0+1000s)
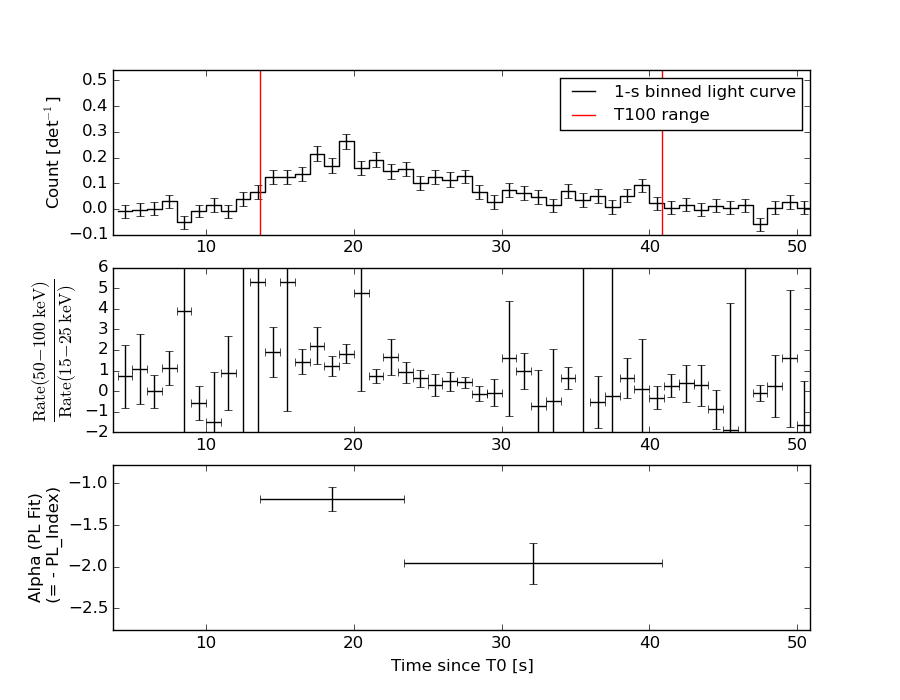
Spectral Evolution
Spectra
Notes:
- 1) The fitting includes the systematic errors.
- 2) When the burst includes telescope slew time periods, the fitting uses an average response file made from multiple 5-s response files through out the slew time plus single time preiod for the non-slew times, and weighted by the total counts in the corresponding time period using addrmf. An average response file is needed becuase a spectral fit using the pre-slew DRM will introduce some errors in both a spectral shape and a normalization if the PHA file contains a lot of the slew/post-slew time interval.
- 3) For fits to more complicated models (e.g. a power-law over a cutoff power-law), the BAT team has decided to require a chi-square improvement of more than 6 for each extra dof.
Time averaged spectrum fit using the average DRM
Power-law model
Time interval is from   13.656 sec. to   40.888 sec.

Spectral model in power-law:
------------------------------------------------------------
Parameters  : value       lower 90%   higher 90%
Photon index: 1.53709     ( -0.13488   0.135966 )
Norm@50keV  : 6.95965E-03    ( -0.000579898   0.00057673 )
------------------------------------------------------------
#Fit statistic : Chi-Squared =          66.01 using 59 PHA bins.
# Reduced chi-squared =          1.158 for     57 degrees of freedom
# Null hypothesis probability =   1.936363e-01

Photon flux (15-150 keV)    in 27.23 sec: 0.877796 ( -0.07077  0.0708308 ) ph/cm2/s
Energy fluence (15-150 keV)             : 1.78742e-06 ( -1.61723e-07  1.63332e-07 ) ergs/cm2
Cutoff power-law model

Time interval is from   13.656 sec. to   40.888 sec.
Spectral model in the cutoff power-law:
------------------------------------------------------------
Parameters  : value       lower 90%   higher 90%
Photon index: 0.775524     ( -0.669351   0.570913 )
Epeak [keV] : 74.7489      ( -17.0333 81.6631 )
Norm@50keV  : 1.77865E-02    ( -0.00884151   0.0224979 )
------------------------------------------------------------
#Fit statistic : Chi-Squared =          60.58 using 59 PHA bins.
# Reduced chi-squared =          1.082 for     56 degrees of freedom
# Null hypothesis probability =   3.141741e-01

Photon flux (15-150 keV)    in 27.23 sec: 0.850876 ( -0.073685  0.07362 ) ph/cm2/s
Energy fluence (15-150 keV)             : 1.66338e-06 ( -1.85766e-07  1.87879e-07 ) ergs/cm2
Band function

Time interval is from   13.656 sec. to   40.888 sec.

Spectral model in the Band function:
------------------------------------------------------------
Parameters  : value       lower 90%   higher 90%
alpha       : 4.61518   ( -4.68408   -4.61518 )
beta        : -1.81891    ( -0.209483   0.191213 )
Epeak [keV] : 30.1603      ( -3.58716 3.47301 )
Norm@50keV   : 141.362    ( -11.0889   585.88 )
------------------------------------------------------------
#Fit statistic : Chi-Squared =          55.15 using 59 PHA bins.
# Reduced chi-squared =          1.003 for     55 degrees of freedom
# Null hypothesis probability =   4.690062e-01

Photon flux (15-150 keV)    in 27.23 sec:  (    ) ph/cm2/s
Energy fluence (15-150 keV)             : 1.70732e-06 ( -1.70713e-06  -1.675e-07 ) ergs/cm2
Single BB
Spectral model blackbody:
------------------------------------------------------------
Parameters  : value    Lower 90%  Upper 90%
kT [keV]    : 13.2701  (-1.25756  1.42839)
R^2/D10^2   : 0.153710  (-0.0473264   0.0665171)
(R is the radius in km and D10 is the distance to the source in units of 10 kpc)
------------------------------------------------------------
#Fit statistic : Chi-Squared =          82.60 using 59 PHA bins.
# Reduced chi-squared =          1.449 for     57 degrees of freedom
# Null hypothesis probability =   1.496462e-02

Energy  Fluence     90% Error
[keV]   [erg/cm2]   [erg/cm2]
15- 25  1.562e-07   2.309e-08
25- 50  5.501e-07   5.323e-08
50-150  6.197e-07   1.072e-07
15-150  1.326e-06   1.390e-07
Thermal bremsstrahlung (OTTB)
Spectral model: thermal bremsstrahlung
------------------------------------------------------------
Parameters  : value         Lower 90%    Upper 90%
kT [keV]    : 189.224       (-64.1566      -189.224)
Norm        : 3.60261       (-0.292914     0.320952)
------------------------------------------------------------
#Fit statistic : Chi-Squared =          62.36 using 59 PHA bins.
# Reduced chi-squared =          1.094 for     57 degrees of freedom
# Null hypothesis probability =   2.913480e-01

Energy  Fluence     90% Error
[keV]   [erg/cm2]   [erg/cm2]
15- 25  2.459e-07   7.859e-08
25- 50  4.701e-07   2.141e-07
50-150  1.013e-06   5.306e-07
15-150  1.729e-06   8.711e-07
Double BB
Spectral model: bbodyrad<1> + bbodyrad<2>
------------------------------------------------------------
Parameters  : value         Lower 90%    Upper 90%
kT1 [keV]   : 8.49253        (-1.81089      1.92213)
R1^2/D10^2  : 0.533154        (-0.240934      0.541669)
kT2 [keV]   : 29.8136        (-9.13519      30.6249)
R2^2/D10^2  : 5.86094E-03    (-0.00513958   0.0174762)
------------------------------------------------------------
#Fit statistic : Chi-Squared =          56.33 using 59 PHA bins.
# Reduced chi-squared =          1.024 for     55 degrees of freedom
# Null hypothesis probability =   4.250706e-01

Energy  Fluence     90% Error
[keV]   [erg/cm2]   [erg/cm2]
15- 25  2.195e-07   5.852e-08
25- 50  5.190e-07   1.474e-07
50-150  9.843e-07   4.617e-07
15-150  1.723e-06   6.346e-07
Peak spectrum fit
Power-law model
Time interval is from   19.004 sec. to   20.004 sec.

Spectral model in power-law:
------------------------------------------------------------
Parameters  : value       lower 90%   higher 90%
Photon index: 1.19580     ( -0.307796   0.296178 )
Norm@50keV  : 1.75705E-02    ( -0.00312695   0.00312367 )
------------------------------------------------------------
#Fit statistic : Chi-Squared =          66.46 using 59 PHA bins.
# Reduced chi-squared =          1.166 for     57 degrees of freedom
# Null hypothesis probability =   1.831840e-01

Photon flux (15-150 keV)    in 1 sec: 2.06120 ( -0.378948  0.380125 ) ph/cm2/s
Energy fluence (15-150 keV)             : 1.78471e-07 ( -3.43776e-08  3.46891e-08 ) ergs/cm2
Cutoff power-law model
Time interval is from   19.004 sec. to   20.004 sec.
Spectral model in the cutoff power-law:
------------------------------------------------------------
Parameters  : value       lower 90%   higher 90%
Photon index: 0.753989     ( -1.40042   0.684624 )
Epeak [keV] : 154.775      ( -154.784 -154.784 )
Norm@50keV  : 2.83412E-02    (     )
------------------------------------------------------------
#Fit statistic : Chi-Squared =          66.00 using 59 PHA bins.
# Reduced chi-squared =          1.179 for     56 degrees of freedom
# Null hypothesis probability =   1.694589e-01

Photon flux (15-150 keV)    in 1 sec: 2.03037 ( -0.39046  0.38838 ) ph/cm2/s
Energy fluence (15-150 keV)             : 1.74891e-07 ( -3.5939e-08  3.5985e-08 ) ergs/cm2
Band function

Time interval is from   19.004 sec. to   20.004 sec.

Spectral model in the Band function:
------------------------------------------------------------
Parameters  : value       lower 90%   higher 90%
alpha       : -0.753773   ( -0.477763   1.17263 )
beta        : -10.00000    ( 10   20 )
Epeak [keV] : 154.658      ( -68.9328 -154.658 )
Norm@50keV   : 2.83507E-02    ( -0.0134948   0.0851841 )
------------------------------------------------------------
#Fit statistic : Chi-Squared =          66.00 using 59 PHA bins.
# Reduced chi-squared =          1.200 for     55 degrees of freedom
# Null hypothesis probability =   1.471027e-01

Photon flux (15-150 keV)    in 1 sec: 2.06418 (    ) ph/cm2/s
Energy fluence (15-150 keV)             : 0 ( 0  0 ) ergs/cm2
Single BB
Spectral model blackbody:
------------------------------------------------------------
Parameters  : value    Lower 90%  Upper 90%
kT [keV]    : 20.2405  (-4.05342  5.51954)
R^2/D10^2   : 9.25326E-02  (-0.0507111   0.102493)
(R is the radius in km and D10 is the distance to the source in units of 10 kpc)
------------------------------------------------------------
#Fit statistic : Chi-Squared =          71.09 using 59 PHA bins.
# Reduced chi-squared =          1.247 for     57 degrees of freedom
# Null hypothesis probability =   9.925337e-02

Energy  Fluence     90% Error
[keV]   [erg/cm2]   [erg/cm2]
15- 25  7.273e-09   2.768e-09
25- 50  3.651e-08   1.229e-08
50-150  1.111e-07   3.610e-08
15-150  1.548e-07   5.092e-08
Thermal bremsstrahlung (OTTB)
Spectral model: thermal bremsstrahlung
------------------------------------------------------------
Parameters  : value         Lower 90%    Upper 90%
kT [keV]    : 200.000       (      )
Norm        : 8.57953       (-1.55816     1.55802)
------------------------------------------------------------
#Fit statistic : Chi-Squared =          70.07 using 59 PHA bins.
# Reduced chi-squared =          1.229 for     57 degrees of freedom
# Null hypothesis probability =   1.144914e-01

Energy  Fluence     90% Error
[keV]   [erg/cm2]   [erg/cm2]
15- 25  2.137e-08   1.231e-08
25- 50  4.112e-08   2.383e-08
50-150  9.017e-08   5.230e-08
15-150  1.527e-07   8.680e-08
Double BB
Spectral model: bbodyrad<1> + bbodyrad<2>
------------------------------------------------------------
Parameters  : value         Lower 90%    Upper 90%
kT1 [keV]   : 5.56681        (-2.10242      3.92415)
R1^2/D10^2  : 3.69872        (-3.18776      11.7829)
kT2 [keV]   : 26.0393        (-6.48295      13.2886)
R2^2/D10^2  : 3.63459E-02    (-0.0266678   0.0468515)
------------------------------------------------------------
#Fit statistic : Chi-Squared =          64.04 using 59 PHA bins.
# Reduced chi-squared =          1.164 for     55 degrees of freedom
# Null hypothesis probability =   1.891068e-01

Energy  Fluence     90% Error
[keV]   [erg/cm2]   [erg/cm2]
15- 25  1.775e-08   1.047e-08
25- 50  3.569e-08   1.854e-08
50-150  1.218e-07   6.935e-08
15-150  1.753e-07   9.400e-08
Pre-slew spectrum (Pre-slew PHA with pre-slew DRM)
Power-law model

Spectral model in power-law:
------------------------------------------------------------
Parameters  : value       lower 90%   higher 90%
Photon index: 1.53709     ( -0.13488   0.135966 )
Norm@50keV  : 6.95965E-03    ( -0.000579898   0.00057673 )
------------------------------------------------------------
#Fit statistic : Chi-Squared =          66.01 using 59 PHA bins.
# Reduced chi-squared =          1.158 for     57 degrees of freedom
# Null hypothesis probability =   1.936363e-01

Photon flux (15-150 keV)    in 27.23 sec: 0.877796 ( -0.07077  0.0708308 ) ph/cm2/s
Energy fluence (15-150 keV)             : 1.78742e-06 ( -1.61723e-07  1.63332e-07 ) ergs/cm2
Cutoff power-law model
Spectral model in the cutoff power-law:
------------------------------------------------------------
Parameters  : value       lower 90%   higher 90%
Photon index: 0.775524     ( -0.669351   0.570913 )
Epeak [keV] : 74.7489      ( -17.0333 81.6631 )
Norm@50keV  : 1.77865E-02    ( -0.00884151   0.0224979 )
------------------------------------------------------------
#Fit statistic : Chi-Squared =          60.58 using 59 PHA bins.
# Reduced chi-squared =          1.082 for     56 degrees of freedom
# Null hypothesis probability =   3.141741e-01

Photon flux (15-150 keV)    in 27.23 sec: 0.850876 ( -0.073685  0.07362 ) ph/cm2/s
Energy fluence (15-150 keV)             : 1.66338e-06 ( -1.85766e-07  1.87879e-07 ) ergs/cm2
Band function
Spectral model in the Band function:
------------------------------------------------------------
Parameters  : value       lower 90%   higher 90%
alpha       : 4.61518   ( -4.68408   -4.61518 )
beta        : -1.81891    ( -0.209483   0.191213 )
Epeak [keV] : 30.1603      ( -3.58716 3.47301 )
Norm@50keV   : 141.362    ( -11.0889   585.88 )
------------------------------------------------------------
#Fit statistic : Chi-Squared =          55.15 using 59 PHA bins.
# Reduced chi-squared =          1.003 for     55 degrees of freedom
# Null hypothesis probability =   4.690062e-01

Photon flux (15-150 keV)    in 27.23 sec:  (    ) ph/cm2/s
Energy fluence (15-150 keV)             : 1.70732e-06 ( -1.70713e-06  -1.675e-07 ) ergs/cm2
S(25-50 keV) vs. S(50-100 keV) plot
S(25-50 keV)  = 4.50e-07
S(50-100 keV) = 6.20e-07
T90 vs. Hardness ratio plot
T90                                   = 24 sec.
Hardness ratio (energy fluence ratio) = 1.37778
Color vs. Color plot
Count Ratio  (25-50 keV) / (15-25 keV) = 1.63937
Count Ratio (50-100 keV) / (15-25 keV) = 1.06176
Mask shadow pattern
IMX = 1.887154681936289E-01, IMY = -6.892353721042619E-01
TIME vs. PHA plot around the trigger time
Blue+Cyan dotted lines: Time interval of the scaled map
From 0.000000 to 80.000000
TIME vs. DetID plot around the trigger time
Blue+Cyan dotted lines: Time interval of the scaled map
From 0.000000 to 80.000000
100 us light curve (15-350 keV)
Blue+Cyan dotted lines: Time interval of the scaled map
From 0.000000 to 80.000000
Spacecraft aspect plot
Bright source in the pre-burst/pre-slew/post-slew images
Pre-burst image of 15-350 keV band
Time interval of the image:
-1.699410 13.656000

# RAcent  DECcent POSerr Theta    Phi  PeakCts   SNR AngSep     Name
#  [deg]    [deg]    ['] [deg]  [deg]                   [']
 83.6096  21.9944    0.9  21.5  -40.0   0.5682  12.6    1.8	Crab
121.9490 -43.4837    2.1  53.8  158.6   1.3828   5.5 ------	UNKNOWN
106.2725  41.8442    2.3  36.7    9.8   0.3152   5.1 ------	UNKNOWN
 97.9609 -37.6260    2.1  43.5 -179.9   0.3768   5.4 ------	UNKNOWN
Pre-slew background subtracted image of 15-350 keV band
Time interval of the image:
13.656000 40.888000

# RAcent  DECcent POSerr Theta    Phi  PeakCts   SNR AngSep     Name
#  [deg]    [deg]    ['] [deg]  [deg]                   [']
 83.7084  22.1563    7.5  21.5  -39.5   0.1487   1.5    9.5	Crab
133.4917  13.4875    0.9  35.5   74.7   3.0278  12.2 ------	UNKNOWN
Post-slew image of 15-350 keV band
Time interval of the image:
Plot creation:
Sat May 30 22:31:51 EDT 2015