Click here for the BAT GCN circular template
Image
Pre-slew 15.0-350.0 keV image (Event data)
#   RAcent    DECcent   POSerr    Theta     Phi              Peak Cts       SNR   Name
   97.8780    24.3487   0.0123    49.3476  -170.8726         4.4950832     15.593 TRIG_00451343

Foreground time interval of the image:
-38.000  67.325 (delta_t = 105.325 [sec])
Background time interval of the image:
-239.376 -38.000 (delta_t = 201.376 [sec])
Lightcurves
Notes:
- 1) The mask-weighted light curves are using the flight position.
- 2) Multiple plots of different time binning/intervals are shown to cover all scenarios of short/long GRBs, rate/image triggers, and real/false positives.
- 3) For all the mask-weighted lightcurves, the y-axis units are counts/sec/det where a det is 0.4 x 0.4 = 0.16 sq cm.
- 4) The verticle lines correspond to following: green dotted lines are T50 interval, black dotted lines are T90 interval, blue solid line(s) is a spacecraft slew start time, and orange solid line(s) is a spacecraft slew end time.
- 5) Time of each bin is in the middle of the bin.
1 s binning
From T0-310 s to T0+310 s
From T100_start - 20 s to T100_end + 30 s

Full time interval

64 ms binning
Full time interval

From T100_start to T100_end
From T0-5 sec to T0+5 sec

16 ms binning
From T100_start-5 s to T100_start+5 s
Blue+Cyan dotted lines: Time interval of the scaled map
From 0.000000 to 16.384000
8 ms binning
From T100_start-3 s to T100_start+3 s

Blue+Cyan dotted lines: Time interval of the scaled map
From 0.000000 to 16.384000
2 ms binning
From T100_start-1 s to T100_start+1 s
Blue+Cyan dotted lines: Time interval of the scaled map
From 0.000000 to 16.384000
SN=5 or 10 sec. binning (whichever binning is satisfied first)

SN=5 or 10 sec. binning (T < 200 sec)
Quad-rate summed light curves (from T0-300s to T0+1000s)
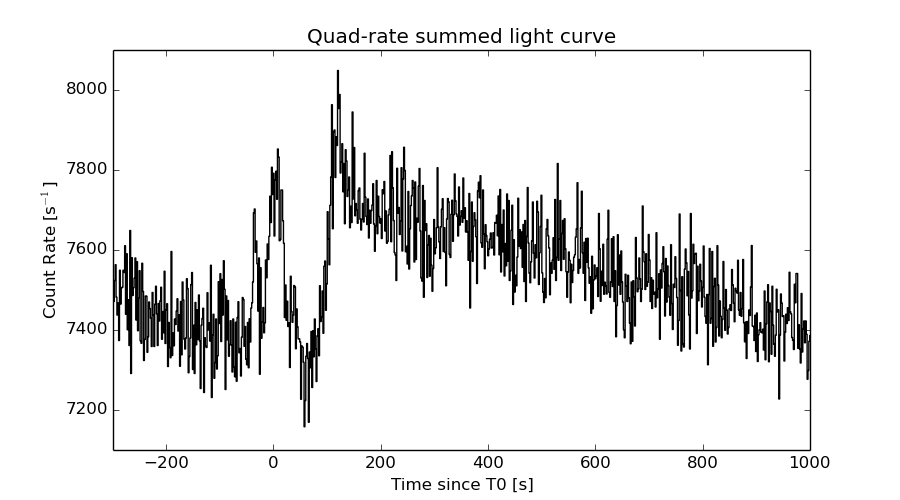
The mask-weighted light curves based on cleaned DPHs

Spectral Evolution

Spectra
Notes:
- 1) The fitting includes the systematic errors.
- 2) When the burst includes telescope slew time periods, the fitting uses an average response file made from multiple 5-s response files through out the slew time plus single time preiod for the non-slew times, and weighted by the total counts in the corresponding time period using addrmf. An average response file is needed becuase a spectral fit using the pre-slew DRM will introduce some errors in both a spectral shape and a normalization if the PHA file contains a lot of the slew/post-slew time interval.
- 3) For fits to more complicated models (e.g. a power-law over a cutoff power-law), the BAT team has decided to require a chi-square improvement of more than 6 for each extra dof.
Time averaged spectrum fit using the average DRM
Power-law model

Time interval is from  -38.000 sec. to  133.296 sec.

Spectral model in power-law:
------------------------------------------------------------
Parameters  : value       lower 90%   higher 90%
Photon index: 1.67222     ( -0.142771   0.145105 )
Norm@50keV  : 2.18976E-03    ( -0.000179086   0.000177611 )
------------------------------------------------------------
#Fit statistic : Chi-Squared =          63.09 using 59 PHA bins.
# Reduced chi-squared =          1.107 for     57 degrees of freedom
# Null hypothesis probability =   2.699496e-01

Photon flux (15-150 keV)    in 171.3 sec: 0.288059 ( -0.0231321  0.023204 ) ph/cm2/s
Energy fluence (15-150 keV)             : 3.48123e-06 ( -2.99828e-07  3.01908e-07 ) ergs/cm2
Cutoff power-law model

Time interval is from  -38.000 sec. to  133.296 sec.
Spectral model in the cutoff power-law:
------------------------------------------------------------
Parameters  : value       lower 90%   higher 90%
Photon index: 1.67600     ( -0.147181   0.142694 )
Epeak [keV] : 9999.36      ( -9999.35 -9999.36 )
Norm@50keV  : 2.18710E-03    ( -0.00219201   0.00152576 )
------------------------------------------------------------
#Fit statistic : Chi-Squared =          63.10 using 59 PHA bins.
# Reduced chi-squared =          1.127 for     56 degrees of freedom
# Null hypothesis probability =   2.399251e-01

Photon flux (15-150 keV)    in 171.3 sec: 0.287911 ( -0.023086  0.023455 ) ph/cm2/s
Energy fluence (15-150 keV)             : 3.48061e-06 ( -2.98422e-07  3.00323e-07 ) ergs/cm2
Band function

Time interval is from  -38.000 sec. to  133.296 sec.

Spectral model in the Band function:
------------------------------------------------------------
Parameters  : value       lower 90%   higher 90%
alpha       : -0.961378   ( 1.21732   1.21732 )
beta        : -1.69441    ( 1.68878   0.156751 )
Epeak [keV] : 38.5334      ( -38.5028 -38.5028 )
Norm@50keV   : 7.15334E-03    ( -0.0071564   359881 )
------------------------------------------------------------
#Fit statistic : Chi-Squared =          62.98 using 59 PHA bins.
# Reduced chi-squared =          1.145 for     55 degrees of freedom
# Null hypothesis probability =   2.148908e-01

Photon flux (15-150 keV)    in 171.3 sec:  (    ) ph/cm2/s
Energy fluence (15-150 keV)             : 0 ( 0  0 ) ergs/cm2
Single BB

Spectral model blackbody:
------------------------------------------------------------
Parameters  : value    Lower 90%  Upper 90%
kT [keV]    : 13.5792  (  )
R^2/D10^2   : 4.33522E-02  (   )
(R is the radius in km and D10 is the distance to the source in units of 10 kpc)
------------------------------------------------------------
#Fit statistic : Chi-Squared =         115.92 using 59 PHA bins.
# Reduced chi-squared =         2.0337 for     57 degrees of freedom
# Null hypothesis probability =   6.657327e-06

Energy  Fluence     90% Error
[keV]   [erg/cm2]   [erg/cm2]
15- 25  2.900e-07   4.651e-08
25- 50  1.046e-06   1.084e-07
50-150  1.249e-06   2.197e-07
15-150  2.585e-06   2.501e-07
Thermal bremsstrahlung (OTTB)

Spectral model: thermal bremsstrahlung
------------------------------------------------------------
Parameters  : value         Lower 90%    Upper 90%
kT [keV]    : 162.403       (-55.0367      -161.404)
Norm        : 1.16612       (-0.0996662     0.132478)
------------------------------------------------------------
#Fit statistic : Chi-Squared =          65.21 using 59 PHA bins.
# Reduced chi-squared =          1.144 for     57 degrees of freedom
# Null hypothesis probability =   2.127690e-01

Energy  Fluence     90% Error
[keV]   [erg/cm2]   [erg/cm2]
15- 25  5.093e-07   6.552e-08
25- 50  9.547e-07   2.043e-07
50-150  1.945e-06   9.196e-07
15-150  3.409e-06   1.075e-06
Double BB

Spectral model: bbodyrad<1> + bbodyrad<2>
------------------------------------------------------------
Parameters  : value         Lower 90%    Upper 90%
kT1 [keV]   : 6.72446        (-1.40235      1.58091)
R1^2/D10^2  : 0.406238        (-0.211821      0.563554)
kT2 [keV]   : 28.2226        (-6.54944      13.4287)
R2^2/D10^2  : 2.51560E-03    (-0.00179618   0.00403668)
------------------------------------------------------------
#Fit statistic : Chi-Squared =          64.02 using 59 PHA bins.
# Reduced chi-squared =          1.164 for     55 degrees of freedom
# Null hypothesis probability =   1.894130e-01

Energy  Fluence     90% Error
[keV]   [erg/cm2]   [erg/cm2]
15- 25  5.397e-07   1.415e-07
25- 50  9.472e-07   2.201e-07
50-150  2.012e-06   9.365e-07
15-150  3.499e-06   1.101e-06
Peak spectrum fit
Power-law model

Time interval is from    8.704 sec. to    9.704 sec.

Spectral model in power-law:
------------------------------------------------------------
Parameters  : value       lower 90%   higher 90%
Photon index: 1.61587     ( -0.417824   0.432474 )
Norm@50keV  : 1.03006E-02    ( -0.00263978   0.00260633 )
------------------------------------------------------------
#Fit statistic : Chi-Squared =          57.58 using 59 PHA bins.
# Reduced chi-squared =          1.010 for     57 degrees of freedom
# Null hypothesis probability =   4.536137e-01

Photon flux (15-150 keV)    in 1 sec: 1.33027 ( -0.341342  0.343336 ) ph/cm2/s
Energy fluence (15-150 keV)             : 9.61519e-08 ( -2.56462e-08  2.59923e-08 ) ergs/cm2
Cutoff power-law model

Time interval is from    8.704 sec. to    9.704 sec.
Spectral model in the cutoff power-law:
------------------------------------------------------------
Parameters  : value       lower 90%   higher 90%
Photon index: 0.997673     ( -2.2229   1.28462 )
Epeak [keV] : 82.7792      ( -72.656 -82.7792 )
Norm@50keV  : 2.10044E-02    ( -0.01312   0.218166 )
------------------------------------------------------------
#Fit statistic : Chi-Squared =          57.17 using 59 PHA bins.
# Reduced chi-squared =          1.021 for     56 degrees of freedom
# Null hypothesis probability =   4.315087e-01

Photon flux (15-150 keV)    in 1 sec: 1.30014 ( -0.352408  0.35242 ) ph/cm2/s
Energy fluence (15-150 keV)             : 9.33308e-08 ( -2.67301e-08  2.71142e-08 ) ergs/cm2
Band function

Time interval is from    8.704 sec. to    9.704 sec.

Spectral model in the Band function:
------------------------------------------------------------
Parameters  : value       lower 90%   higher 90%
alpha       : 4.97015   ( -4.97015   -4.97015 )
beta        : -1.70065    ( -0.678295   0.456638 )
Epeak [keV] : 23.8606      ( -23.8606 25.5223 )
Norm@50keV   : 1545.49    ( -380.233   9.89595e+06 )
------------------------------------------------------------
#Fit statistic : Chi-Squared =          57.12 using 59 PHA bins.
# Reduced chi-squared =          1.039 for     55 degrees of freedom
# Null hypothesis probability =   3.962284e-01

Photon flux (15-150 keV)    in 1 sec:  (    ) ph/cm2/s
Energy fluence (15-150 keV)             : 0 ( 0  0 ) ergs/cm2
Single BB

Spectral model blackbody:
------------------------------------------------------------
Parameters  : value    Lower 90%  Upper 90%
kT [keV]    : 15.3268  (-4.06984  5.3193)
R^2/D10^2   : 0.139888  (-0.0924714   0.279273)
(R is the radius in km and D10 is the distance to the source in units of 10 kpc)
------------------------------------------------------------
#Fit statistic : Chi-Squared =          60.36 using 59 PHA bins.
# Reduced chi-squared =          1.059 for     57 degrees of freedom
# Null hypothesis probability =   3.555186e-01

Energy  Fluence     90% Error
[keV]   [erg/cm2]   [erg/cm2]
15- 25  6.854e-09   4.030e-09
25- 50  2.777e-08   1.365e-08
50-150  4.482e-08   2.433e-08
15-150  7.945e-08   3.447e-08
Thermal bremsstrahlung (OTTB)

Spectral model: thermal bremsstrahlung
------------------------------------------------------------
Parameters  : value         Lower 90%    Upper 90%
kT [keV]    : 166.786       (-101.192      -166.751)
Norm        : 5.49263       (-1.41711     2.00101)
------------------------------------------------------------
#Fit statistic : Chi-Squared =          57.24 using 59 PHA bins.
# Reduced chi-squared =          1.004 for     57 degrees of freedom
# Null hypothesis probability =   4.662177e-01

Energy  Fluence     90% Error
[keV]   [erg/cm2]   [erg/cm2]
15- 25  1.397e-08   8.050e-09
25- 50  2.627e-08   1.499e-08
50-150  5.409e-08   3.253e-08
15-150  9.433e-08   5.655e-08
Double BB

Spectral model: bbodyrad<1> + bbodyrad<2>
------------------------------------------------------------
Parameters  : value         Lower 90%    Upper 90%
kT1 [keV]   : 5.49644        (-3.47385      8.62283)
R1^2/D10^2  : 3.13624        (-2.97609      10.0085)
kT2 [keV]   : 20.7543        (-6.97876      -20.7596)
R2^2/D10^2  : 3.91691E-02    (-0.0387326   0.152022)
------------------------------------------------------------
#Fit statistic : Chi-Squared =          56.76 using 59 PHA bins.
# Reduced chi-squared =          1.032 for     55 degrees of freedom
# Null hypothesis probability =   4.093668e-01

Energy  Fluence     90% Error
[keV]   [erg/cm2]   [erg/cm2]
15- 25  1.418e-08   7.950e-09
25- 50  2.534e-08   1.319e-08
50-150  5.299e-08   3.452e-08
15-150  9.250e-08   4.734e-08
Pre-slew spectrum (Pre-slew PHA with pre-slew DRM)
Power-law model

Spectral model in power-law:
------------------------------------------------------------
Parameters  : value       lower 90%   higher 90%
Photon index: 1.65679     ( -0.145531   0.147798 )
Norm@50keV  : 3.16390E-03    ( -0.000260653   0.000258806 )
------------------------------------------------------------
#Fit statistic : Chi-Squared =          58.29 using 59 PHA bins.
# Reduced chi-squared =          1.023 for     57 degrees of freedom
# Null hypothesis probability =   4.276472e-01

Photon flux (15-150 keV)    in 105.3 sec: 0.414058 ( -0.0341159  0.0342417 ) ph/cm2/s
Energy fluence (15-150 keV)             : 3.09642e-06 ( -2.69155e-07  2.70799e-07 ) ergs/cm2
Cutoff power-law model

Spectral model in the cutoff power-law:
------------------------------------------------------------
Parameters  : value       lower 90%   higher 90%
Photon index: 1.65942     ( -0.200874   0.145708 )
Epeak [keV] : 9999.36      ( -9999.99 -10000 )
Norm@50keV  : 3.16411E-03    (     )
------------------------------------------------------------
#Fit statistic : Chi-Squared =          58.30 using 59 PHA bins.
# Reduced chi-squared =          1.041 for     56 degrees of freedom
# Null hypothesis probability =   3.909077e-01

Photon flux (15-150 keV)    in 105.3 sec: 0.414137 ( -0.035831  0.033954 ) ph/cm2/s
Energy fluence (15-150 keV)             : 3.09329e-06 ( -2.68599e-07  2.7119e-07 ) ergs/cm2
Band function

Spectral model in the Band function:
------------------------------------------------------------
Parameters  : value       lower 90%   higher 90%
alpha       : -1.26935   ( 1.28753   6.26833 )
beta        : -1.66822    ( 1.66706   0.155749 )
Epeak [keV] : 49.9041      ( -50.8843 -50.8843 )
Norm@50keV   : 6.01407E-03    ( -0.00295912   0 )
------------------------------------------------------------
#Fit statistic : Chi-Squared =          58.29 using 59 PHA bins.
# Reduced chi-squared =          1.060 for     55 degrees of freedom
# Null hypothesis probability =   3.553378e-01

Photon flux (15-150 keV)    in 105.3 sec:  (    ) ph/cm2/s
Energy fluence (15-150 keV)             : 0 ( 0  0 ) ergs/cm2
S(25-50 keV) vs. S(50-100 keV) plot

S(25-50 keV)  = 9.31e-07
S(50-100 keV) = 1.17e-06
T90 vs. Hardness ratio plot

T90                                   = 153.115999937057 sec.
Hardness ratio (energy fluence ratio) = 1.25671
Color vs. Color plot
Count Ratio  (25-50 keV) / (15-25 keV) = 1.40788
Count Ratio (50-100 keV) / (15-25 keV) = 1.00512
Mask shadow pattern

IMX = -1.149816202800094E+00, IMY = 1.847357461875183E-01
TIME vs. PHA plot around the trigger time

Blue+Cyan dotted lines: Time interval of the scaled map
From 0.000000 to 16.384000
TIME vs. DetID plot around the trigger time

Blue+Cyan dotted lines: Time interval of the scaled map
From 0.000000 to 16.384000
100 us light curve (15-350 keV)

Blue+Cyan dotted lines: Time interval of the scaled map
From 0.000000 to 16.384000
Spacecraft aspect plot

Bright source in the pre-burst/pre-slew/post-slew images
Pre-burst image of 15-350 keV band
Time interval of the image:
-239.376000 -38.000000

# RAcent  DECcent POSerr Theta    Phi  PeakCts   SNR AngSep     Name
#  [deg]    [deg]    ['] [deg]  [deg]                   [']
 83.6197  22.0097    0.9  54.8 -155.5   7.8492  12.6    0.8	Crab
217.1377  53.4216    3.3  40.7   39.3   1.4157   3.5 ------	UNKNOWN
173.2606  63.4178    2.6  18.9   62.9   0.8923   4.5 ------	UNKNOWN
117.3881  28.3447    2.7  42.8  165.9   1.5597   4.3 ------	UNKNOWN
 68.3340  30.6103    3.7  51.1 -135.8   2.8131   3.2 ------	UNKNOWN
Pre-slew background subtracted image of 15-350 keV band
Time interval of the image:
-38.000000 67.324600

# RAcent  DECcent POSerr Theta    Phi  PeakCts   SNR AngSep     Name
#  [deg]    [deg]    ['] [deg]  [deg]                   [']
 83.5362  21.9693   21.7  54.9 -155.4  -0.2802  -0.5    6.0	Crab
165.3894  39.4300    2.1  36.9  100.4   2.2079   5.4 ------	UNKNOWN
 97.8780  24.3487    0.7  49.3 -170.9   4.4937  15.6 ------	UNKNOWN
314.3012  78.5219    2.4  30.7  -29.5   0.7154   4.7 ------	UNKNOWN
 80.2211  54.2288    2.3  26.1 -131.2   0.7748   5.0 ------	UNKNOWN
Post-slew image of 15-350 keV band
Time interval of the image:
131.324590 962.727800

# RAcent  DECcent POSerr Theta    Phi  PeakCts   SNR AngSep     Name
#  [deg]    [deg]    ['] [deg]  [deg]                   [']
 83.6284  22.0244    0.2  13.3  -99.9  34.5353  62.6    0.7	Crab
139.2826  53.6837    2.6  42.5   32.8   5.3154   4.5 ------	UNKNOWN
111.8183  21.7282    2.8  13.1   96.3   2.2491   4.2 ------	UNKNOWN
105.5595 -13.7429    2.7  38.8  165.5   3.5839   4.3 ------	UNKNOWN
100.4772 -21.1956    2.5  45.6  174.0   5.1608   4.7 ------	UNKNOWN
105.3518  46.0454    2.2  22.5   11.0   2.7179   5.2 ------	UNKNOWN
 65.4605 -20.9065    4.7  55.2 -145.0   8.3668   2.5 ------	UNKNOWN
Plot creation:
Sat May 30 22:29:40 EDT 2015