Special notes of this burst
Image
Pre-slew 15.0-350.0 keV image (Event data)
# RAcent DECcent POSerr Theta Phi Peak Cts SNR Name
261.6370 -23.4262 0.0037 24.0818 98.6174 7.6999045 51.400 TRIG_00453628
Foreground time interval of the image:
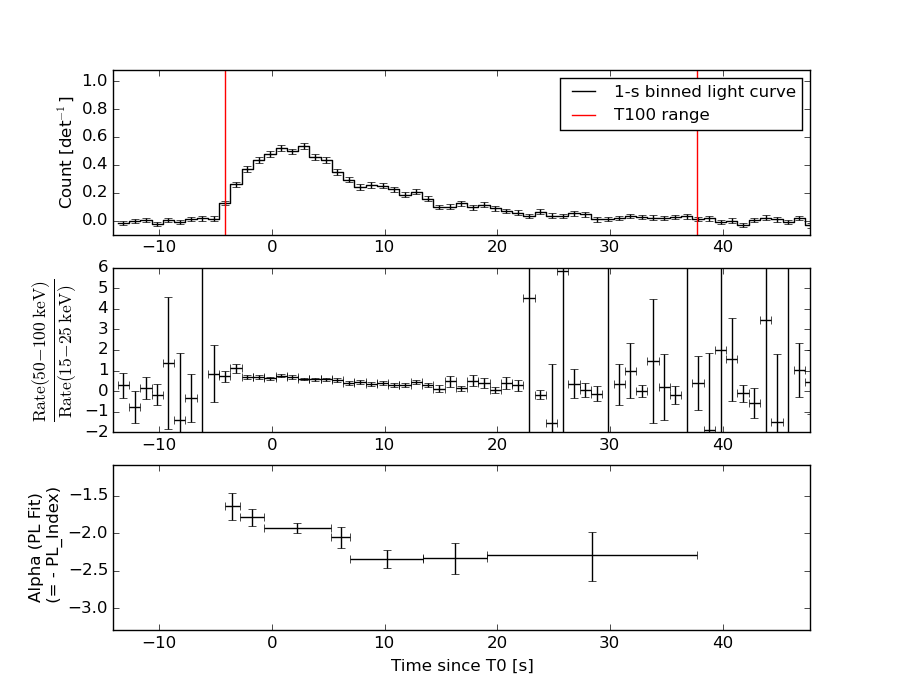
-4.148 37.760 (delta_t = 41.908 [sec])
Background time interval of the image:
-239.680 -4.148 (delta_t = 235.532 [sec])
Lightcurves
Notes:
- 1) The mask-weighted light curves are using the flight position.
- 2) Multiple plots of different time binning/intervals are shown to cover all scenarios of short/long GRBs, rate/image triggers, and real/false positives.
- 3) For all the mask-weighted lightcurves, the y-axis units are counts/sec/det where a det is 0.4 x 0.4 = 0.16 sq cm.
- 4) The verticle lines correspond to following: green dotted lines are T50 interval, black dotted lines are T90 interval, blue solid line(s) is a spacecraft slew start time, and orange solid line(s) is a spacecraft slew end time.
- 5) Time of each bin is in the middle of the bin.
1 s binning
From T0-310 s to T0+310 s
From T100_start - 20 s to T100_end + 30 s
Full time interval
64 ms binning
Full time interval
From T100_start to T100_end
From T0-5 sec to T0+5 sec
16 ms binning
From T100_start-5 s to T100_start+5 s
Blue+Cyan dotted lines: Time interval of the scaled map
From 0.000000 to 1.024000
8 ms binning
From T100_start-3 s to T100_start+3 s
Blue+Cyan dotted lines: Time interval of the scaled map
From 0.000000 to 1.024000
2 ms binning
From T100_start-1 s to T100_start+1 s
Blue+Cyan dotted lines: Time interval of the scaled map
From 0.000000 to 1.024000
SN=5 or 10 sec. binning (whichever binning is satisfied first)
SN=5 or 10 sec. binning (T < 200 sec)
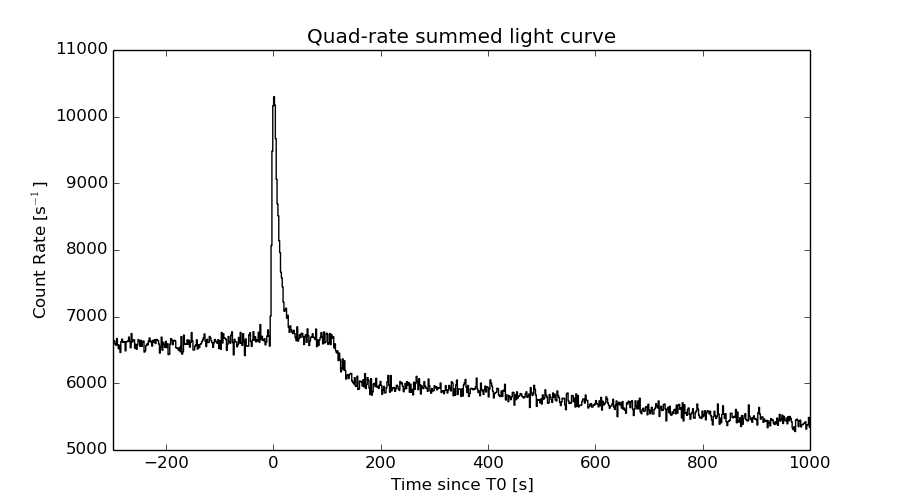
Quad-rate summed light curves (from T0-300s to T0+1000s)
Spectral Evolution
Spectra
Notes:
- 1) The fitting includes the systematic errors.
- 2) When the burst includes telescope slew time periods, the fitting uses an average response file made from multiple 5-s response files through out the slew time plus single time preiod for the non-slew times, and weighted by the total counts in the corresponding time period using addrmf. An average response file is needed becuase a spectral fit using the pre-slew DRM will introduce some errors in both a spectral shape and a normalization if the PHA file contains a lot of the slew/post-slew time interval.
- 3) For fits to more complicated models (e.g. a power-law over a cutoff power-law), the BAT team has decided to require a chi-square improvement of more than 6 for each extra dof.
Time averaged spectrum fit using the average DRM
Power-law model
Time interval is from   -4.148 sec. to   37.760 sec.

Spectral model in power-law:
------------------------------------------------------------
Parameters  : value       lower 90%   higher 90%
Photon index: 2.08813     ( -0.0623051   0.0629512 )
Norm@50keV  : 1.02074E-02    ( -0.000344844   0.000343109 )
------------------------------------------------------------
#Fit statistic : Chi-Squared =          49.69 using 59 PHA bins.
# Reduced chi-squared =         0.8718 for     57 degrees of freedom
# Null hypothesis probability =   7.430047e-01

Photon flux (15-150 keV)    in 41.91 sec: 1.59654 ( -0.0542925  0.0545565 ) ph/cm2/s
Energy fluence (15-150 keV)             : 3.97018e-06 ( -1.25259e-07  1.25519e-07 ) ergs/cm2
Cutoff power-law model
Time interval is from   -4.148 sec. to   37.760 sec.
Spectral model in the cutoff power-law:
------------------------------------------------------------
Parameters  : value       lower 90%   higher 90%
Photon index: 1.79834     ( -0.265586   0.216942 )
Epeak [keV] : 32.3760      (   )
Norm@50keV  : 1.44520E-02    (     )
------------------------------------------------------------
#Fit statistic : Chi-Squared =          45.71 using 59 PHA bins.
# Reduced chi-squared =         0.8163 for     56 degrees of freedom
# Null hypothesis probability =   8.351940e-01

Photon flux (15-150 keV)    in 41.91 sec: 1.55889 ( -0.0314  0.06256 ) ph/cm2/s
Energy fluence (15-150 keV)             : 3.85935e-06 ( -1.56383e-07  1.56077e-07 ) ergs/cm2
Band function

Time interval is from   -4.148 sec. to   37.760 sec.

Spectral model in the Band function:
------------------------------------------------------------
Parameters  : value       lower 90%   higher 90%
alpha       : 0.128669   ( -1.92092   3.28382 )
beta        : -2.18642    ( -0.164043   0.0891 )
Epeak [keV] : 28.0593      ( -4.13257 9.40065 )
Norm@50keV   : 0.327239    ( -0.325145   147.262 )
------------------------------------------------------------
#Fit statistic : Chi-Squared =          40.90 using 59 PHA bins.
# Reduced chi-squared =         0.7437 for     55 degrees of freedom
# Null hypothesis probability =   9.214687e-01

Photon flux (15-150 keV)    in 41.91 sec:  (    ) ph/cm2/s
Energy fluence (15-150 keV)             : 3.84062e-06 ( -3.84033e-06  -1.44958e-07 ) ergs/cm2
Single BB
Spectral model blackbody:
------------------------------------------------------------
Parameters  : value    Lower 90%  Upper 90%
kT [keV]    : 10.9491  (  )
R^2/D10^2   : 0.474910  (   )
(R is the radius in km and D10 is the distance to the source in units of 10 kpc)
------------------------------------------------------------
#Fit statistic : Chi-Squared =         263.42 using 59 PHA bins.
# Reduced chi-squared =         4.6214 for     57 degrees of freedom
# Null hypothesis probability =   2.696037e-28

Energy  Fluence     90% Error
[keV]   [erg/cm2]   [erg/cm2]
15- 25  4.981e-07   2.850e-08
25- 50  1.400e-06   5.029e-08
50-150  9.447e-07   7.397e-08
15-150  2.843e-06   9.367e-08
Thermal bremsstrahlung (OTTB)
Spectral model: thermal bremsstrahlung
------------------------------------------------------------
Parameters  : value         Lower 90%    Upper 90%
kT [keV]    : 66.0739       (-6.13017      7.12998)
Norm        : 7.69465       (-0.452565     0.486869)
------------------------------------------------------------
#Fit statistic : Chi-Squared =          53.81 using 59 PHA bins.
# Reduced chi-squared =         0.9440 for     57 degrees of freedom
# Null hypothesis probability =   5.955845e-01

Energy  Fluence     90% Error
[keV]   [erg/cm2]   [erg/cm2]
15- 25  8.218e-07   4.128e-08
25- 50  1.287e-06   4.317e-08
50-150  1.582e-06   1.067e-07
15-150  3.691e-06   1.245e-07
Double BB
Spectral model: bbodyrad<1> + bbodyrad<2>
------------------------------------------------------------
Parameters  : value         Lower 90%    Upper 90%
kT1 [keV]   : 6.55611        (-0.606571      0.622778)
R1^2/D10^2  : 2.67484        (-0.751735      1.17374)
kT2 [keV]   : 22.4015        (-2.76523      3.72197)
R2^2/D10^2  : 2.03786E-02    (-0.00916453   0.0144998)
------------------------------------------------------------
#Fit statistic : Chi-Squared =          48.05 using 59 PHA bins.
# Reduced chi-squared =         0.8737 for     55 degrees of freedom
# Null hypothesis probability =   7.350147e-01

Energy  Fluence     90% Error
[keV]   [erg/cm2]   [erg/cm2]
15- 25  7.981e-07   7.313e-08
25- 50  1.285e-06   8.089e-08
50-150  1.689e-06   2.393e-07
15-150  3.772e-06   3.382e-07
Peak spectrum fit
Power-law model
Time interval is from    2.348 sec. to    3.348 sec.

Spectral model in power-law:
------------------------------------------------------------
Parameters  : value       lower 90%   higher 90%
Photon index: 1.93051     ( -0.114063   0.117274 )
Norm@50keV  : 3.15897E-02    ( -0.00240885   0.00238251 )
------------------------------------------------------------
#Fit statistic : Chi-Squared =          74.82 using 59 PHA bins.
# Reduced chi-squared =          1.313 for     57 degrees of freedom
# Null hypothesis probability =   5.678196e-02

Photon flux (15-150 keV)    in 1 sec: 4.59330 ( -0.307223  0.307462 ) ph/cm2/s
Energy fluence (15-150 keV)             : 2.90561e-07 ( -2.15853e-08  2.17457e-08 ) ergs/cm2
Cutoff power-law model
Time interval is from    2.348 sec. to    3.348 sec.
Spectral model in the cutoff power-law:
------------------------------------------------------------
Parameters  : value       lower 90%   higher 90%
Photon index: 1.17116     ( -0.551009   0.482084 )
Epeak [keV] : 48.3888      ( -8.27414 14.3984 )
Norm@50keV  : 8.33104E-02    ( -0.0376911   0.0845837 )
------------------------------------------------------------
#Fit statistic : Chi-Squared =          67.07 using 59 PHA bins.
# Reduced chi-squared =          1.198 for     56 degrees of freedom
# Null hypothesis probability =   1.478306e-01

Photon flux (15-150 keV)    in 1 sec: 4.46922 ( -0.31697  0.31688 ) ph/cm2/s
Energy fluence (15-150 keV)             : 2.74079e-07 ( -2.3768e-08  2.4029e-08 ) ergs/cm2
Band function
Time interval is from    2.348 sec. to    3.348 sec.

Spectral model in the Band function:
------------------------------------------------------------
Parameters  : value       lower 90%   higher 90%
alpha       : -1.17136   ( -0.480093   0.526348 )
beta        : -9.36345    ( 9.37165   19.3716 )
Epeak [keV] : 48.5315      ( -8.07109 14.2014 )
Norm@50keV   : 8.31084E-02    ( -0.035713   0.013321 )
------------------------------------------------------------
#Fit statistic : Chi-Squared =          67.07 using 59 PHA bins.
# Reduced chi-squared =          1.219 for     55 degrees of freedom
# Null hypothesis probability =   1.275149e-01

Photon flux (15-150 keV)    in 1 sec: 4.46982 (    ) ph/cm2/s
Energy fluence (15-150 keV)             : 2.76653e-07 ( -2.76646e-07  -2.3519e-08 ) ergs/cm2
Single BB
Spectral model blackbody:
------------------------------------------------------------
Parameters  : value    Lower 90%  Upper 90%
kT [keV]    : 10.8498  (-0.828808  0.89918)
R^2/D10^2   : 1.58811  (-0.415941   0.561089)
(R is the radius in km and D10 is the distance to the source in units of 10 kpc)
------------------------------------------------------------
#Fit statistic : Chi-Squared =         106.27 using 59 PHA bins.
# Reduced chi-squared =         1.8644 for     57 degrees of freedom
# Null hypothesis probability =   8.204552e-05

Energy  Fluence     90% Error
[keV]   [erg/cm2]   [erg/cm2]
15- 25  3.895e-08   4.630e-09
25- 50  1.082e-07   8.065e-09
50-150  7.118e-08   1.204e-08
15-150  2.183e-07   1.725e-08
Thermal bremsstrahlung (OTTB)

Spectral model: thermal bremsstrahlung
------------------------------------------------------------
Parameters  : value         Lower 90%    Upper 90%
kT [keV]    : 77.0888       (-14.3303      19.7783)
Norm        : 21.9231       (-2.1834     2.465)
------------------------------------------------------------
#Fit statistic : Chi-Squared =          67.17 using 59 PHA bins.
# Reduced chi-squared =          1.178 for     57 degrees of freedom
# Null hypothesis probability =   1.677823e-01

Energy  Fluence     90% Error
[keV]   [erg/cm2]   [erg/cm2]
15- 25  5.674e-08   5.235e-09
25- 50  9.256e-08   6.150e-09
50-150  1.274e-07   1.910e-08
15-150  2.767e-07   2.355e-08
Double BB
Spectral model: bbodyrad<1> + bbodyrad<2>
------------------------------------------------------------
Parameters  : value         Lower 90%    Upper 90%
kT1 [keV]   : 6.48007        (-1.435      1.5258)
R1^2/D10^2  : 7.57542        (-3.71698      9.47995)
kT2 [keV]   : 20.1837        (-4.43062      8.32644)
R2^2/D10^2  : 9.97905E-02    (-0.0749807   0.192176)
------------------------------------------------------------
#Fit statistic : Chi-Squared =          66.84 using 59 PHA bins.
# Reduced chi-squared =          1.215 for     55 degrees of freedom
# Null hypothesis probability =   1.314844e-01

Energy  Fluence     90% Error
[keV]   [erg/cm2]   [erg/cm2]
15- 25  5.464e-08   1.232e-08
25- 50  9.409e-08   1.916e-08
50-150  1.252e-07   5.519e-08
15-150  2.739e-07   7.240e-08
Pre-slew spectrum (Pre-slew PHA with pre-slew DRM)
Power-law model
Spectral model in power-law:
------------------------------------------------------------
Parameters  : value       lower 90%   higher 90%
Photon index: 2.08813     ( -0.0623051   0.0629512 )
Norm@50keV  : 1.02074E-02    ( -0.000344844   0.000343109 )
------------------------------------------------------------
#Fit statistic : Chi-Squared =          49.69 using 59 PHA bins.
# Reduced chi-squared =         0.8718 for     57 degrees of freedom
# Null hypothesis probability =   7.430047e-01

Photon flux (15-150 keV)    in 41.91 sec: 1.59654 ( -0.0542925  0.0545565 ) ph/cm2/s
Energy fluence (15-150 keV)             : 3.97018e-06 ( -1.25259e-07  1.25519e-07 ) ergs/cm2
Cutoff power-law model

Spectral model in the cutoff power-law:
------------------------------------------------------------
Parameters  : value       lower 90%   higher 90%
Photon index: 1.79834     ( -0.265586   0.216942 )
Epeak [keV] : 32.3760      (   )
Norm@50keV  : 1.44520E-02    (     )
------------------------------------------------------------
#Fit statistic : Chi-Squared =          45.71 using 59 PHA bins.
# Reduced chi-squared =         0.8163 for     56 degrees of freedom
# Null hypothesis probability =   8.351940e-01

Photon flux (15-150 keV)    in 41.91 sec: 1.55889 ( -0.0314  0.06256 ) ph/cm2/s
Energy fluence (15-150 keV)             : 3.85935e-06 ( -1.56383e-07  1.56077e-07 ) ergs/cm2
Band function
Spectral model in the Band function:
------------------------------------------------------------
Parameters  : value       lower 90%   higher 90%
alpha       : 0.128669   ( -1.92092   3.28382 )
beta        : -2.18642    ( -0.164043   0.0891 )
Epeak [keV] : 28.0593      ( -4.13257 9.40065 )
Norm@50keV   : 0.327239    ( -0.325145   147.262 )
------------------------------------------------------------
#Fit statistic : Chi-Squared =          40.90 using 59 PHA bins.
# Reduced chi-squared =         0.7437 for     55 degrees of freedom
# Null hypothesis probability =   9.214687e-01

Photon flux (15-150 keV)    in 41.91 sec:  (    ) ph/cm2/s
Energy fluence (15-150 keV)             : 3.84062e-06 ( -3.84033e-06  -1.44958e-07 ) ergs/cm2
S(25-50 keV) vs. S(50-100 keV) plot
S(25-50 keV)  = 1.22e-06
S(50-100 keV) = 1.15e-06
T90 vs. Hardness ratio plot
T90                                   = 27.1839999556541 sec.
Hardness ratio (energy fluence ratio) = 0.942623
Color vs. Color plot
Count Ratio  (25-50 keV) / (15-25 keV) = 1.08869
Count Ratio (50-100 keV) / (15-25 keV) = 0.512877
Mask shadow pattern
IMX = -6.696747458899358E-02, IMY = -4.418953155461618E-01
TIME vs. PHA plot around the trigger time
Blue+Cyan dotted lines: Time interval of the scaled map
From 0.000000 to 1.024000
TIME vs. DetID plot around the trigger time
Blue+Cyan dotted lines: Time interval of the scaled map
From 0.000000 to 1.024000
100 us light curve (15-350 keV)
Blue+Cyan dotted lines: Time interval of the scaled map
From 0.000000 to 1.024000
Spacecraft aspect plot
Bright source in the pre-burst/pre-slew/post-slew images
Pre-burst image of 15-350 keV band
Time interval of the image:
-239.680000 -4.148000

# RAcent  DECcent POSerr Theta    Phi  PeakCts   SNR AngSep     Name
#  [deg]    [deg]    ['] [deg]  [deg]                   [']
255.7369 -37.8593    0.0  22.4   59.4  -0.3459  -1.3   11.9	4U 1700-377
256.4161 -36.4693    3.4  22.1   63.3   0.9056   3.4    2.9	GX 349+2
262.9761 -24.5623   19.7  22.4   98.5   0.1776   0.6   11.1	GX 1+4
264.9476 -44.4238    7.7  15.8   37.7   0.3328   1.5    8.9	4U 1735-44
268.3674  -1.4542   23.2  39.2  132.7   0.3110   0.5    0.1	SW J1753.5-0127
270.2682 -25.0668    3.9  17.4  111.5   0.7380   3.0    1.1	GX 5-1
270.1250 -25.7214    7.3  17.0  109.8   0.4065   1.6    9.7	GRS 1758-258
274.0063 -14.0343   39.5  25.5  134.7   0.0790   0.3    0.1	GX 17+2
276.0105 -30.3571    4.9  10.1  113.9   0.5178   2.4    4.5	H1820-303
285.1118 -24.7866    8.1  13.1  161.9   0.3339   1.4    9.0	HT1900.1-2455
288.6712  10.9311    3.8  49.0  164.0   1.9959   3.0    7.5	GRS 1915+105
262.8539 -33.9311   65.2  17.7   74.6  -0.0469  -0.2    8.9	GX 354-0
241.2671 -59.0157    3.3  34.5   16.4   1.0342   3.5 ------	UNKNOWN
161.5882 -88.7304    2.7  52.8  -20.5   2.7155   4.2 ------	UNKNOWN
346.2484 -83.3922    2.2  49.3  -29.5   2.6051   5.3 ------	UNKNOWN
339.0685 -45.0037    2.6  41.0  -83.8   6.1994   4.5 ------	UNKNOWN
333.7732 -26.4437    4.2  43.0 -112.2   3.6249   2.7 ------	UNKNOWN
330.1352  -8.2026    3.0  50.9 -135.4   5.8785   3.9 ------	UNKNOWN
Pre-slew background subtracted image of 15-350 keV band
Time interval of the image:
-4.148000 37.760000

# RAcent  DECcent POSerr Theta    Phi  PeakCts   SNR AngSep     Name
#  [deg]    [deg]    ['] [deg]  [deg]                   [']
256.0732 -37.7156    4.2  22.1   59.9  -0.3696  -2.7    8.7	4U 1700-377
256.6766 -36.4029   10.6  21.9   63.6   0.1527   1.1   11.7	GX 349+2
263.0295 -24.6090   13.5  22.3   98.5  -0.1211  -0.9    8.3	GX 1+4
265.0240 -44.4121    0.0  15.8   37.7  -0.2627  -2.4   12.3	4U 1735-44
268.3965  -1.4784    5.1  39.2  132.7   0.5975   2.3    2.3	SW J1753.5-0127
270.1971 -25.1294   14.3  17.4  111.2  -0.0961  -0.8    5.6	GX 5-1
270.3244 -25.8612    4.9  16.8  109.9  -0.2751  -2.4    7.2	GRS 1758-258
274.1575 -13.9515    3.7  25.5  135.1   0.4433   3.1   10.2	GX 17+2
276.1578 -30.3005    0.0  10.1  114.6   0.0175   0.2   12.7	H1820-303
285.0449 -24.9215   31.5  13.0  161.7  -0.0368  -0.4    0.5	HT1900.1-2455
288.9096  11.0679   23.0  49.2  164.3   0.1637   0.5    9.8	GRS 1915+105
263.0445 -33.9162   31.8  17.5   74.9  -0.0476  -0.4    5.6	GX 354-0
255.4561  -8.9650    1.7  38.8  108.9   2.4865   6.7 ------	UNKNOWN
261.6370 -23.4262    0.2  24.1   98.6   7.6992  51.1 ------	UNKNOWN
197.0454 -75.2655    2.2  52.8   -3.2   1.5754   5.1 ------	UNKNOWN
  2.5407 -72.1826    2.5  50.7  -44.6   1.9961   4.6 ------	UNKNOWN
351.8269 -65.7016    2.4  46.9  -53.2   1.7160   4.8 ------	UNKNOWN
334.5148 -30.0963    2.4  41.9 -107.0   1.6699   4.8 ------	UNKNOWN
Post-slew image of 15-350 keV band
Time interval of the image:
224.820590 962.415100

# RAcent  DECcent POSerr Theta    Phi  PeakCts   SNR AngSep     Name
#  [deg]    [deg]    ['] [deg]  [deg]                   [']
 34.5808 -56.8957    3.4  45.8   38.1   4.5865   3.3 ------	UNKNOWN
 51.7303 -30.2509    3.1  34.9   -4.7   2.0104   3.7 ------	UNKNOWN
 73.7304 -25.9709    3.4  52.8  -17.1   3.5536   3.4 ------	UNKNOWN
 70.0275 -22.3136    3.3  49.3  -21.5   3.1829   3.5 ------	UNKNOWN
 78.7984 -18.4159    4.4  57.5  -26.3   7.3742   2.6 ------	UNKNOWN
  2.8954  40.5360    4.8  55.3 -145.2   8.3914   2.5 ------	UNKNOWN
 69.8453  -4.6791    3.9  50.7  -44.5   6.9282   3.0 ------	UNKNOWN
 33.0565  28.2731    3.2  43.1 -112.2   8.1569   3.6 ------	UNKNOWN
Plot creation:
Sat May 30 22:18:37 EDT 2015