Special notes of this burst
Image
Pre-slew 15.0-350.0 keV image (Event data)
#   RAcent    DECcent   POSerr    Theta     Phi              Peak Cts       SNR   Name
  134.3596    56.4211   0.0082    30.1286    14.8159         1.7198390     23.588 TRIG_00453747

Foreground time interval of the image:
 -1.152  25.533 (delta_t =  26.685 [sec])
Background time interval of the image:
-239.168  -1.152 (delta_t = 238.016 [sec])
Lightcurves
Notes:
- 1) The mask-weighted light curves are using the flight position.
- 2) Multiple plots of different time binning/intervals are shown to cover all scenarios of short/long GRBs, rate/image triggers, and real/false positives.
- 3) For all the mask-weighted lightcurves, the y-axis units are counts/sec/det where a det is 0.4 x 0.4 = 0.16 sq cm.
- 4) The verticle lines correspond to following: green dotted lines are T50 interval, black dotted lines are T90 interval, blue solid line(s) is a spacecraft slew start time, and orange solid line(s) is a spacecraft slew end time.
- 5) Time of each bin is in the middle of the bin.
1 s binning
From T0-310 s to T0+310 s
From T100_start - 20 s to T100_end + 30 s

Full time interval

64 ms binning
Full time interval
From T100_start to T100_end

From T0-5 sec to T0+5 sec

16 ms binning
From T100_start-5 s to T100_start+5 s
Blue+Cyan dotted lines: Time interval of the scaled map
From 0.000000 to 2.048000
8 ms binning
From T100_start-3 s to T100_start+3 s
Blue+Cyan dotted lines: Time interval of the scaled map
From 0.000000 to 2.048000
2 ms binning
From T100_start-1 s to T100_start+1 s

Blue+Cyan dotted lines: Time interval of the scaled map
From 0.000000 to 2.048000
SN=5 or 10 sec. binning (whichever binning is satisfied first)
SN=5 or 10 sec. binning (T < 200 sec)

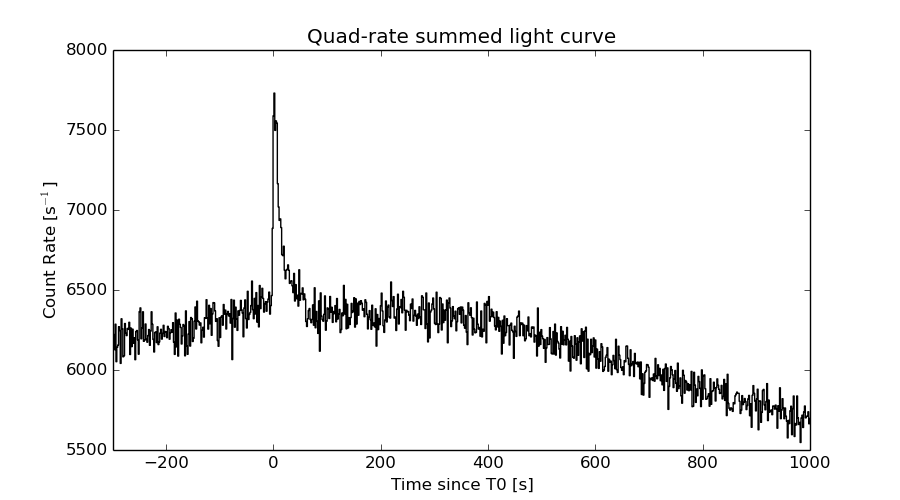
Quad-rate summed light curves (from T0-300s to T0+1000s)
Spectral Evolution

Spectra
Notes:
- 1) The fitting includes the systematic errors.
- 2) When the burst includes telescope slew time periods, the fitting uses an average response file made from multiple 5-s response files through out the slew time plus single time preiod for the non-slew times, and weighted by the total counts in the corresponding time period using addrmf. An average response file is needed becuase a spectral fit using the pre-slew DRM will introduce some errors in both a spectral shape and a normalization if the PHA file contains a lot of the slew/post-slew time interval.
- 3) For fits to more complicated models (e.g. a power-law over a cutoff power-law), the BAT team has decided to require a chi-square improvement of more than 6 for each extra dof.
Time averaged spectrum fit using the average DRM
Power-law model
Time interval is from   -1.152 sec. to   26.496 sec.

Spectral model in power-law:
------------------------------------------------------------
Parameters  : value       lower 90%   higher 90%
Photon index: 1.20924     ( -0.118338   0.116885 )
Norm@50keV  : 4.15141E-03    ( -0.000276928   0.00027683 )
------------------------------------------------------------
#Fit statistic : Chi-Squared =          51.07 using 59 PHA bins.
# Reduced chi-squared =         0.8959 for     57 degrees of freedom
# Null hypothesis probability =   6.960511e-01

Photon flux (15-150 keV)    in 27.65 sec: 0.487929 ( -0.0339505  0.0340316 ) ph/cm2/s
Energy fluence (15-150 keV)             : 1.16154e-06 ( -8.43032e-08  8.4664e-08 ) ergs/cm2
Cutoff power-law model
Time interval is from   -1.152 sec. to   26.496 sec.
Spectral model in the cutoff power-law:
------------------------------------------------------------
Parameters  : value       lower 90%   higher 90%
Photon index: 0.882795     ( -0.513243   0.377941 )
Epeak [keV] : 185.650      ( -82.2153 -185.651 )
Norm@50keV  : 5.91466E-03    ( -0.00192382   0.00422566 )
------------------------------------------------------------
#Fit statistic : Chi-Squared =          49.63 using 59 PHA bins.
# Reduced chi-squared =         0.8862 for     56 degrees of freedom
# Null hypothesis probability =   7.131925e-01

Photon flux (15-150 keV)    in 27.65 sec: 0.480714 ( -0.035479  0.035471 ) ph/cm2/s
Energy fluence (15-150 keV)             : 1.13851e-06 ( -9.23482e-08  9.13611e-08 ) ergs/cm2
Band function
Time interval is from   -1.152 sec. to   26.496 sec.

Spectral model in the Band function:
------------------------------------------------------------
Parameters  : value       lower 90%   higher 90%
alpha       : -8.12207E-02   ( -1.30873   0.230486 )
beta        : -1.39486    ( 1.39005   0.215134 )
Epeak [keV] : 69.3597      ( -38.7614 152.976 )
Norm@50keV   : 1.78063E-02    ( -0.0179456   47.0752 )
------------------------------------------------------------
#Fit statistic : Chi-Squared =          47.93 using 59 PHA bins.
# Reduced chi-squared =         0.8714 for     55 degrees of freedom
# Null hypothesis probability =   7.392646e-01

Photon flux (15-150 keV)    in 27.65 sec:  (    ) ph/cm2/s
Energy fluence (15-150 keV)             : 0 ( 0  0 ) ergs/cm2
Single BB
Spectral model blackbody:
------------------------------------------------------------
Parameters  : value    Lower 90%  Upper 90%
kT [keV]    : 18.5452  (-1.61526  1.82879)
R^2/D10^2   : 2.85571E-02  (-0.00771431   0.0102717)
(R is the radius in km and D10 is the distance to the source in units of 10 kpc)
------------------------------------------------------------
#Fit statistic : Chi-Squared =          86.47 using 59 PHA bins.
# Reduced chi-squared =          1.517 for     57 degrees of freedom
# Null hypothesis probability =   7.126802e-03

Energy  Fluence     90% Error
[keV]   [erg/cm2]   [erg/cm2]
15- 25  5.384e-08   7.576e-09
25- 50  2.545e-07   2.912e-08
50-150  6.400e-07   7.728e-08
15-150  9.483e-07   8.032e-08
Thermal bremsstrahlung (OTTB)

Spectral model: thermal bremsstrahlung
------------------------------------------------------------
Parameters  : value         Lower 90%    Upper 90%
kT [keV]    : 200.000       (      )
Norm        : 2.04070       (-0.138523     0.138501)
------------------------------------------------------------
#Fit statistic : Chi-Squared =          73.40 using 59 PHA bins.
# Reduced chi-squared =          1.288 for     57 degrees of freedom
# Null hypothesis probability =   7.075711e-02

Energy  Fluence     90% Error
[keV]   [erg/cm2]   [erg/cm2]
15- 25  1.405e-07   1.212e-08
25- 50  2.702e-07   3.655e-08
50-150  5.927e-07   1.580e-07
15-150  1.003e-06   2.072e-07
Double BB

Spectral model: bbodyrad<1> + bbodyrad<2>
------------------------------------------------------------
Parameters  : value         Lower 90%    Upper 90%
kT1 [keV]   : 10.1266        (-2.32041      2.60338)
R1^2/D10^2  : 0.139510        (-0.0637047      0.147709)
kT2 [keV]   : 41.0029        (-12.761      68.9387)
R2^2/D10^2  : 1.69347E-03    (-0.00148734   0.0040411)
------------------------------------------------------------
#Fit statistic : Chi-Squared =          48.15 using 59 PHA bins.
# Reduced chi-squared =         0.8755 for     55 degrees of freedom
# Null hypothesis probability =   7.315860e-01

Energy  Fluence     90% Error
[keV]   [erg/cm2]   [erg/cm2]
15- 25  9.088e-08   2.425e-08
25- 50  2.733e-07   6.950e-08
50-150  7.861e-07   3.332e-07
15-150  1.150e-06   4.084e-07
Peak spectrum fit
Power-law model

Time interval is from    4.140 sec. to    5.140 sec.

Spectral model in power-law:
------------------------------------------------------------
Parameters  : value       lower 90%   higher 90%
Photon index: 1.07331     ( -0.29191   0.278272 )
Norm@50keV  : 9.37467E-03    ( -0.00149089   0.00148533 )
------------------------------------------------------------
#Fit statistic : Chi-Squared =          42.67 using 59 PHA bins.
# Reduced chi-squared =         0.7486 for     57 degrees of freedom
# Null hypothesis probability =   9.207944e-01

Photon flux (15-150 keV)    in 1 sec: 1.08476 ( -0.177189  0.177936 ) ph/cm2/s
Energy fluence (15-150 keV)             : 9.88676e-08 ( -1.69626e-08  1.7097e-08 ) ergs/cm2
Cutoff power-law model

Time interval is from    4.140 sec. to    5.140 sec.
Spectral model in the cutoff power-law:
------------------------------------------------------------
Parameters  : value       lower 90%   higher 90%
Photon index: 1.07898     ( -0.301084   0.273705 )
Epeak [keV] : 9999.17      ( -9999.36 -9999.36 )
Norm@50keV  : 9.42243E-03    ( -0.00147434   0.0166642 )
------------------------------------------------------------
#Fit statistic : Chi-Squared =          42.68 using 59 PHA bins.
# Reduced chi-squared =         0.7622 for     56 degrees of freedom
# Null hypothesis probability =   9.049970e-01

Photon flux (15-150 keV)    in 1 sec: 1.08568 ( -0.178796  0.17515 ) ph/cm2/s
Energy fluence (15-150 keV)             : 9.89058e-08 ( -1.71813e-08  1.69502e-08 ) ergs/cm2
Band function

Time interval is from    4.140 sec. to    5.140 sec.

Spectral model in the Band function:
------------------------------------------------------------
Parameters  : value       lower 90%   higher 90%
alpha       : 4.82907   ( -4.82907   -4.82907 )
beta        : -1.13619    ( -0.324039   0.315656 )
Epeak [keV] : 26.1973      ( -26.1973 12.058 )
Norm@50keV   : 395.096    ( -61.9136   2.48062e+06 )
------------------------------------------------------------
#Fit statistic : Chi-Squared =          42.04 using 59 PHA bins.
# Reduced chi-squared =         0.7644 for     55 degrees of freedom
# Null hypothesis probability =   9.003532e-01

Photon flux (15-150 keV)    in 1 sec:  (    ) ph/cm2/s
Energy fluence (15-150 keV)             : 0 ( 0  0 ) ergs/cm2
Single BB

Spectral model blackbody:
------------------------------------------------------------
Parameters  : value    Lower 90%  Upper 90%
kT [keV]    : 21.1491  (-4.53329  6.39802)
R^2/D10^2   : 4.23577E-02  (-0.0238533   0.0500808)
(R is the radius in km and D10 is the distance to the source in units of 10 kpc)
------------------------------------------------------------
#Fit statistic : Chi-Squared =          52.81 using 59 PHA bins.
# Reduced chi-squared =         0.9265 for     57 degrees of freedom
# Null hypothesis probability =   6.329697e-01

Energy  Fluence     90% Error
[keV]   [erg/cm2]   [erg/cm2]
15- 25  3.568e-09   1.241e-09
25- 50  1.842e-08   5.962e-09
50-150  6.145e-08   2.001e-08
15-150  8.345e-08   2.324e-08
Thermal bremsstrahlung (OTTB)

Spectral model: thermal bremsstrahlung
------------------------------------------------------------
Parameters  : value         Lower 90%    Upper 90%
kT [keV]    : 200.000       (      )
Norm        : 4.46759       (-0.730245     0.730177)
------------------------------------------------------------
#Fit statistic : Chi-Squared =          50.83 using 59 PHA bins.
# Reduced chi-squared =         0.8917 for     57 degrees of freedom
# Null hypothesis probability =   7.044411e-01

Energy  Fluence     90% Error
[keV]   [erg/cm2]   [erg/cm2]
15- 25  1.112e-08   6.430e-09
25- 50  2.140e-08   1.218e-08
50-150  4.693e-08   2.592e-08
15-150  7.946e-08   4.548e-08
Double BB

Spectral model: bbodyrad<1> + bbodyrad<2>
------------------------------------------------------------
Parameters  : value         Lower 90%    Upper 90%
kT1 [keV]   : 9.17660        (-4.32415      6.23362)
R1^2/D10^2  : 0.413355        (-0.316007      0.601309)
kT2 [keV]   : 47.5958        (-43.3898      -48.2786)
R2^2/D10^2  : 3.11519E-03    (-0.00275805   0.0201357)
------------------------------------------------------------
#Fit statistic : Chi-Squared =          42.40 using 59 PHA bins.
# Reduced chi-squared =         0.7710 for     55 degrees of freedom
# Null hypothesis probability =   8.929725e-01

Energy  Fluence     90% Error
[keV]   [erg/cm2]   [erg/cm2]
15- 25  7.643e-09   4.423e-09
25- 50  2.071e-08   1.189e-08
50-150  7.257e-08   3.971e-08
15-150  1.009e-07   5.080e-08
Pre-slew spectrum (Pre-slew PHA with pre-slew DRM)
Power-law model
Spectral model in power-law:
------------------------------------------------------------
Parameters  : value       lower 90%   higher 90%
Photon index: 1.20021     ( -0.117535   0.116018 )
Norm@50keV  : 4.24646E-03    ( -0.000282204   0.000282073 )
------------------------------------------------------------
#Fit statistic : Chi-Squared =          52.78 using 59 PHA bins.
# Reduced chi-squared =         0.9259 for     57 degrees of freedom
# Null hypothesis probability =   6.341711e-01

Photon flux (15-150 keV)    in 26.68 sec: 0.498462 ( -0.034544  0.0346173 ) ph/cm2/s
Energy fluence (15-150 keV)             : 1.14936e-06 ( -8.29649e-08  8.3304e-08 ) ergs/cm2
Cutoff power-law model
Spectral model in the cutoff power-law:
------------------------------------------------------------
Parameters  : value       lower 90%   higher 90%
Photon index: 0.852937     ( -0.514045   0.396046 )
Epeak [keV] : 179.028      ( -76.3785 -179.028 )
Norm@50keV  : 6.19041E-03    ( -0.002094   0.00443998 )
------------------------------------------------------------
#Fit statistic : Chi-Squared =          51.15 using 59 PHA bins.
# Reduced chi-squared =         0.9133 for     56 degrees of freedom
# Null hypothesis probability =   6.588063e-01

Photon flux (15-150 keV)    in 26.68 sec: 0.490739 ( -0.036062  0.036058 ) ph/cm2/s
Energy fluence (15-150 keV)             : 1.12503e-06 ( -9.10962e-08  9.00957e-08 ) ergs/cm2
Band function
Spectral model in the Band function:
------------------------------------------------------------
Parameters  : value       lower 90%   higher 90%
alpha       : 9.75801E-03   ( -1.037   0.0999143 )
beta        : -1.40097    ( 1.39789   0.214956 )
Epeak [keV] : 67.9342      ( -36.3031 105.684 )
Norm@50keV   : 2.01845E-02    ( -0.0217032   36.6456 )
------------------------------------------------------------
#Fit statistic : Chi-Squared =          48.94 using 59 PHA bins.
# Reduced chi-squared =         0.8898 for     55 degrees of freedom
# Null hypothesis probability =   7.040885e-01

Photon flux (15-150 keV)    in 26.68 sec:  (    ) ph/cm2/s
Energy fluence (15-150 keV)             : 0 ( 0  0 ) ergs/cm2
S(25-50 keV) vs. S(50-100 keV) plot

S(25-50 keV)  = 2.45e-07
S(50-100 keV) = 4.24e-07
T90 vs. Hardness ratio plot

T90                                   = 20.8640000224113 sec.
Hardness ratio (energy fluence ratio) = 1.73061
Color vs. Color plot
Count Ratio  (25-50 keV) / (15-25 keV) = 1.88182
Count Ratio (50-100 keV) / (15-25 keV) = 1.64053
Mask shadow pattern
IMX = 5.610522469974785E-01, IMY = -1.484031830978243E-01
TIME vs. PHA plot around the trigger time

Blue+Cyan dotted lines: Time interval of the scaled map
From 0.000000 to 2.048000
TIME vs. DetID plot around the trigger time

Blue+Cyan dotted lines: Time interval of the scaled map
From 0.000000 to 2.048000
100 us light curve (15-350 keV)

Blue+Cyan dotted lines: Time interval of the scaled map
From 0.000000 to 2.048000
Spacecraft aspect plot
Bright source in the pre-burst/pre-slew/post-slew images
Pre-burst image of 15-350 keV band
Time interval of the image:
-239.168000 -1.152000

# RAcent  DECcent POSerr Theta    Phi  PeakCts   SNR AngSep     Name
#  [deg]    [deg]    ['] [deg]  [deg]                   [']
 83.6321  22.0205    0.3  26.8 -111.7   9.7701  36.1    0.4	Crab
151.6301  15.7103    3.0  39.0   93.5   3.2969   3.8 ------	UNKNOWN
136.2542  -4.7533    2.4  42.3  132.8   3.1514   4.7 ------	UNKNOWN
 63.0856  34.3183    2.9  41.1  -81.3   3.2513   4.0 ------	UNKNOWN
Pre-slew background subtracted image of 15-350 keV band
Time interval of the image:
-1.152000 25.532600

# RAcent  DECcent POSerr Theta    Phi  PeakCts   SNR AngSep     Name
#  [deg]    [deg]    ['] [deg]  [deg]                   [']
 83.4692  22.0534    5.0  27.0 -111.5   0.1726   2.3    9.4	Crab
165.2193  53.8765    2.8  44.3   32.6   0.6021   4.2 ------	UNKNOWN
186.5702  72.4871    2.5  56.3   10.5   1.7211   4.6 ------	UNKNOWN
134.3597  56.4213    0.5  30.1   14.8   1.7193  23.6 ------	UNKNOWN
 58.1437  47.2529    2.6  44.1  -61.9   1.0531   4.4 ------	UNKNOWN
 66.2024  23.6462    2.0  41.1  -98.1   1.4961   5.7 ------	UNKNOWN
Post-slew image of 15-350 keV band
Time interval of the image:
83.532600 962.878700

# RAcent  DECcent POSerr Theta    Phi  PeakCts   SNR AngSep     Name
#  [deg]    [deg]    ['] [deg]  [deg]                   [']
223.2269  62.4581    3.8  42.0   43.0   4.9931   3.5 ------	UNKNOWN
222.6601  62.5138    3.8  41.7   43.2   5.6642   4.0 ------	UNKNOWN
  1.5658  60.1642    3.3  57.6  -26.3  11.6113   3.5 ------	UNKNOWN
105.7168   6.0113    4.1  55.2 -145.3  10.9307   2.8 ------	UNKNOWN
Plot creation:
Sat May 30 22:16:36 EDT 2015