Click here for the BAT GCN circular template
Image
Pre-slew 15.0-350.0 keV image (Event data)
#   RAcent    DECcent   POSerr    Theta     Phi              Peak Cts       SNR   Name
  120.1278    45.8081   0.0197    13.8173  -144.1414         0.7262714      9.754 TRIG_00453788

Foreground time interval of the image:
  0.568  49.869 (delta_t =  49.301 [sec])
Background time interval of the image:
-239.432   0.568 (delta_t = 240.000 [sec])
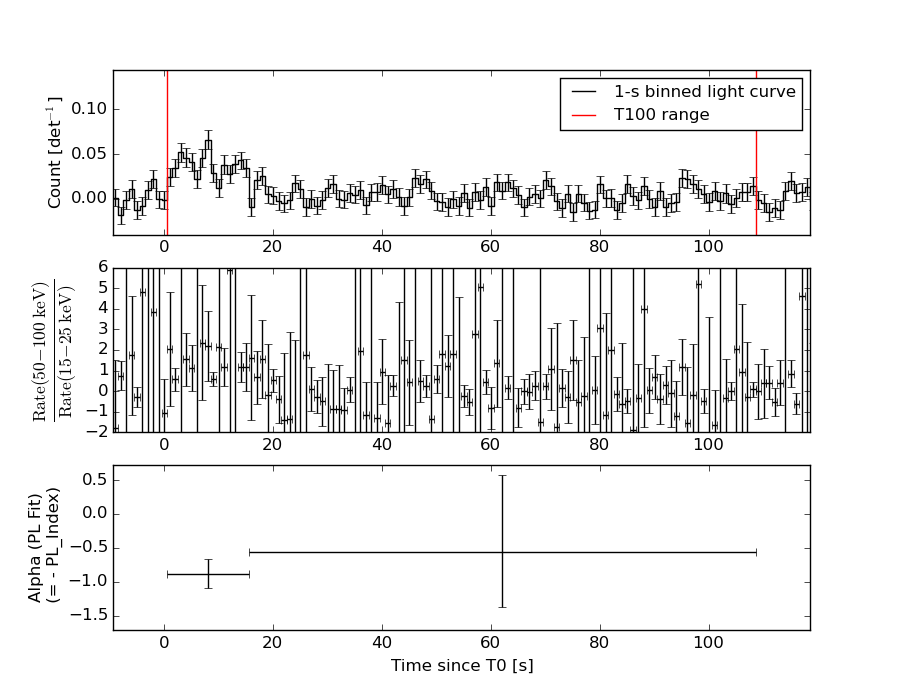
Lightcurves
Notes:
- 1) The mask-weighted light curves are using the flight position.
- 2) Multiple plots of different time binning/intervals are shown to cover all scenarios of short/long GRBs, rate/image triggers, and real/false positives.
- 3) For all the mask-weighted lightcurves, the y-axis units are counts/sec/det where a det is 0.4 x 0.4 = 0.16 sq cm.
- 4) The verticle lines correspond to following: green dotted lines are T50 interval, black dotted lines are T90 interval, blue solid line(s) is a spacecraft slew start time, and orange solid line(s) is a spacecraft slew end time.
- 5) Time of each bin is in the middle of the bin.
1 s binning
From T0-310 s to T0+310 s
From T100_start - 20 s to T100_end + 30 s
Full time interval

64 ms binning
Full time interval
From T100_start to T100_end
From T0-5 sec to T0+5 sec
16 ms binning
From T100_start-5 s to T100_start+5 s
Blue+Cyan dotted lines: Time interval of the scaled map
From 0.000000 to 8.192000
8 ms binning
From T100_start-3 s to T100_start+3 s
Blue+Cyan dotted lines: Time interval of the scaled map
From 0.000000 to 8.192000
2 ms binning
From T100_start-1 s to T100_start+1 s
Blue+Cyan dotted lines: Time interval of the scaled map
From 0.000000 to 8.192000
SN=5 or 10 sec. binning (whichever binning is satisfied first)
SN=5 or 10 sec. binning (T < 200 sec)
Quad-rate summed light curves (from T0-300s to T0+1000s)
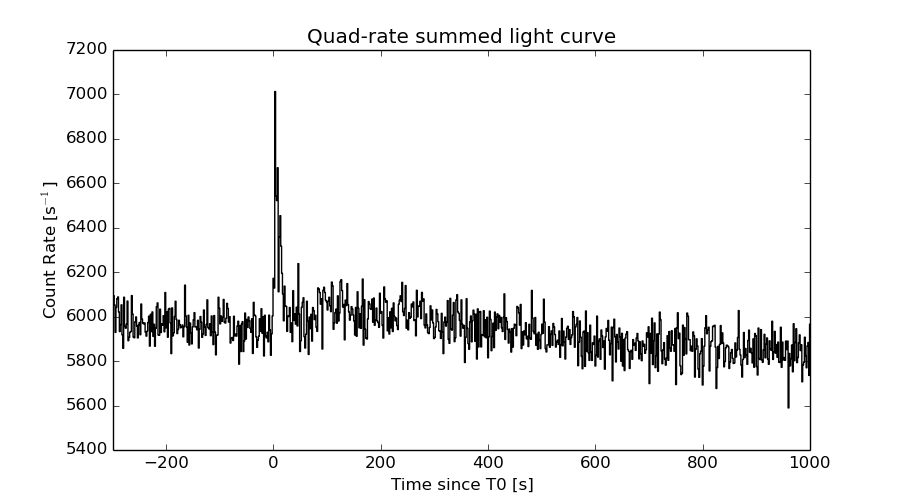
The mask-weighted light curves based on cleaned DPHs

Spectral Evolution
Spectra
Notes:
- 1) The fitting includes the systematic errors.
- 2) When the burst includes telescope slew time periods, the fitting uses an average response file made from multiple 5-s response files through out the slew time plus single time preiod for the non-slew times, and weighted by the total counts in the corresponding time period using addrmf. An average response file is needed becuase a spectral fit using the pre-slew DRM will introduce some errors in both a spectral shape and a normalization if the PHA file contains a lot of the slew/post-slew time interval.
- 3) For fits to more complicated models (e.g. a power-law over a cutoff power-law), the BAT team has decided to require a chi-square improvement of more than 6 for each extra dof.
Time averaged spectrum fit using the average DRM
Power-law model

Time interval is from    0.568 sec. to  108.568 sec.

Spectral model in power-law:
------------------------------------------------------------
Parameters  : value       lower 90%   higher 90%
Photon index: 0.764703     ( -0.374755   0.335202 )
Norm@50keV  : 5.23647E-04    ( -0.000103856   9.96412e-05 )
------------------------------------------------------------
#Fit statistic : Chi-Squared =          52.26 using 59 PHA bins.
# Reduced chi-squared =         0.9168 for     57 degrees of freedom
# Null hypothesis probability =   6.533286e-01

Photon flux (15-150 keV)    in 108 sec: 6.02751E-02 ( -0.0111787  0.0112598 ) ph/cm2/s
Energy fluence (15-150 keV)             : 6.70895e-07 ( -1.25528e-07  1.26513e-07 ) ergs/cm2
Cutoff power-law model

Time interval is from    0.568 sec. to  108.568 sec.
Spectral model in the cutoff power-law:
------------------------------------------------------------
Parameters  : value       lower 90%   higher 90%
Photon index: 0.766495     ( -0.386358   0.329709 )
Epeak [keV] : 9999.36      ( -9999.36 -9999.36 )
Norm@50keV  : 5.27483E-04    ( -0.000104854   0.000945194 )
------------------------------------------------------------
#Fit statistic : Chi-Squared =          52.27 using 59 PHA bins.
# Reduced chi-squared =         0.9334 for     56 degrees of freedom
# Null hypothesis probability =   6.168603e-01

Photon flux (15-150 keV)    in 108 sec: 6.04696E-02 (    ) ph/cm2/s
Energy fluence (15-150 keV)             : 6.69655e-07 ( -1.2426e-07  1.26821e-07 ) ergs/cm2
Band function
Time interval is from    0.568 sec. to  108.568 sec.

Spectral model in the Band function:
------------------------------------------------------------
Parameters  : value       lower 90%   higher 90%
alpha       : -0.807335   ( 0.807521   0.807521 )
beta        : -0.764704    ( -0.335001   0.374756 )
Epeak [keV] : 16.9577      ( -16.9572 -16.9572 )
Norm@50keV   : 7.39732E-04    ( -0.000316504   0 )
------------------------------------------------------------
#Fit statistic : Chi-Squared =          52.26 using 59 PHA bins.
# Reduced chi-squared =         0.9501 for     55 degrees of freedom
# Null hypothesis probability =   5.801216e-01

Photon flux (15-150 keV)    in 108 sec:  (    ) ph/cm2/s
Energy fluence (15-150 keV)             : 0 ( 0  0 ) ergs/cm2
Single BB
Spectral model blackbody:
------------------------------------------------------------
Parameters  : value    Lower 90%  Upper 90%
kT [keV]    : 26.3948  (-6.553  11.5938)
R^2/D10^2   : 1.27323E-03  (-0.000812827   0.0017573)
(R is the radius in km and D10 is the distance to the source in units of 10 kpc)
------------------------------------------------------------
#Fit statistic : Chi-Squared =          58.31 using 59 PHA bins.
# Reduced chi-squared =          1.023 for     57 degrees of freedom
# Null hypothesis probability =   4.268193e-01

Energy  Fluence     90% Error
[keV]   [erg/cm2]   [erg/cm2]
15- 25  1.616e-08   6.759e-09
25- 50  9.416e-08   3.833e-08
50-150  4.817e-07   2.027e-07
15-150  5.920e-07   1.979e-07
Thermal bremsstrahlung (OTTB)
Spectral model: thermal bremsstrahlung
------------------------------------------------------------
Parameters  : value         Lower 90%    Upper 90%
kT [keV]    : 200.000       (      )
Norm        : 0.243419       (-0.0468092     0.0468046)
------------------------------------------------------------
#Fit statistic : Chi-Squared =          67.38 using 59 PHA bins.
# Reduced chi-squared =          1.182 for     57 degrees of freedom
# Null hypothesis probability =   1.635626e-01

Energy  Fluence     90% Error
[keV]   [erg/cm2]   [erg/cm2]
15- 25  6.546e-08   3.830e-08
25- 50  1.259e-07   7.355e-08
50-150  2.761e-07   1.575e-07
15-150  4.675e-07   2.706e-07
Double BB

R1^2/D10^2  : 6.64208E-03        (      )
kT2 [keV]   : 200.000        (      )
R2^2/D10^2  : 1.40611E-05    (-6.9484e-06   8.32347e-05)
------------------------------------------------------------
#Fit statistic : Chi-Squared =          51.46 using 59 PHA bins.
#Fit statistic : Chi-Squared =          51.08 using 59 PHA bins.
#Fit statistic : Chi-Squared =          51.04 using 59 PHA bins.
# Reduced chi-squared =         0.9357 for     55 degrees of freedom
# Reduced chi-squared =         0.9288 for     55 degrees of freedom
# Reduced chi-squared =         0.9279 for     55 degrees of freedom
# Null hypothesis probability =   6.104929e-01
# Null hypothesis probability =   6.250560e-01
# Null hypothesis probability =   6.268246e-01

Energy  Fluence     90% Error
[keV]   [erg/cm2]   [erg/cm2]
15- 25  3.106e-08   1.886e-08
25- 50  1.167e-07   6.491e-08
50-150  5.306e-07   3.560e-07
15-150  6.784e-07   4.520e-07
Peak spectrum fit
Power-law model

Time interval is from    7.568 sec. to    8.568 sec.

Spectral model in power-law:
------------------------------------------------------------
Parameters  : value       lower 90%   higher 90%
Photon index: 0.737404     ( -0.673377   0.529493 )
Norm@50keV  : 3.75007E-03    ( -0.00122614   0.00109897 )
------------------------------------------------------------
#Fit statistic : Chi-Squared =          65.57 using 59 PHA bins.
# Reduced chi-squared =          1.150 for     57 degrees of freedom
# Null hypothesis probability =   2.040907e-01

Photon flux (15-150 keV)    in 1 sec: 0.432319 ( -0.123465  0.124209 ) ph/cm2/s
Energy fluence (15-150 keV)             : 4.50183e-08 ( -1.3043e-08  1.32135e-08 ) ergs/cm2
Cutoff power-law model

Time interval is from    7.568 sec. to    8.568 sec.
Spectral model in the cutoff power-law:
------------------------------------------------------------
Parameters  : value       lower 90%   higher 90%
Photon index: 0.756260     ( -1.00449   0.509823 )
Epeak [keV] : 9999.36      ( -9999.36 -9999.36 )
Norm@50keV  : 3.79992E-03    ( -0.00107537   0.00897402 )
------------------------------------------------------------
#Fit statistic : Chi-Squared =          65.59 using 59 PHA bins.
# Reduced chi-squared =          1.171 for     56 degrees of freedom
# Null hypothesis probability =   1.784844e-01

Photon flux (15-150 keV)    in 1 sec: 0.435038 ( -0.126457  0.121712 ) ph/cm2/s
Energy fluence (15-150 keV)             : 4.47605e-08 ( -1.27922e-08  1.29931e-08 ) ergs/cm2
Band function

Time interval is from    7.568 sec. to    8.568 sec.

Spectral model in the Band function:
------------------------------------------------------------
Parameters  : value       lower 90%   higher 90%
alpha       : -0.769431   ( 0.768729   0.768729 )
beta        : -0.737426    ( -0.528766   0.674051 )
Epeak [keV] : 17.3819      ( -17.3819 -17.3819 )
Norm@50keV   : 5.30968E-03    ( -0.00264437   92913.3 )
------------------------------------------------------------
#Fit statistic : Chi-Squared =          65.57 using 59 PHA bins.
# Reduced chi-squared =          1.192 for     55 degrees of freedom
# Null hypothesis probability =   1.557613e-01

Photon flux (15-150 keV)    in 1 sec:  (    ) ph/cm2/s
Energy fluence (15-150 keV)             : 0 ( 0  0 ) ergs/cm2
Single BB
Spectral model blackbody:
------------------------------------------------------------
Parameters  : value    Lower 90%  Upper 90%
kT [keV]    : 23.5084  (-9.64685  77.2831)
R^2/D10^2   : 1.24974E-02  (-0.012164   0.0531586)
(R is the radius in km and D10 is the distance to the source in units of 10 kpc)
------------------------------------------------------------
#Fit statistic : Chi-Squared =          70.46 using 59 PHA bins.
# Reduced chi-squared =          1.236 for     57 degrees of freedom
# Null hypothesis probability =   1.084546e-01

Energy  Fluence     90% Error
[keV]   [erg/cm2]   [erg/cm2]
15- 25  1.238e-09   7.700e-10
25- 50  6.800e-09   4.189e-09
50-150  2.804e-08   1.784e-08
15-150  3.608e-08   2.256e-08
Thermal bremsstrahlung (OTTB)
Spectral model: thermal bremsstrahlung
------------------------------------------------------------
Parameters  : value         Lower 90%    Upper 90%
kT [keV]    : 200.000       (      )
Norm        : 1.72962       (-0.512076     0.512057)
------------------------------------------------------------
#Fit statistic : Chi-Squared =          72.06 using 59 PHA bins.
# Reduced chi-squared =          1.264 for     57 degrees of freedom
# Null hypothesis probability =   8.631014e-02

Energy  Fluence     90% Error
[keV]   [erg/cm2]   [erg/cm2]
15- 25  4.306e-09   2.667e-09
25- 50  8.284e-09   4.884e-09
50-150  1.817e-08   1.110e-08
15-150  3.076e-08   1.940e-08
Double BB
Spectral model: bbodyrad<1> + bbodyrad<2>
------------------------------------------------------------
Parameters  : value         Lower 90%    Upper 90%
kT1 [keV]   : 11.7224        (-4.07345      4.40616)
R1^2/D10^2  : 7.89115E-02        (-0.0616795      0.127904)
kT2 [keV]   : 199.085        (-146.719      -199.19)
R2^2/D10^2  : 1.15053E-04    (-5.06104e-05   0.00107949)
------------------------------------------------------------
#Fit statistic : Chi-Squared =          62.16 using 59 PHA bins.
# Reduced chi-squared =          1.130 for     55 degrees of freedom
# Null hypothesis probability =   2.363740e-01

Energy  Fluence     90% Error
[keV]   [erg/cm2]   [erg/cm2]
15- 25  2.435e-09   1.510e-09
25- 50  8.253e-09   5.165e-09
50-150  3.610e-08   8.340e-09
15-150  4.679e-08   1.492e-08
Pre-slew spectrum (Pre-slew PHA with pre-slew DRM)
Power-law model
Spectral model in power-law:
------------------------------------------------------------
Parameters  : value       lower 90%   higher 90%
Photon index: 0.759667     ( -0.29397   0.270666 )
Norm@50keV  : 9.51354E-04    ( -0.00015243   0.000148313 )
------------------------------------------------------------
#Fit statistic : Chi-Squared =          47.85 using 59 PHA bins.
# Reduced chi-squared =         0.8394 for     57 degrees of freedom
# Null hypothesis probability =   8.008327e-01

Photon flux (15-150 keV)    in 49.3 sec: 0.109537 ( -0.0166045  0.016704 ) ph/cm2/s
Energy fluence (15-150 keV)             : 5.57598e-07 ( -8.56681e-08  8.62503e-08 ) ergs/cm2
Cutoff power-law model

Spectral model in the cutoff power-law:
------------------------------------------------------------
Parameters  : value       lower 90%   higher 90%
Photon index: 0.754408     ( -0.298231   0.271634 )
Epeak [keV] : 9999.36      ( -9999.36 -9999.36 )
Norm@50keV  : 9.58738E-04    ( -0.000143104   0.00196641 )
------------------------------------------------------------
#Fit statistic : Chi-Squared =          47.85 using 59 PHA bins.
# Reduced chi-squared =         0.8544 for     56 degrees of freedom
# Null hypothesis probability =   7.725517e-01

Photon flux (15-150 keV)    in 49.3 sec: 0.109552 ( -0.0167489  0.016636 ) ph/cm2/s
Energy fluence (15-150 keV)             : 5.57608e-07 ( -8.97768e-08  8.58609e-08 ) ergs/cm2
Band function

Spectral model in the Band function:
------------------------------------------------------------
Parameters  : value       lower 90%   higher 90%
alpha       : -0.899096   ( 0.899096   0.899096 )
beta        : -0.759666    ( -0.27038   0.29397 )
Epeak [keV] : 14.9054      ( -14.9054 -14.9054 )
Norm@50keV   : 1.36743E-03    ( -0.000560115   0 )
------------------------------------------------------------
#Fit statistic : Chi-Squared =          47.85 using 59 PHA bins.
# Reduced chi-squared =         0.8699 for     55 degrees of freedom
# Null hypothesis probability =   7.420542e-01

Photon flux (15-150 keV)    in 49.3 sec:  (    ) ph/cm2/s
Energy fluence (15-150 keV)             : 0 ( 0  0 ) ergs/cm2
S(25-50 keV) vs. S(50-100 keV) plot
S(25-50 keV)  = 1.05e-07
S(50-100 keV) = 2.48e-07
T90 vs. Hardness ratio plot
T90                                   = 96 sec.
Hardness ratio (energy fluence ratio) = 2.3619
Color vs. Color plot
Count Ratio  (25-50 keV) / (15-25 keV) = 2.42037
Count Ratio (50-100 keV) / (15-25 keV) = 2.58885
Mask shadow pattern
IMX = -1.993289069839686E-01, IMY = 1.440704497886629E-01
TIME vs. PHA plot around the trigger time

Blue+Cyan dotted lines: Time interval of the scaled map
From 0.000000 to 8.192000
TIME vs. DetID plot around the trigger time
Blue+Cyan dotted lines: Time interval of the scaled map
From 0.000000 to 8.192000
100 us light curve (15-350 keV)
Blue+Cyan dotted lines: Time interval of the scaled map
From 0.000000 to 8.192000
Spacecraft aspect plot

Bright source in the pre-burst/pre-slew/post-slew images
Pre-burst image of 15-350 keV band
Time interval of the image:
-239.432000 0.568000

# RAcent  DECcent POSerr Theta    Phi  PeakCts   SNR AngSep     Name
#  [deg]    [deg]    ['] [deg]  [deg]                   [']
181.4505  58.9865    3.0  24.8   54.4   0.9758   3.8 ------	UNKNOWN
140.4938  44.8723    2.3  12.2  149.0   0.9095   5.1 ------	UNKNOWN
355.3487  83.5961    2.1  38.6  -16.6   1.3707   5.4 ------	UNKNOWN
117.3398  11.0190    2.2  47.3 -166.9   1.9142   5.3 ------	UNKNOWN
 93.2845  15.9832    2.1  50.9 -135.5   4.8742   5.4 ------	UNKNOWN
Pre-slew background subtracted image of 15-350 keV band
Time interval of the image:
0.568000 49.868590

# RAcent  DECcent POSerr Theta    Phi  PeakCts   SNR AngSep     Name
#  [deg]    [deg]    ['] [deg]  [deg]                   [']
246.8004  80.7881    2.2  37.9    4.0   0.5830   5.1 ------	UNKNOWN
126.7086  19.3764    2.3  37.5 -178.0   0.5302   5.0 ------	UNKNOWN
124.7346  12.7020    2.3  44.4 -176.4   0.6993   5.0 ------	UNKNOWN
120.1282  45.8082    1.2  13.8 -144.1   0.7223   9.7 ------	UNKNOWN
115.0129  19.1274    2.6  40.0 -160.8   0.5259   4.5 ------	UNKNOWN
Post-slew image of 15-350 keV band
Time interval of the image:
84.668630 962.601200

# RAcent  DECcent POSerr Theta    Phi  PeakCts   SNR AngSep     Name
#  [deg]    [deg]    ['] [deg]  [deg]                   [']
 83.6352  22.0096    0.4  38.0 -111.0  35.7939  31.0    0.3	Crab
166.2062  33.8733    3.1  36.7   97.7   4.9511   3.7 ------	UNKNOWN
107.6355  -6.0997    2.6  53.1 -159.1   5.8764   4.5 ------	UNKNOWN
  6.9135  67.3928    3.1  56.2  -19.9   7.0864   3.7 ------	UNKNOWN
Plot creation:
Sat May 30 22:14:58 EDT 2015