Click here for the BAT GCN circular template
Image
Pre-slew 15.0-350.0 keV image (Event data)

#   RAcent    DECcent   POSerr    Theta     Phi              Peak Cts       SNR   Name
  282.0313    61.9277   0.0166    15.9611   -38.3848         1.0502762     11.512 TRIG_00454473

Foreground time interval of the image:
-48.864  17.376 (delta_t =  66.240 [sec])
Background time interval of the image:
-234.795 -48.864 (delta_t = 185.931 [sec])
Lightcurves
Notes:
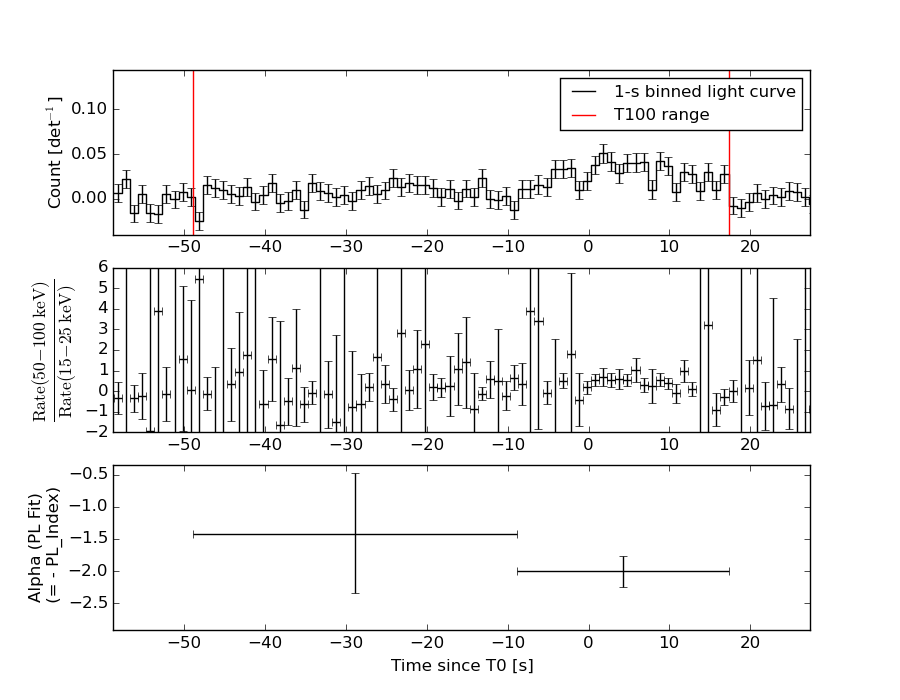
- 1) The mask-weighted light curves are using the flight position.
- 2) Multiple plots of different time binning/intervals are shown to cover all scenarios of short/long GRBs, rate/image triggers, and real/false positives.
- 3) For all the mask-weighted lightcurves, the y-axis units are counts/sec/det where a det is 0.4 x 0.4 = 0.16 sq cm.
- 4) The verticle lines correspond to following: green dotted lines are T50 interval, black dotted lines are T90 interval, blue solid line(s) is a spacecraft slew start time, and orange solid line(s) is a spacecraft slew end time.
- 5) Time of each bin is in the middle of the bin.
1 s binning
From T0-310 s to T0+310 s
From T100_start - 20 s to T100_end + 30 s
Full time interval
64 ms binning
Full time interval

From T100_start to T100_end
From T0-5 sec to T0+5 sec
16 ms binning
From T100_start-5 s to T100_start+5 s

Blue+Cyan dotted lines: Time interval of the scaled map
From 0.000000 to 8.192000
8 ms binning
From T100_start-3 s to T100_start+3 s
Blue+Cyan dotted lines: Time interval of the scaled map
From 0.000000 to 8.192000
2 ms binning
From T100_start-1 s to T100_start+1 s

Blue+Cyan dotted lines: Time interval of the scaled map
From 0.000000 to 8.192000
SN=5 or 10 sec. binning (whichever binning is satisfied first)
SN=5 or 10 sec. binning (T < 200 sec)
Quad-rate summed light curves (from T0-300s to T0+1000s)
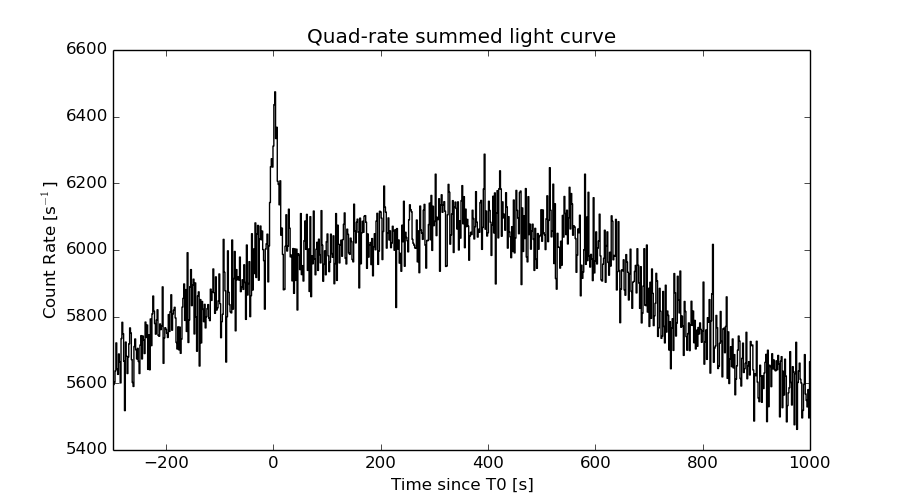
The mask-weighted light curves based on cleaned DPHs

Spectral Evolution
Spectra
Notes:
- 1) The fitting includes the systematic errors.
- 2) When the burst includes telescope slew time periods, the fitting uses an average response file made from multiple 5-s response files through out the slew time plus single time preiod for the non-slew times, and weighted by the total counts in the corresponding time period using addrmf. An average response file is needed becuase a spectral fit using the pre-slew DRM will introduce some errors in both a spectral shape and a normalization if the PHA file contains a lot of the slew/post-slew time interval.
- 3) For fits to more complicated models (e.g. a power-law over a cutoff power-law), the BAT team has decided to require a chi-square improvement of more than 6 for each extra dof.
Time averaged spectrum fit using the average DRM
Power-law model

Time interval is from  -48.864 sec. to   17.376 sec.

Spectral model in power-law:
------------------------------------------------------------
Parameters  : value       lower 90%   higher 90%
Photon index: 1.86893     ( -0.268998   0.287469 )
Norm@50keV  : 7.96516E-04    ( -0.00014629   0.000140808 )
------------------------------------------------------------
#Fit statistic : Chi-Squared =          60.71 using 59 PHA bins.
# Reduced chi-squared =          1.065 for     57 degrees of freedom
# Null hypothesis probability =   3.435935e-01

Photon flux (15-150 keV)    in 66.24 sec: 0.112830 ( -0.0156716  0.0156715 ) ph/cm2/s
Energy fluence (15-150 keV)             : 4.85044e-07 ( -8.59583e-08  8.91981e-08 ) ergs/cm2
Cutoff power-law model

Time interval is from  -48.864 sec. to   17.376 sec.
Spectral model in the cutoff power-law:
------------------------------------------------------------
Parameters  : value       lower 90%   higher 90%
Photon index: 1.87225     ( -0.836863   1.1437 )
Epeak [keV] : 852.931      (   )
Norm@50keV  : 7.91467E-04    (     )
------------------------------------------------------------
#Fit statistic : Chi-Squared =          60.71 using 59 PHA bins.
# Reduced chi-squared =          1.084 for     56 degrees of freedom
# Null hypothesis probability =   3.098905e-01

Photon flux (15-150 keV)    in 66.24 sec: 0.112781 ( -0.0156661  0.015669 ) ph/cm2/s
Energy fluence (15-150 keV)             : 4.83066e-07 ( -9.12893e-08  8.93207e-08 ) ergs/cm2
Band function

Time interval is from  -48.864 sec. to   17.376 sec.

Spectral model in the Band function:
------------------------------------------------------------
Parameters  : value       lower 90%   higher 90%
alpha       : 4.80645   ( -4.80645   -4.80645 )
beta        : -1.91313    ( -0.327335   0.288026 )
Epeak [keV] : 18.8388      ( -18.8388 6.34125 )
Norm@50keV   : 505.577    ( -70.142   963548 )
------------------------------------------------------------
#Fit statistic : Chi-Squared =          60.40 using 59 PHA bins.
# Reduced chi-squared =          1.098 for     55 degrees of freedom
# Null hypothesis probability =   2.871790e-01

Photon flux (15-150 keV)    in 66.24 sec:  (    ) ph/cm2/s
Energy fluence (15-150 keV)             : 0 ( 0  0 ) ergs/cm2
Single BB
Spectral model blackbody:
------------------------------------------------------------
Parameters  : value    Lower 90%  Upper 90%
kT [keV]    : 9.38139  (-1.61896  2.04274)
R^2/D10^2   : 6.52294E-02  (-0.0340915   0.0691016)
(R is the radius in km and D10 is the distance to the source in units of 10 kpc)
------------------------------------------------------------
#Fit statistic : Chi-Squared =          76.23 using 59 PHA bins.
# Reduced chi-squared =          1.337 for     57 degrees of freedom
# Null hypothesis probability =   4.531644e-02

Energy  Fluence     90% Error
[keV]   [erg/cm2]   [erg/cm2]
15- 25  7.553e-08   1.833e-08
25- 50  1.711e-07   3.474e-08
50-150  7.400e-08   2.994e-08
15-150  3.206e-07   7.038e-08
Thermal bremsstrahlung (OTTB)
Spectral model: thermal bremsstrahlung
------------------------------------------------------------
Parameters  : value         Lower 90%    Upper 90%
kT [keV]    : 84.4232       (-35.1851      93.4714)
Norm        : 0.518046       (-0.100205     0.137647)
------------------------------------------------------------
#Fit statistic : Chi-Squared =          62.29 using 59 PHA bins.
# Reduced chi-squared =          1.093 for     57 degrees of freedom
# Null hypothesis probability =   2.934420e-01

Energy  Fluence     90% Error
[keV]   [erg/cm2]   [erg/cm2]
15- 25  8.931e-08   1.586e-08
25- 50  1.489e-07   2.785e-08
50-150  2.178e-07   1.296e-07
15-150  4.560e-07   1.546e-07
Double BB
Spectral model: bbodyrad<1> + bbodyrad<2>
------------------------------------------------------------
Parameters  : value         Lower 90%    Upper 90%
kT1 [keV]   : 5.40581        (-2.32928      2.51714)
R1^2/D10^2  : 0.391064        (-0.159597      0.749618)
kT2 [keV]   : 22.6227        (-14.6494      111.292)
R2^2/D10^2  : 1.72723E-03    (-0.000581957   0.00496029)
------------------------------------------------------------
#Fit statistic : Chi-Squared =          61.71 using 59 PHA bins.
# Reduced chi-squared =          1.122 for     55 degrees of freedom
# Null hypothesis probability =   2.488482e-01

Energy  Fluence     90% Error
[keV]   [erg/cm2]   [erg/cm2]
15- 25  9.592e-08   5.597e-08
25- 50  1.246e-07   6.929e-08
50-150  2.238e-07   1.404e-07
15-150  4.443e-07   2.458e-07
Peak spectrum fit
Power-law model

Time interval is from    1.028 sec. to    2.028 sec.

Spectral model in power-law:
------------------------------------------------------------
Parameters  : value       lower 90%   higher 90%
Photon index: 1.25195     ( -0.584744   0.574446 )
Norm@50keV  : 3.65199E-03    ( -0.00105236   0.00104891 )
------------------------------------------------------------
#Fit statistic : Chi-Squared =          50.35 using 59 PHA bins.
# Reduced chi-squared =         0.8832 for     57 degrees of freedom
# Null hypothesis probability =   7.211345e-01

Photon flux (15-150 keV)    in 1 sec: 0.432066 ( -0.127054  0.127565 ) ph/cm2/s
Energy fluence (15-150 keV)             : 3.65305e-08 ( -1.19225e-08  1.22308e-08 ) ergs/cm2
Cutoff power-law model
Time interval is from    1.028 sec. to    2.028 sec.
Spectral model in the cutoff power-law:
------------------------------------------------------------
Parameters  : value       lower 90%   higher 90%
Photon index: 1.25027     ( -1.24389   0.57652 )
Epeak [keV] : 9999.35      ( -9999.36 -9999.36 )
Norm@50keV  : 3.66751E-03    ( -0.00105854   0.0148699 )
------------------------------------------------------------
#Fit statistic : Chi-Squared =          50.35 using 59 PHA bins.
# Reduced chi-squared =         0.8991 for     56 degrees of freedom
# Null hypothesis probability =   6.877685e-01

Photon flux (15-150 keV)    in 1 sec: 0.433082 ( -0.12868  0.126432 ) ph/cm2/s
Energy fluence (15-150 keV)             : 3.65959e-08 ( -1.19981e-08  1.20211e-08 ) ergs/cm2
Band function
Time interval is from    1.028 sec. to    2.028 sec.

Spectral model in the Band function:
------------------------------------------------------------
Parameters  : value       lower 90%   higher 90%
alpha       : -3.89981   ( 3.98509   3.89981 )
beta        : -1.25191    ( -0.574533   0.585595 )
Epeak [keV] : 627.111      ( -627.111 -627.111 )
Norm@50keV   : 0.496357    ( -0.143102   0.142562 )
------------------------------------------------------------
#Fit statistic : Chi-Squared =          50.35 using 59 PHA bins.
# Reduced chi-squared =         0.9154 for     55 degrees of freedom
# Null hypothesis probability =   6.528098e-01

Photon flux (15-150 keV)    in 1 sec:  (    ) ph/cm2/s
Energy fluence (15-150 keV)             : 0 ( 0  0 ) ergs/cm2
Single BB
Spectral model blackbody:
------------------------------------------------------------
Parameters  : value    Lower 90%  Upper 90%
kT [keV]    : 23.0123  (-8.67191  15.3597)
R^2/D10^2   : 1.22183E-02  (-0.0121874   0.0431315)
(R is the radius in km and D10 is the distance to the source in units of 10 kpc)
------------------------------------------------------------
#Fit statistic : Chi-Squared =          54.58 using 59 PHA bins.
# Reduced chi-squared =         0.9575 for     57 degrees of freedom
# Null hypothesis probability =   5.664889e-01

Energy  Fluence     90% Error
[keV]   [erg/cm2]   [erg/cm2]
15- 25  1.172e-09   7.620e-10
25- 50  6.362e-09   3.934e-09
50-150  2.517e-08   1.602e-08
15-150  3.270e-08   2.063e-08
Thermal bremsstrahlung (OTTB)
Spectral model: thermal bremsstrahlung
------------------------------------------------------------
Parameters  : value         Lower 90%    Upper 90%
kT [keV]    : 199.359       (-114.378      -199.362)
Norm        : 1.77325       (-0.517182     0.518462)
------------------------------------------------------------
#Fit statistic : Chi-Squared =          51.53 using 59 PHA bins.
# Reduced chi-squared =         0.9040 for     57 degrees of freedom
# Null hypothesis probability =   6.796505e-01

Energy  Fluence     90% Error
[keV]   [erg/cm2]   [erg/cm2]
15- 25  4.415e-09   2.759e-09
25- 50  8.494e-09   5.225e-09
50-150  1.863e-08   1.129e-08
15-150  3.154e-08   1.934e-08
Double BB
Spectral model: bbodyrad<1> + bbodyrad<2>
------------------------------------------------------------
Parameters  : value         Lower 90%    Upper 90%
kT1 [keV]   : 5.36259        (-3.48026      4.48074)
R1^2/D10^2  : 1.24163        (-1.13241      314.021)
kT2 [keV]   : 32.9866        (-13.3787      58.2439)
R2^2/D10^2  : 3.64568E-03    (-0.00331148   0.00688708)
------------------------------------------------------------
#Fit statistic : Chi-Squared =          48.72 using 59 PHA bins.
# Reduced chi-squared =         0.8858 for     55 degrees of freedom
# Null hypothesis probability =   7.118595e-01

Energy  Fluence     90% Error
[keV]   [erg/cm2]   [erg/cm2]
15- 25  4.548e-09   2.869e-09
25- 50  6.805e-09   3.649e-09
50-150  2.771e-08   1.742e-08
15-150  3.906e-08   2.187e-08
Pre-slew spectrum (Pre-slew PHA with pre-slew DRM)
Power-law model

Spectral model in power-law:
------------------------------------------------------------
Parameters  : value       lower 90%   higher 90%
Photon index: 1.86893     ( -0.268998   0.287469 )
Norm@50keV  : 7.96516E-04    ( -0.00014629   0.000140808 )
------------------------------------------------------------
#Fit statistic : Chi-Squared =          60.71 using 59 PHA bins.
# Reduced chi-squared =          1.065 for     57 degrees of freedom
# Null hypothesis probability =   3.435935e-01

Photon flux (15-150 keV)    in 66.24 sec: 0.112830 ( -0.0156716  0.0156715 ) ph/cm2/s
Energy fluence (15-150 keV)             : 4.85044e-07 ( -8.59583e-08  8.91981e-08 ) ergs/cm2
Cutoff power-law model
Spectral model in the cutoff power-law:
------------------------------------------------------------
Parameters  : value       lower 90%   higher 90%
Photon index: 1.87225     ( -0.836863   1.1437 )
Epeak [keV] : 852.931      (   )
Norm@50keV  : 7.91467E-04    (     )
------------------------------------------------------------
#Fit statistic : Chi-Squared =          60.71 using 59 PHA bins.
# Reduced chi-squared =          1.084 for     56 degrees of freedom
# Null hypothesis probability =   3.098905e-01

Photon flux (15-150 keV)    in 66.24 sec: 0.112781 ( -0.0156661  0.015669 ) ph/cm2/s
Energy fluence (15-150 keV)             : 4.83066e-07 ( -9.12893e-08  8.93207e-08 ) ergs/cm2
Band function

Spectral model in the Band function:
------------------------------------------------------------
Parameters  : value       lower 90%   higher 90%
alpha       : 4.80645   ( -4.80645   -4.80645 )
beta        : -1.91313    ( -0.327335   0.288026 )
Epeak [keV] : 18.8388      ( -18.8388 6.34125 )
Norm@50keV   : 505.577    ( -70.142   963548 )
------------------------------------------------------------
#Fit statistic : Chi-Squared =          60.40 using 59 PHA bins.
# Reduced chi-squared =          1.098 for     55 degrees of freedom
# Null hypothesis probability =   2.871790e-01

Photon flux (15-150 keV)    in 66.24 sec:  (    ) ph/cm2/s
Energy fluence (15-150 keV)             : 0 ( 0  0 ) ergs/cm2
S(25-50 keV) vs. S(50-100 keV) plot

S(25-50 keV)  = 1.40e-07
S(50-100 keV) = 1.53e-07
T90 vs. Hardness ratio plot
T90                                   = 55.7280000448227 sec.
Hardness ratio (energy fluence ratio) = 1.09286
Color vs. Color plot
Count Ratio  (25-50 keV) / (15-25 keV) = 1.1362
Count Ratio (50-100 keV) / (15-25 keV) = 0.598002
Mask shadow pattern

IMX = 2.241918560127483E-01, IMY = 1.775956978590825E-01
TIME vs. PHA plot around the trigger time

Blue+Cyan dotted lines: Time interval of the scaled map
From 0.000000 to 8.192000
TIME vs. DetID plot around the trigger time
Blue+Cyan dotted lines: Time interval of the scaled map
From 0.000000 to 8.192000
100 us light curve (15-350 keV)

Blue+Cyan dotted lines: Time interval of the scaled map
From 0.000000 to 8.192000
Spacecraft aspect plot
Bright source in the pre-burst/pre-slew/post-slew images
Pre-burst image of 15-350 keV band
Time interval of the image:
-234.795400 -48.864000

# RAcent  DECcent POSerr Theta    Phi  PeakCts   SNR AngSep     Name
#  [deg]    [deg]    ['] [deg]  [deg]                   [']
254.4688  35.4925    9.3  22.2   73.3   0.2514   1.2    9.0	Her X-1
299.5766  35.1908    0.7  39.0    4.1   4.2328  16.6    0.9	Cyg X-1
308.0822  40.9489    3.1  39.2   -9.9   0.8910   3.7    1.3	Cyg X-3
326.2625  38.5218    0.0  50.7  -21.8  -0.2783  -0.7   12.7	Cyg X-2
229.4101  21.3184    3.0  39.6  113.3   2.5035   3.8 ------	UNKNOWN
186.5151  49.1619    2.4  38.0 -173.6   1.1739   4.8 ------	UNKNOWN
307.9839  37.5681    2.5  41.6   -6.2   1.2557   4.7 ------	UNKNOWN
159.2817  46.5741    4.2  53.1 -158.8   1.2844   2.8 ------	UNKNOWN
344.3127  50.6594    3.1  50.6  -44.7   3.1240   3.7 ------	UNKNOWN
Pre-slew background subtracted image of 15-350 keV band
Time interval of the image:
-48.864000 17.376000

# RAcent  DECcent POSerr Theta    Phi  PeakCts   SNR AngSep     Name
#  [deg]    [deg]    ['] [deg]  [deg]                   [']
254.4343  35.3444   69.7  22.3   73.5   0.0202   0.2    1.1	Her X-1
299.6110  35.0193    7.6  39.1    4.2  -0.2309  -1.5   11.0	Cyg X-1
308.1278  41.1507    0.0  39.1  -10.2  -0.3043  -2.2   11.9	Cyg X-3
326.3078  38.3148    5.5  50.8  -21.7  -0.4846  -2.1    6.4	Cyg X-2
260.5288  24.8397    2.3  33.4   64.9   1.0474   5.1 ------	UNKNOWN
297.3678  18.3983    2.4  51.8   19.8   1.9218   4.8 ------	UNKNOWN
282.0312  61.9277    1.0  16.0  -38.4   1.0504  11.5 ------	UNKNOWN
316.5259  38.4889    2.6  45.5  -14.3   0.7585   4.5 ------	UNKNOWN
146.8463  64.5937    2.1  45.2 -135.5   1.2421   5.6 ------	UNKNOWN
Post-slew image of 15-350 keV band
Time interval of the image:
417.904620 962.437300

# RAcent  DECcent POSerr Theta    Phi  PeakCts   SNR AngSep     Name
#  [deg]    [deg]    ['] [deg]  [deg]                   [']
254.4696  35.3290   18.8  31.7  104.0   0.4588   0.6    1.0	Her X-1
299.5756  35.1851    0.5  28.9   27.5  10.8137  24.2    1.2	Cyg X-1
308.0802  40.9418    1.4  26.2    9.3   3.1863   8.0    1.5	Cyg X-3
326.2086  38.3033   10.9  35.7  -11.3   0.5115   1.0    2.1	Cyg X-2
195.0475  39.8459    2.5  54.3  167.3   8.7778   4.7 ------	UNKNOWN
249.8494  55.3593    3.4  17.8  141.1   1.4152   3.4 ------	UNKNOWN
326.9327  40.7509    2.9  34.0  -14.6   1.8236   3.9 ------	UNKNOWN
141.4894  59.0790    3.5  55.2 -145.3  12.3317   3.4 ------	UNKNOWN
140.7748  59.2445    7.2  55.2 -144.8   5.6084   1.7 ------	UNKNOWN
Plot creation:
Sat May 30 22:13:19 EDT 2015