Special notes of this burst
Image
Pre-slew 15.0-350.0 keV image (Event data; DETECTION mask)
#   RAcent    DECcent   POSerr    Theta     Phi              Peak Cts       SNR   Name
  286.7457     6.7574   0.0083    41.8603    60.1205        13.2926606     23.198 TRIG_00456073

Foreground time interval of the image:
 -6.384  12.181 (delta_t =  18.565 [sec])
Background time interval of the image:
-239.520  -6.384 (delta_t = 233.136 [sec])
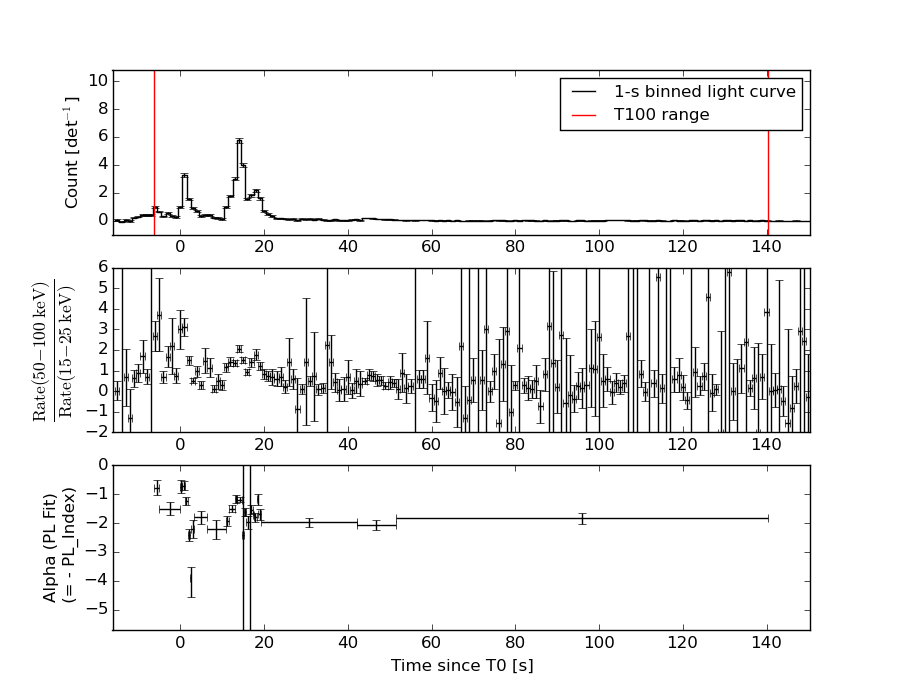
Lightcurves
Notes:
- 1) All plots contain as much data as has been downloaded to date.
- 2) The mask-weighted light curves are using the flight position.
- 3) Multiple plots of different time binning/intervals are shown to cover all scenarios of short/long GRBs, rate/image triggers, and real/false positives.
- 4) For all the mask-weighted lightcurves, the y-axis units are counts/sec/det where a det is 0.4 x 0.4 = 0.16 sq cm.
- 5) The verticle lines correspond to following: green dotted lines are T50 interval, black dotted lines are T90 interval, blue solid line(s) is a spacecraft slew start time, and orange solid line(s) is a spacecraft slew end time.
- 6) Time of each bin is in the middle of the bin.
1 s binning
From T0-310 s to T0+310 s
From T100_start - 20 s to T100_end + 30 s
Full time interval
64 ms binning
Full time interval
From T100_start to T100_end
From T0-5 sec to T0+5 sec

16 ms binning
From T100_start-5 s to T100_start+5 s
Blue+Cyan dotted lines: Time interval of the scaled map
From 0.000000 to 1.024000
8 ms binning
From T100_start-3 s to T100_start+3 s

Blue+Cyan dotted lines: Time interval of the scaled map
From 0.000000 to 1.024000
2 ms binning
From T100_start-1 s to T100_start+1 s
Blue+Cyan dotted lines: Time interval of the scaled map
From 0.000000 to 1.024000
SN=5 or 10 sec. binning (whichever binning is satisfied first)
SN=5 or 10 sec. binning (T < 200 sec)
Quad-rate summed light curves (from T0-300s to T0+1000s)

The mask-weighted light curves based on cleaned DPHs

Spectral Evolution
Spectra
Notes:
- 1) The fitting includes the systematic errors.
- 2) For long bursts, a spectral fit of the pre-slew DRM will introduce some errors in both a spectral shape and a normalization if the PHA file contains a lot of the slew/post-slew time interval.
- 3) For fits to more complicated models (e.g. a power-law over a cutoff power-law), the BAT team has decided to require a chi-square improvement of more than 6 for each extra dof.
- 4) For short bursts (T90<1sec), the specrtum is also fit with Blackbody, OTTB, and Double Blackbody.
Time averaged spectrum fit using the pre-slew DRM
Power-law model
Time interval is from   -6.188 sec. to  140.344 sec.

Spectral model in power-law:
------------------------------------------------------------
Parameters  : value       lower 90%   higher 90%
Photon index: 1.43236     ( -0.0437598   0.0437445 )
Norm@50keV  : 1.99948E-02    ( -0.000473491   0.000473325 )
------------------------------------------------------------
#Fit statistic : Chi-Squared =          47.48 using 59 PHA bins.
# Reduced chi-squared =         0.8330 for     57 degrees of freedom
# Null hypothesis probability =   8.114154e-01

Photon flux (15-150 keV)    in 146.5 sec: 2.45348 ( -0.0656492  0.0658605 ) ph/cm2/s
Energy fluence (15-150 keV)             : 2.81236e-05 ( -6.8472e-07  6.85106e-07 ) ergs/cm2
Cutoff power-law model
Time interval is from   -6.188 sec. to  140.344 sec.
Spectral model in the cutoff power-law:
------------------------------------------------------------
Parameters  : value       lower 90%   higher 90%
Photon index: 1.26851     ( -0.178912   0.0819678 )
Epeak [keV] : 260.481      ( -105.284 -260.486 )
Norm@50keV  : 2.35610E-02    ( -0.00315348   0.00449237 )
------------------------------------------------------------
#Fit statistic : Chi-Squared =          44.86 using 59 PHA bins.
# Reduced chi-squared =         0.8011 for     56 degrees of freedom
# Null hypothesis probability =   8.570990e-01

Photon flux (15-150 keV)    in 146.5 sec: 2.42389 ( -0.07176  0.07214 ) ph/cm2/s
Energy fluence (15-150 keV)             : 2.79248e-05 ( -7.25175e-07  7.21805e-07 ) ergs/cm2
Band function
Time interval is from   -6.188 sec. to  140.344 sec.

Spectral model in the Band function:
------------------------------------------------------------
Parameters  : value       lower 90%   higher 90%
alpha       : -1.03359   ( -0.399145   3.28202 )
beta        : -1.50163    ( 1.50063   0.0799729 )
Epeak [keV] : 108.124      ( -61.4134 759.799 )
Norm@50keV   : 3.22129E-02    ( -0.0113478   2.36222 )
------------------------------------------------------------
#Fit statistic : Chi-Squared =          44.35 using 59 PHA bins.
# Reduced chi-squared =         0.8063 for     55 degrees of freedom
# Null hypothesis probability =   8.473501e-01

Photon flux (15-150 keV)    in 146.5 sec:  (    ) ph/cm2/s
Energy fluence (15-150 keV)             : 0 ( 0  0 ) ergs/cm2
Single BB
Spectral model blackbody:
------------------------------------------------------------
Parameters  : value    Lower 90%  Upper 90%
kT [keV]    : 18.3305  (  )
R^2/D10^2   : 0.138196  (   )
(R is the radius in km and D10 is the distance to the source in units of 10 kpc)
------------------------------------------------------------
#Fit statistic : Chi-Squared =         414.22 using 59 PHA bins.
# Reduced chi-squared =         7.2669 for     57 degrees of freedom
# Null hypothesis probability =   1.128342e-55

Energy  Fluence     90% Error
[keV]   [erg/cm2]   [erg/cm2]
15- 25  1.354e-06   6.549e-08
25- 50  6.347e-06   2.300e-07
50-150  1.555e-05   6.226e-07
15-150  2.325e-05   6.153e-07
Thermal bremsstrahlung (OTTB)
Spectral model: thermal bremsstrahlung
------------------------------------------------------------
Parameters  : value         Lower 90%    Upper 90%
kT [keV]    : 200.000       (-4.13226      -200)
Norm        : 10.2708       (-0.243048     0.243048)
------------------------------------------------------------
#Fit statistic : Chi-Squared =          85.70 using 59 PHA bins.
# Reduced chi-squared =          1.504 for     57 degrees of freedom
# Null hypothesis probability =   8.282593e-03

Energy  Fluence     90% Error
[keV]   [erg/cm2]   [erg/cm2]
15- 25  3.748e-06   9.816e-08
25- 50  7.210e-06   1.970e-07
50-150  1.581e-05   4.322e-07
15-150  2.677e-05   7.178e-07
Double BB
Spectral model: bbodyrad<1> + bbodyrad<2>
------------------------------------------------------------
Parameters  : value         Lower 90%    Upper 90%
kT1 [keV]   : 8.25023        (-0.795627      0.841235)
R1^2/D10^2  : 1.34261        (-0.358714      0.543725)
kT2 [keV]   : 31.3216        (-2.82831      3.73352)
R2^2/D10^2  : 1.77238E-02    (-0.00574939   0.0071883)
------------------------------------------------------------
#Fit statistic : Chi-Squared =          57.63 using 59 PHA bins.
# Reduced chi-squared =          1.048 for     55 degrees of freedom
# Null hypothesis probability =   3.782185e-01

Energy  Fluence     90% Error
[keV]   [erg/cm2]   [erg/cm2]
15- 25  2.863e-06   2.256e-07
25- 50  7.001e-06   3.384e-07
50-150  1.789e-05   9.596e-07
15-150  2.776e-05   1.502e-06
Peak spectrum fit
Power-law model
Time interval is from   13.740 sec. to   14.740 sec.

Spectral model in power-law:
------------------------------------------------------------
Parameters  : value       lower 90%   higher 90%
Photon index: 1.20922     ( -0.0766503   0.0767445 )
Norm@50keV  : 0.421255    ( -0.0199733   0.0199733 )
------------------------------------------------------------
#Fit statistic : Chi-Squared =          59.33 using 59 PHA bins.
# Reduced chi-squared =          1.041 for     57 degrees of freedom
# Null hypothesis probability =   3.907679e-01

Photon flux (15-150 keV)    in 1 sec: 49.5118 ( -2.41458  2.41633 ) ph/cm2/s
Energy fluence (15-150 keV)             : 4.26276e-06 ( -2.20747e-07  2.21127e-07 ) ergs/cm2
Cutoff power-law model
Time interval is from   13.740 sec. to   14.740 sec.
Spectral model in the cutoff power-law:
------------------------------------------------------------
Parameters  : value       lower 90%   higher 90%
Photon index: 0.540157     ( -0.354567   0.32962 )
Epeak [keV] : 124.207      ( -24.7781 63.9589 )
Norm@50keV  : 0.850392    ( -0.243235   0.368535 )
------------------------------------------------------------
#Fit statistic : Chi-Squared =          46.52 using 59 PHA bins.
# Reduced chi-squared =         0.8307 for     56 degrees of freedom
# Null hypothesis probability =   8.127402e-01

Photon flux (15-150 keV)    in 1 sec: 48.6058 ( -2.4498  2.4532 ) ph/cm2/s
Energy fluence (15-150 keV)             : 4.1944e-06 ( 0  0 ) ergs/cm2
Band function
Time interval is from   13.740 sec. to   14.740 sec.

Spectral model in the Band function:
------------------------------------------------------------
Parameters  : value       lower 90%   higher 90%
alpha       : -0.546603   ( -0.322354   0.258019 )
beta        : -9.37163    ( 9.37167   19.3717 )
Epeak [keV] : 125.055      ( -15.3575 62.3139 )
Norm@50keV   : 0.843900    ( -0.202772   0.154467 )
------------------------------------------------------------
#Fit statistic : Chi-Squared =          46.52 using 59 PHA bins.
# Reduced chi-squared =         0.8458 for     55 degrees of freedom
# Null hypothesis probability =   7.851368e-01

Photon flux (15-150 keV)    in 1 sec:  (    ) ph/cm2/s
Energy fluence (15-150 keV)             : 0 ( 0  0 ) ergs/cm2
Single BB
Spectral model blackbody:
------------------------------------------------------------
Parameters  : value    Lower 90%  Upper 90%
kT [keV]    : 19.3897  (-1.09586  1.16958)
R^2/D10^2   : 2.64756  (-0.466127   0.558893)
(R is the radius in km and D10 is the distance to the source in units of 10 kpc)
------------------------------------------------------------
#Fit statistic : Chi-Squared =         104.76 using 59 PHA bins.
# Reduced chi-squared =         1.8379 for     57 degrees of freedom
# Null hypothesis probability =   1.193453e-04

Energy  Fluence     90% Error
[keV]   [erg/cm2]   [erg/cm2]
15- 25  1.942e-07   1.735e-08
25- 50  9.473e-07   6.330e-08
50-150  2.627e-06   2.030e-07
15-150  3.769e-06   2.115e-07
Thermal bremsstrahlung (OTTB)
Spectral model: thermal bremsstrahlung
------------------------------------------------------------
Parameters  : value         Lower 90%    Upper 90%
kT [keV]    : 200.000       (-6.91628      -200)
Norm        : 204.875       (-9.91828     9.91828)
------------------------------------------------------------
#Fit statistic : Chi-Squared =         108.05 using 59 PHA bins.
# Reduced chi-squared =         1.8957 for     57 degrees of freedom
# Null hypothesis probability =   5.234972e-05

Energy  Fluence     90% Error
[keV]   [erg/cm2]   [erg/cm2]
15- 25  5.101e-07   2.705e-08
25- 50  9.812e-07   5.400e-08
50-150  2.152e-06   1.210e-07
15-150  3.643e-06   2.075e-07
Double BB

Spectral model: bbodyrad<1> + bbodyrad<2>
------------------------------------------------------------
Parameters  : value         Lower 90%    Upper 90%
kT1 [keV]   : 7.85284        (-1.83682      2.33255)
R1^2/D10^2  : 23.4321        (-12.0002      31.7977)
kT2 [keV]   : 27.3510        (-3.45265      6.05016)
R2^2/D10^2  : 0.701290    (-0.371328   0.463777)
------------------------------------------------------------
#Fit statistic : Chi-Squared =          47.69 using 59 PHA bins.
# Reduced chi-squared =         0.8670 for     55 degrees of freedom
# Null hypothesis probability =   7.475023e-01

Energy  Fluence     90% Error
[keV]   [erg/cm2]   [erg/cm2]
15- 25  3.443e-07   9.700e-08
25- 50  9.503e-07   1.398e-07
50-150  2.907e-06   5.085e-07
15-150  4.201e-06   6.950e-07
Pre-slew spectrum (Pre-slew PHA with pre-slew DRM)
Power-law model

Spectral model in power-law:
------------------------------------------------------------
Parameters  : value       lower 90%   higher 90%
Photon index: 1.31317     ( -0.0710163   0.0709116 )
Norm@50keV  : 5.53507E-02    ( -0.00214383   0.00214289 )
------------------------------------------------------------
#Fit statistic : Chi-Squared =          54.57 using 59 PHA bins.
# Reduced chi-squared =         0.9574 for     57 degrees of freedom
# Null hypothesis probability =   5.666809e-01

Photon flux (15-150 keV)    in 18.37 sec: 6.61977 ( -0.277481  0.278579 ) ph/cm2/s
Energy fluence (15-150 keV)             : 1.00159e-05 ( -4.10645e-07  4.11488e-07 ) ergs/cm2
Cutoff power-law model
Spectral model in the cutoff power-law:
------------------------------------------------------------
Parameters  : value       lower 90%   higher 90%
Photon index: 1.30913     ( -0.248948   0.176993 )
Epeak [keV] : 9997.89      ( -9997.79 -9997.79 )
Norm@50keV  : 5.55797E-02    ( -0.00214933   0.018898 )
------------------------------------------------------------
#Fit statistic : Chi-Squared =          54.57 using 59 PHA bins.
# Reduced chi-squared =         0.9744 for     56 degrees of freedom
# Null hypothesis probability =   5.292651e-01

Photon flux (15-150 keV)    in 18.37 sec: 6.60229 ( -0.29031  0.29504 ) ph/cm2/s
Energy fluence (15-150 keV)             : 9.99712e-06 ( -4.15033e-07  4.35902e-07 ) ergs/cm2
Band function

Spectral model in the Band function:
------------------------------------------------------------
Parameters  : value       lower 90%   higher 90%
alpha       : -1.05564   ( 1.05564   1.05564 )
beta        : -1.31317    ( -0.0709211   0.0710349 )
Epeak [keV] : 40.0427      ( -40.0427 -40.0427 )
Norm@50keV   : 0.105957    ( -0.0404858   4122.35 )
------------------------------------------------------------
#Fit statistic : Chi-Squared =          54.57 using 59 PHA bins.
# Reduced chi-squared =         0.9922 for     55 degrees of freedom
# Null hypothesis probability =   4.908991e-01

Photon flux (15-150 keV)    in 18.37 sec:  (    ) ph/cm2/s
Energy fluence (15-150 keV)             : 0 ( 0  0 ) ergs/cm2
S(25-50 keV) vs. S(50-100 keV) plot
S(25-50 keV)  = 6.72e-06
S(50-100 keV) = 9.96e-06
T90 vs. Hardness ratio plot
T90                                   = 42.4999999403954 sec.
Hardness ratio (energy fluence ratio) = 1.48214
Color vs. Color plot

Count Ratio  (25-50 keV) / (15-25 keV) = 1.49219
Count Ratio (50-100 keV) / (15-25 keV) = 1.30511
Mask shadow pattern (with DETECTION mask)
IMX = 4.463664410743676E-01, IMY = -7.768972282570237E-01
TIME vs. PHA plot around the trigger time

Blue+Cyan dotted lines: Time interval of the scaled map
From 0.000000 to 1.024000
TIME vs. DetID plot around the trigger time

Blue+Cyan dotted lines: Time interval of the scaled map
From 0.000000 to 1.024000
100 us light curve (15-350 keV)
Blue+Cyan dotted lines: Time interval of the scaled map
From 0.000000 to 1.024000
Spacecraft aspect plot
Bright source in the pre-burst/pre-slew/post-slew images
Pre-burst image of 15-350 keV band
Time interval of the image:
-239.520000 -6.188000

# RAcent  DECcent POSerr Theta    Phi  PeakCts   SNR AngSep     Name
#  [deg]    [deg]    ['] [deg]  [deg]                   [']
244.9805 -15.6395    0.2   7.3  -72.6  11.7962  52.0    0.1	Sco X-1
254.4540  35.1928    4.8  52.8    5.0   1.9724   2.4    9.0	Her X-1
256.0279 -37.8845    3.1  20.5  174.3   0.8953   3.8    3.1	4U 1700-377
256.3941 -36.4333    2.8  19.2  172.6   0.9335   4.0    2.1	GX 349+2
263.0389 -24.7565    0.8  12.3  130.1   3.1821  13.7    1.8	GX 1+4
264.7964 -44.4464    6.9  28.8  164.0   0.4875   1.7    2.3	4U 1735-44
268.2819  -1.6012    3.8  22.4   49.0   0.9035   3.1   10.3	SW J1753.5-0127
270.2765 -25.0672    2.7  18.3  119.9   1.0442   4.2    0.8	GX 5-1
270.1577 -25.8766  104.4  18.5  122.4   0.0279   0.1   11.2	GRS 1758-258
274.0121 -13.9476    8.1  21.2   85.9   0.4544   1.4    5.3	GX 17+2
275.8047 -30.3438    4.7  24.9  127.9   0.7921   2.5    6.4	H1820-303
285.0184 -24.9310  470.2  31.3  112.0   0.0112   0.0    1.1	HT1900.1-2455
262.9865 -33.8807   41.1  18.9  154.3  -0.0707  -0.3    2.8	GX 354-0
239.4090  24.8920    2.8  44.3  -14.1   1.7415   4.2 ------	UNKNOWN
233.0255  38.6342    3.0  59.1  -14.7   6.3375   3.9 ------	UNKNOWN
223.7233 -38.1876    3.1  32.3 -132.6   1.1779   3.8 ------	UNKNOWN
223.0705  32.7307    4.6  57.6  -26.4   4.1475   2.5 ------	UNKNOWN
199.6315 -56.7778    4.0  55.3 -145.3   5.1508   3.0 ------	UNKNOWN
206.8042 -29.7510    3.3  43.1 -112.3   4.7098   3.5 ------	UNKNOWN
Pre-slew background subtracted image of 15-350 keV band
Time interval of the image:
-6.188000 12.180600

# RAcent  DECcent POSerr Theta    Phi  PeakCts   SNR AngSep     Name
#  [deg]    [deg]    ['] [deg]  [deg]                   [']
244.8321 -15.7131    5.7   7.4  -73.5   0.1450   2.0    9.6	Sco X-1
254.4430  35.2747    3.8  52.9    5.0  -1.1421  -3.0    4.1	Her X-1
256.1681 -37.8765    4.4  20.6  174.0  -0.2204  -2.6    8.8	4U 1700-377
256.6095 -36.3945    7.2  19.2  172.1   0.1383   1.6    8.6	GX 349+2
263.0216 -24.7234   13.0  12.3  130.0  -0.0804  -0.9    1.5	GX 1+4
264.6679 -44.3114   28.2  28.7  164.1  -0.0417  -0.4    8.9	4U 1735-44
268.4940  -1.3020    0.0  22.8   48.8  -0.0144  -0.1   11.8	SW J1753.5-0127
270.4258 -24.9296   25.7  18.4  119.3  -0.0423  -0.4   11.8	GX 5-1
270.2380 -25.9012   12.6  18.6  122.3  -0.0815  -0.9   10.1	GRS 1758-258
274.0114 -14.0283   51.4  21.2   86.2  -0.0278  -0.2    0.6	GX 17+2
275.9499 -30.3378    8.0  25.0  127.7  -0.1789  -1.4    2.2	H1820-303
285.0610 -25.0514    9.9  31.3  112.2  -0.2602  -1.2    8.0	HT1900.1-2455
263.1406 -33.6652    0.0  18.8  153.6   0.0396   0.4   12.7	GX 354-0
286.7512   6.7540    0.5  41.9   60.1  14.7449  21.2 ------	UNKNOWN
295.3049 -37.4913    2.7  42.5  129.5   1.7505   4.3 ------	UNKNOWN
251.2791  18.3781    2.9  36.0    1.1   0.4306   4.0 ------	UNKNOWN
Post-slew image of 15-350 keV band
Time interval of the image:
126.980600 962.560000

# RAcent  DECcent POSerr Theta    Phi  PeakCts   SNR AngSep     Name
#  [deg]    [deg]    ['] [deg]  [deg]                   [']
254.5166  35.2190   39.0  41.1 -152.9  -0.2403  -0.3    7.9	Her X-1
262.9541 -24.6342    3.5  39.0  104.3   6.5685   3.3    7.3	GX 1+4
268.3521  -1.3984    2.6  20.1  135.5   2.3465   4.4    3.4	SW J1753.5-0127
270.1617 -25.0278    3.7  35.6   95.0   4.6829   3.1    7.3	GX 5-1
270.2539 -25.6430   11.0  36.1   94.4   1.6917   1.1    6.6	GRS 1758-258
274.0038 -13.9818    3.2  24.3  100.1   2.7144   3.6    3.3	GX 17+2
275.7432 -30.4365    5.0  38.6   84.0   5.9570   2.3   10.3	H1820-303
285.0021 -25.0240    5.6  31.8   71.7   2.0473   2.1    6.5	HT1900.1-2455
288.7990  10.9440    0.5   4.7  -86.2  12.2535  22.5    0.1	GRS 1915+105
299.5999  35.1905    0.6  30.8  -90.6  16.7610  19.4    0.8	Cyg X-1
308.0817  41.0074    3.2  39.2  -85.7   9.2535   3.6    3.5	Cyg X-3
298.2752  -6.9729    3.3  17.9   28.4   1.6462   3.5 ------	UNKNOWN
295.3488  19.7561    2.7  15.5  -79.6   2.1164   4.3 ------	UNKNOWN
334.8487   7.8646    2.5  47.7  -25.9   4.8290   4.6 ------	UNKNOWN
342.2828   3.0334    4.5  55.4  -20.4   4.7726   2.5 ------	UNKNOWN
244.7149  42.6001    3.1  51.6 -150.4   5.7366   3.7 ------	UNKNOWN
275.5938  51.0875    3.6  45.3 -121.2   7.1125   3.2 ------	UNKNOWN
Plot creation:
Fri Dec 18 19:35:43 EST 2015