Special notes of this burst
Image
Pre-slew 15.0-350.0 keV image (Event data)

#   RAcent    DECcent   POSerr    Theta     Phi              Peak Cts       SNR   Name
  164.6683   -23.4699   0.0069    28.6593   147.1709         5.8734534     28.015 TRIG_00456967

Foreground time interval of the image:
-27.360  12.925 (delta_t =  40.285 [sec])
Background time interval of the image:
-36.875 -27.360 (delta_t =   9.515 [sec])
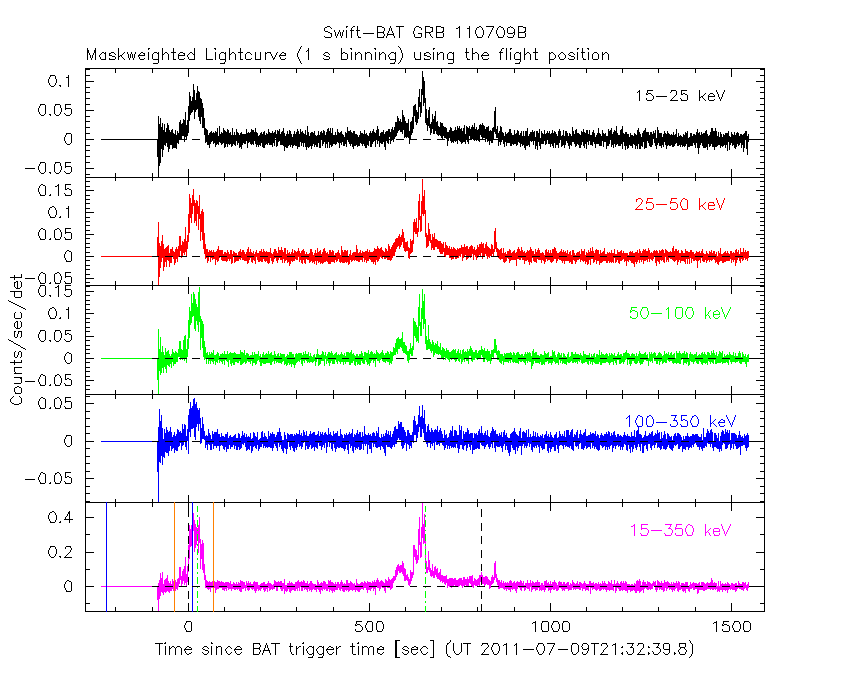
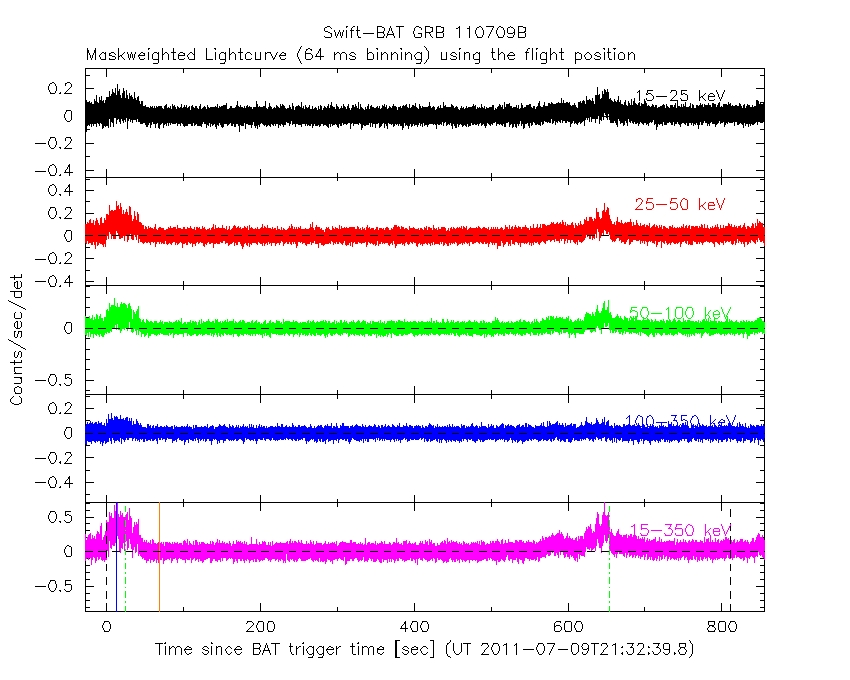
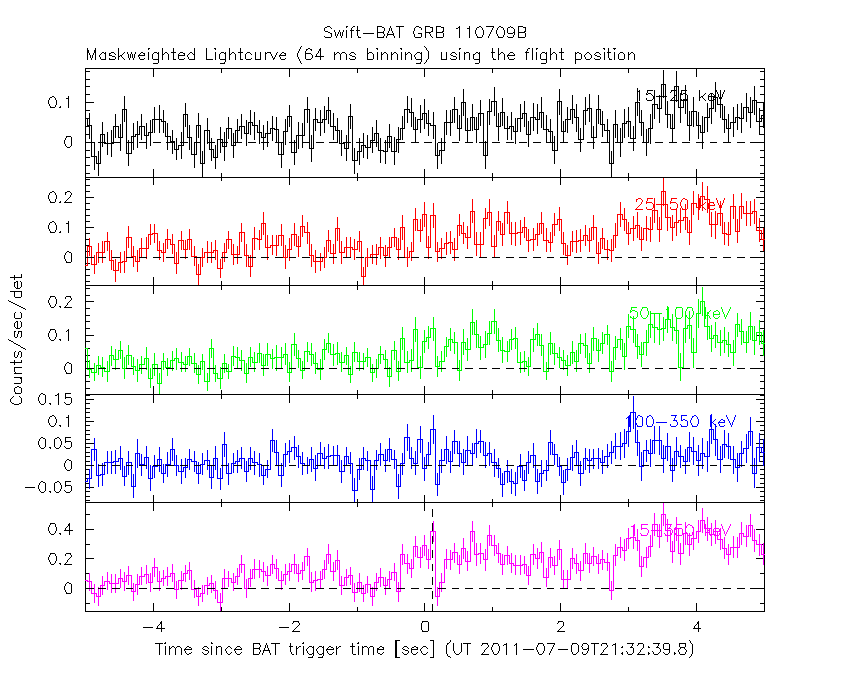
Lightcurves
Notes:
- 1) The mask-weighted light curves are using the flight position.
- 2) Multiple plots of different time binning/intervals are shown to cover all scenarios of short/long GRBs, rate/image triggers, and real/false positives.
- 3) For all the mask-weighted lightcurves, the y-axis units are counts/sec/det where a det is 0.4 x 0.4 = 0.16 sq cm.
- 4) The verticle lines correspond to following: green dotted lines are T50 interval, black dotted lines are T90 interval, blue solid line(s) is a spacecraft slew start time, and orange solid line(s) is a spacecraft slew end time.
- 5) Time of each bin is in the middle of the bin.
1 s binning
From T0-310 s to T0+310 s

From T100_start - 20 s to T100_end + 30 s
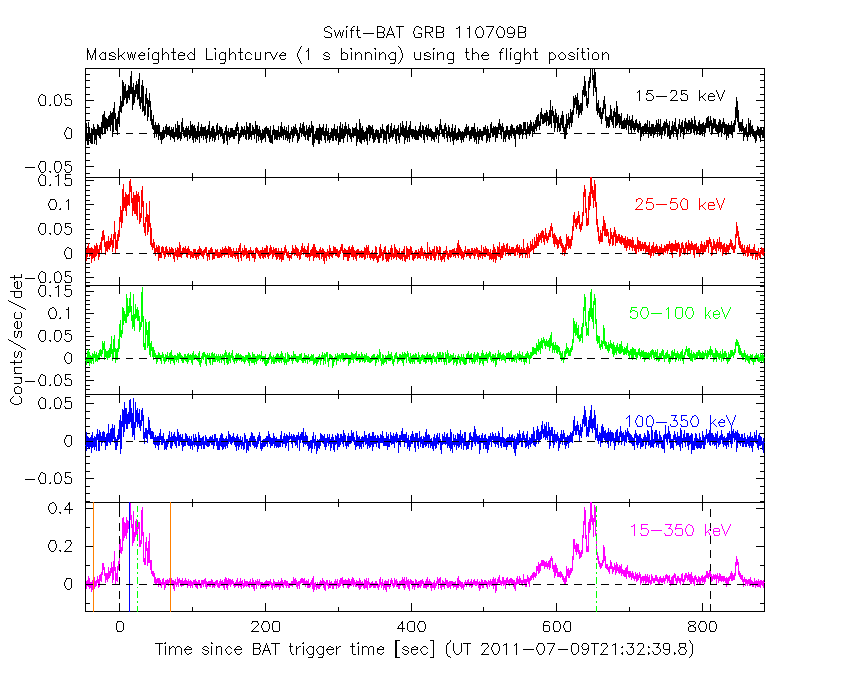
Full time interval
64 ms binning
Full time interval

From T100_start to T100_end
From T0-5 sec to T0+5 sec
16 ms binning
From T100_start-5 s to T100_start+5 s

Blue+Cyan dotted lines: Time interval of the scaled map
From 0.000000 to 1.024000
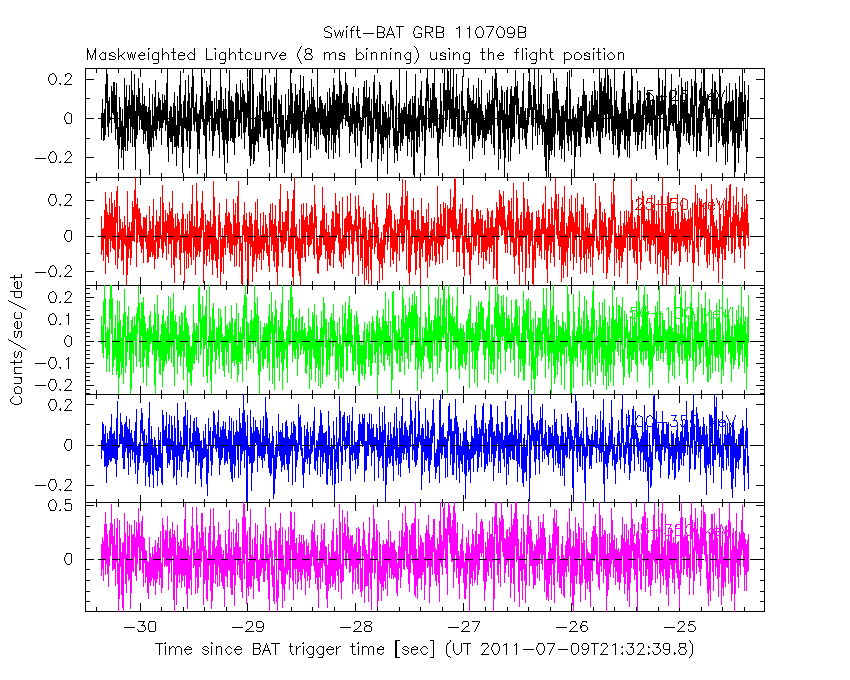
8 ms binning
From T100_start-3 s to T100_start+3 s
Blue+Cyan dotted lines: Time interval of the scaled map
From 0.000000 to 1.024000
2 ms binning
From T100_start-1 s to T100_start+1 s

Blue+Cyan dotted lines: Time interval of the scaled map
From 0.000000 to 1.024000
SN=5 or 10 sec. binning (whichever binning is satisfied first)
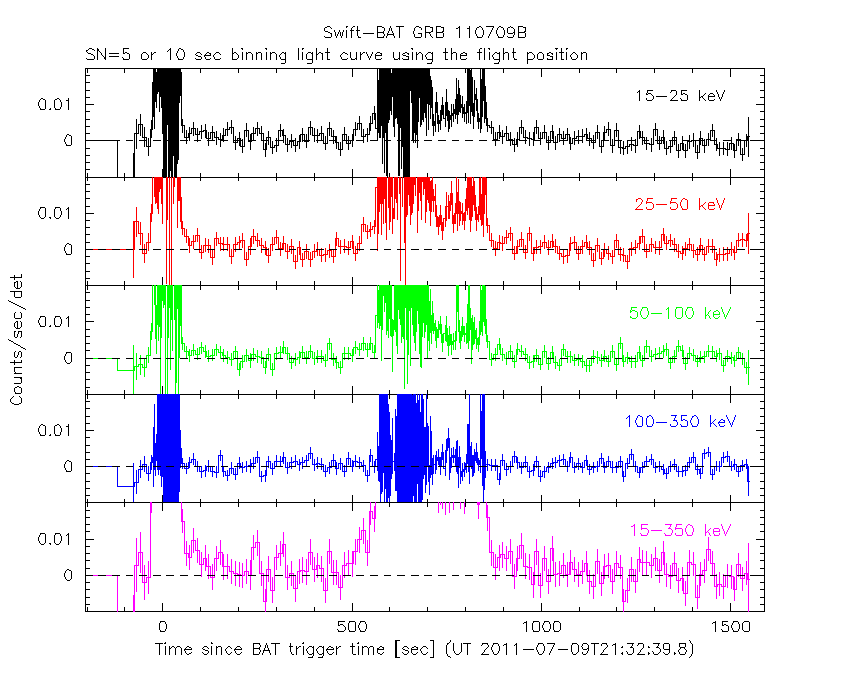
SN=5 or 10 sec. binning (T < 200 sec)

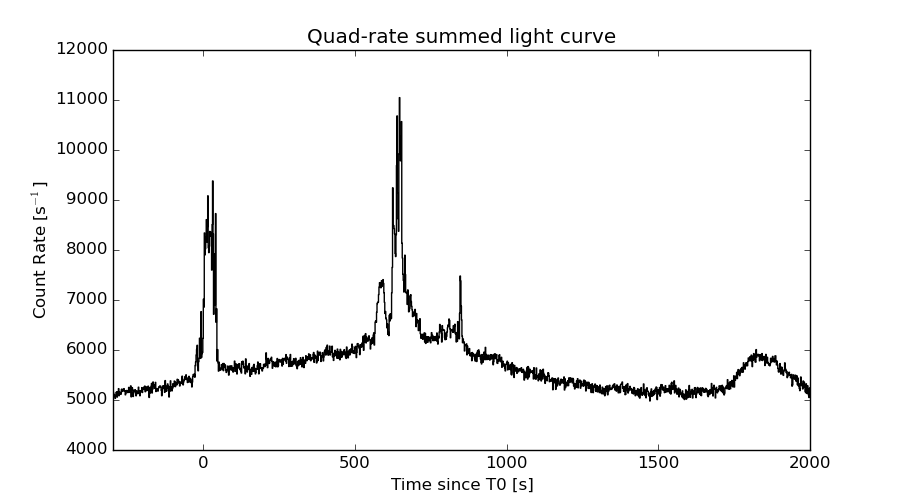
Quad-rate summed light curves (from T0-300s to T0+1000s)
The mask-weighted light curves based on cleaned DPHs

Spectral Evolution
Spectra
Notes:
- 1) The fitting includes the systematic errors.
- 2) When the burst includes telescope slew time periods, the fitting uses an average response file made from multiple 5-s response files through out the slew time plus single time preiod for the non-slew times, and weighted by the total counts in the corresponding time period using addrmf. An average response file is needed becuase a spectral fit using the pre-slew DRM will introduce some errors in both a spectral shape and a normalization if the PHA file contains a lot of the slew/post-slew time interval.
- 3) For fits to more complicated models (e.g. a power-law over a cutoff power-law), the BAT team has decided to require a chi-square improvement of more than 6 for each extra dof.
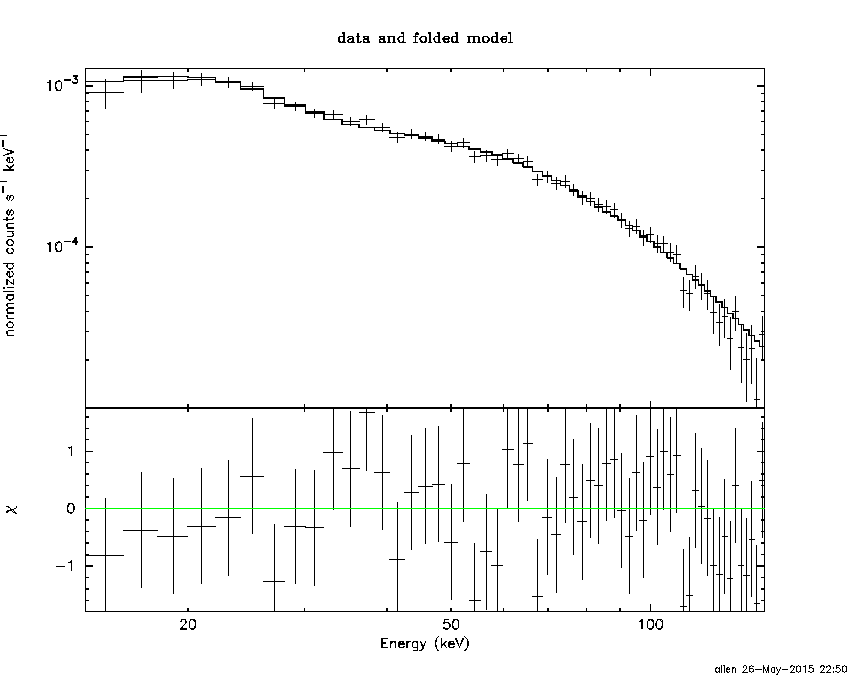
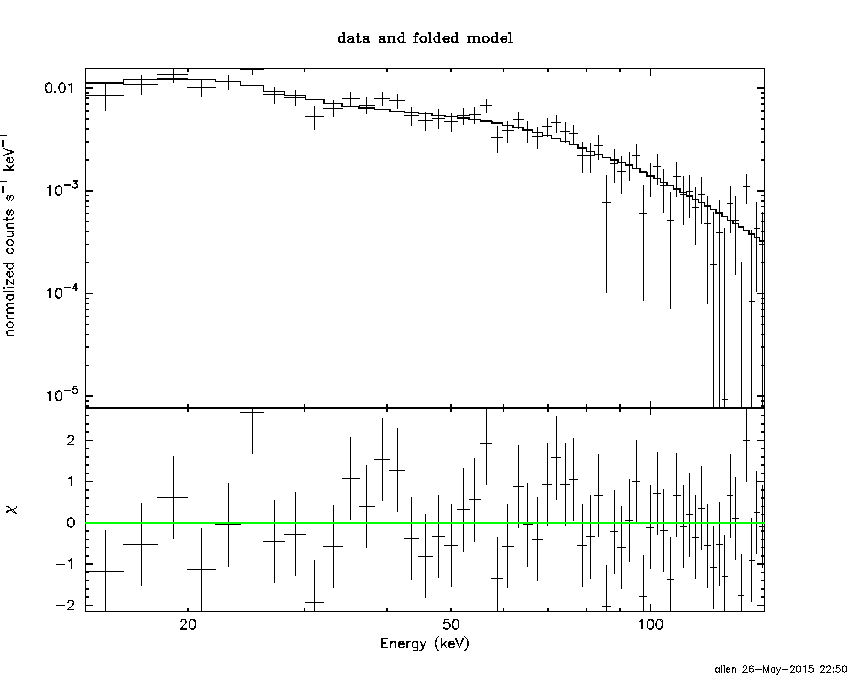
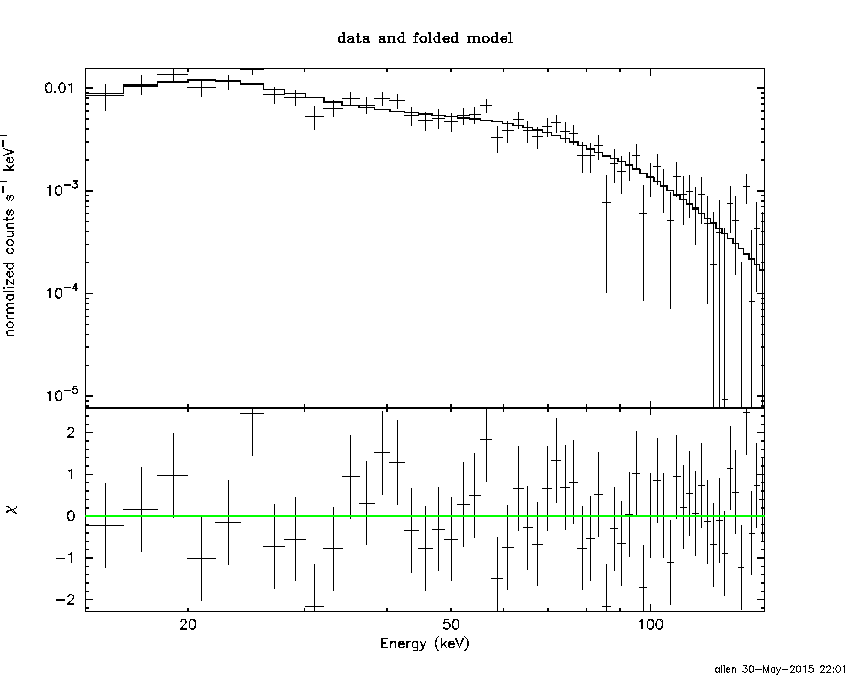
Time averaged spectrum fit using the average DRM
Power-law model
Multiple GTIs in the spectrum
tstart tstop
-27.360000 233.744000
235.024000 855.488000

Spectral model in power-law:
------------------------------------------------------------
Parameters  : value       lower 90%   higher 90%
Photon index: 1.38916     ( -0.0377154   0.0376513 )
Norm@50keV  : 2.74202E-03    ( -5.28932e-05   5.28642e-05 )
------------------------------------------------------------
#Fit statistic : Chi-Squared =          41.14 using 59 PHA bins.
# Reduced chi-squared =         0.7217 for     57 degrees of freedom
# Null hypothesis probability =   9.437783e-01

Photon flux (15-150 keV)    in 881.6 sec: 0.333114 ( -0.00731786  0.00734325 ) ph/cm2/s
Energy fluence (15-150 keV)             : 2.34105e-05 ( -4.64499e-07  4.64844e-07 ) ergs/cm2
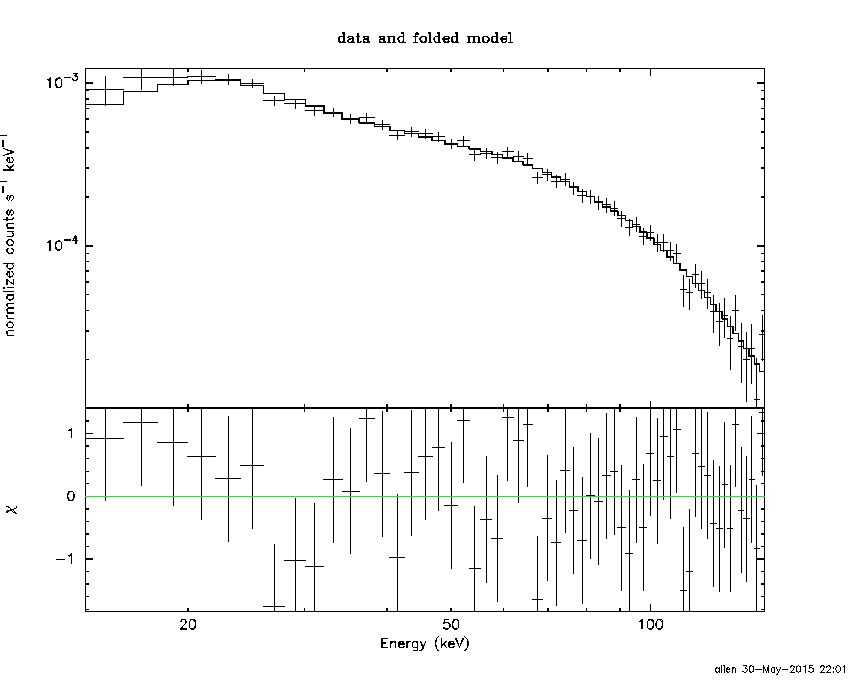
Cutoff power-law model

Multiple GTIs in the spectrum
tstart tstop
-27.360000 233.744000
235.024000 855.488000
Spectral model in the cutoff power-law:
------------------------------------------------------------
Parameters  : value       lower 90%   higher 90%
Photon index: 1.25175     ( -0.152262   0.0671156 )
Epeak [keV] : 315.802      ( -134.51 -315.799 )
Norm@50keV  : 3.14271E-03    ( -0.000333959   0.000497661 )
------------------------------------------------------------
#Fit statistic : Chi-Squared =          38.62 using 59 PHA bins.
# Reduced chi-squared =         0.6896 for     56 degrees of freedom
# Null hypothesis probability =   9.630203e-01

Photon flux (15-150 keV)    in 881.6 sec: 0.329182 ( -0.008323  0.008368 ) ph/cm2/s
Energy fluence (15-150 keV)             : 2.32177e-05 ( -5.14237e-07  5.12562e-07 ) ergs/cm2
Band function
Multiple GTIs in the spectrum
tstart tstop
-27.360000 233.744000
235.024000 855.488000

Spectral model in the Band function:
------------------------------------------------------------
Parameters  : value       lower 90%   higher 90%
alpha       : -1.25180   ( 0.91418   5.58834 )
beta        : -9.99925    ( 9.92581   19.9258 )
Epeak [keV] : 315.844      ( -88.972 -315.844 )
Norm@50keV   : 3.14214E-03    ( -0.000219037   0.00049768 )
------------------------------------------------------------
#Fit statistic : Chi-Squared =          38.62 using 59 PHA bins.
# Reduced chi-squared =         0.7022 for     55 degrees of freedom
# Null hypothesis probability =   9.540726e-01

Photon flux (15-150 keV)    in 881.6 sec: 0.327699 ( 6.6723  -0.009558 ) ph/cm2/s
Energy fluence (15-150 keV)             : 0 ( 0  0 ) ergs/cm2
Single BB

Spectral model blackbody:
------------------------------------------------------------
Parameters  : value    Lower 90%  Upper 90%
kT [keV]    : 18.8494  (  )
R^2/D10^2   : 1.69228E-02  (   )
(R is the radius in km and D10 is the distance to the source in units of 10 kpc)
------------------------------------------------------------
#Fit statistic : Chi-Squared =         543.84 using 59 PHA bins.
# Reduced chi-squared =         9.5411 for     57 degrees of freedom
# Null hypothesis probability =   1.382982e-80

Energy  Fluence     90% Error
[keV]   [erg/cm2]   [erg/cm2]
15- 25  1.045e-06   4.408e-08
25- 50  4.998e-06   1.384e-07
50-150  1.303e-05   4.011e-07
15-150  1.907e-05   4.055e-07
Thermal bremsstrahlung (OTTB)
Spectral model: thermal bremsstrahlung
------------------------------------------------------------
Parameters  : value         Lower 90%    Upper 90%
kT [keV]    : 199.363       (      )
Norm        : 1.40299       (     )
------------------------------------------------------------
#Fit statistic : Chi-Squared =         123.27 using 59 PHA bins.
# Reduced chi-squared =         2.1627 for     57 degrees of freedom
# Null hypothesis probability =   8.731755e-07

Energy  Fluence     90% Error
[keV]   [erg/cm2]   [erg/cm2]
15- 25  3.080e-06   6.656e-08
25- 50  5.925e-06   1.283e-07
50-150  1.299e-05   2.953e-07
15-150  2.200e-05   4.849e-07
Double BB
Spectral model: bbodyrad<1> + bbodyrad<2>
------------------------------------------------------------
Parameters  : value         Lower 90%    Upper 90%
kT1 [keV]   : 7.71995        (-0.583771      0.619372)
R1^2/D10^2  : 0.220084        (-0.0508686      0.0707053)
kT2 [keV]   : 30.0795        (-1.97784      2.40584)
R2^2/D10^2  : 2.91727E-03    (-0.00067892   0.000787508)
------------------------------------------------------------
#Fit statistic : Chi-Squared =          38.02 using 59 PHA bins.
# Reduced chi-squared =         0.6912 for     55 degrees of freedom
# Null hypothesis probability =   9.607293e-01

Energy  Fluence     90% Error
[keV]   [erg/cm2]   [erg/cm2]
15- 25  2.397e-06   1.781e-07
25- 50  5.587e-06   2.173e-07
50-150  1.511e-05   6.039e-07
15-150  2.309e-05   8.992e-07
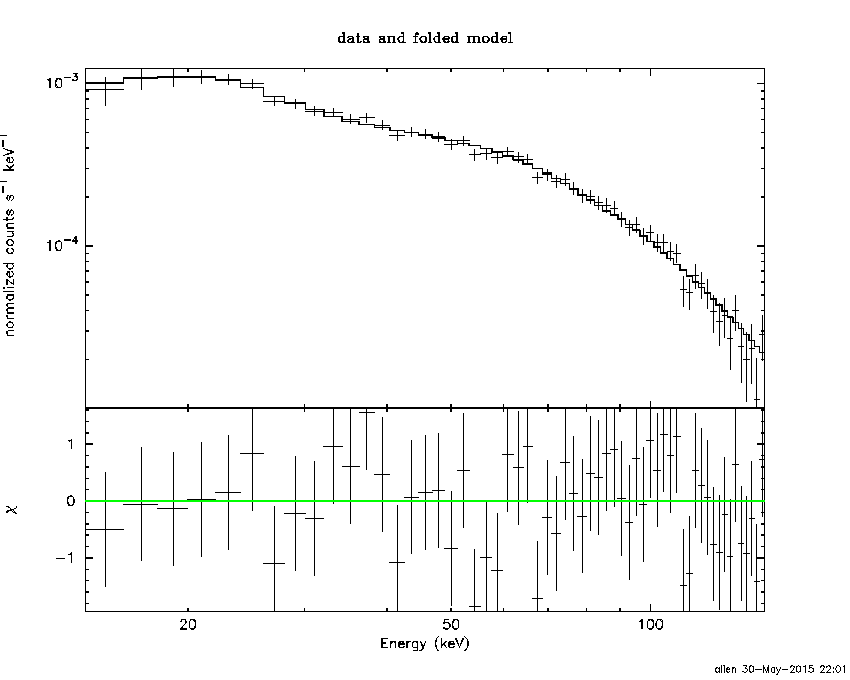
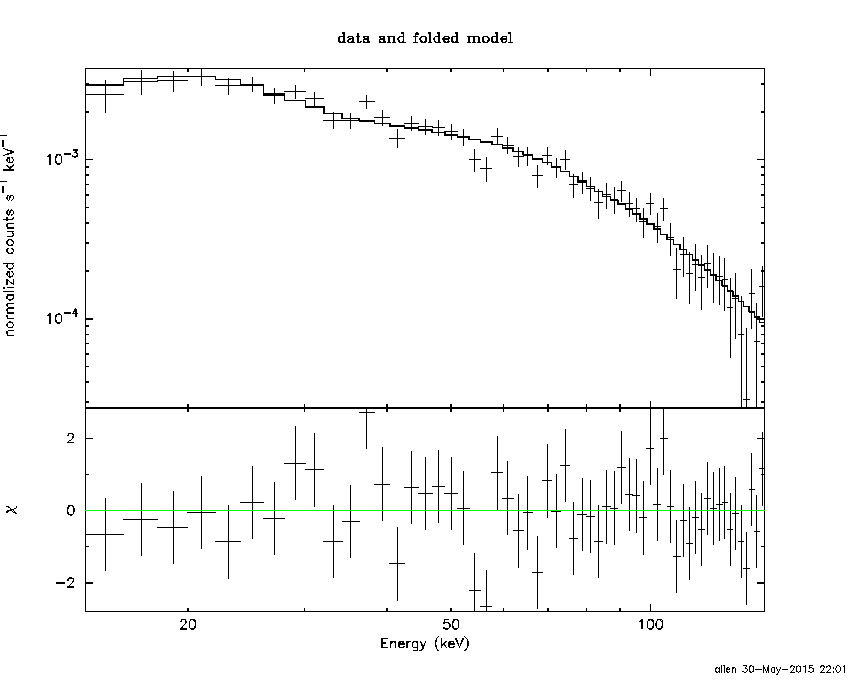
Peak spectrum fit
Power-law model
Time interval is from  646.612 sec. to  647.612 sec.

Spectral model in power-law:
------------------------------------------------------------
Parameters  : value       lower 90%   higher 90%
Photon index: 1.26216     ( -0.0918341   0.0918243 )
Norm@50keV  : 3.19602E-02    ( -0.001688   0.00168611 )
------------------------------------------------------------
#Fit statistic : Chi-Squared =          58.48 using 59 PHA bins.
# Reduced chi-squared =          1.026 for     57 degrees of freedom
# Null hypothesis probability =   4.209157e-01

Photon flux (15-150 keV)    in 1 sec: 3.78762 ( -0.201778  0.201896 ) ph/cm2/s
Energy fluence (15-150 keV)             : 3.18843e-07 ( -1.9151e-08  1.92516e-08 ) ergs/cm2
Cutoff power-law model

Time interval is from  646.612 sec. to  647.612 sec.
Spectral model in the cutoff power-law:
------------------------------------------------------------
Parameters  : value       lower 90%   higher 90%
Photon index: 0.945692     ( -0.378414   0.343957 )
Epeak [keV] : 175.264      ( -68.2901 -175.264 )
Norm@50keV  : 4.55089E-02    ( -0.0140209   0.0230671 )
------------------------------------------------------------
#Fit statistic : Chi-Squared =          56.07 using 59 PHA bins.
# Reduced chi-squared =          1.001 for     56 degrees of freedom
# Null hypothesis probability =   4.720617e-01

Photon flux (15-150 keV)    in 1 sec: 3.73465 ( -0.21009  0.20984 ) ph/cm2/s
Energy fluence (15-150 keV)             : 3.11906e-07 ( -2.098e-08  2.0854e-08 ) ergs/cm2
Band function

Time interval is from  646.612 sec. to  647.612 sec.

Spectral model in the Band function:
------------------------------------------------------------
Parameters  : value       lower 90%   higher 90%
alpha       : -0.938680   ( 0.938462   0.9031 )
beta        : -1.65700    ( 1.67076   0.449145 )
Epeak [keV] : 170.822      ( -170.069 -170.069 )
Norm@50keV   : 4.59758E-02    ( -0.0127067   0.854199 )
------------------------------------------------------------
#Fit statistic : Chi-Squared =          56.06 using 59 PHA bins.
# Reduced chi-squared =          1.019 for     55 degrees of freedom
# Null hypothesis probability =   4.349280e-01

Photon flux (15-150 keV)    in 1 sec:  (    ) ph/cm2/s
Energy fluence (15-150 keV)             : 0 ( 0  0 ) ergs/cm2
Single BB
Spectral model blackbody:
------------------------------------------------------------
Parameters  : value    Lower 90%  Upper 90%
kT [keV]    : 17.6157  (  )
R^2/D10^2   : 0.260297  (   )
(R is the radius in km and D10 is the distance to the source in units of 10 kpc)
------------------------------------------------------------
#Fit statistic : Chi-Squared =         122.98 using 59 PHA bins.
# Reduced chi-squared =         2.1576 for     57 degrees of freedom
# Null hypothesis probability =   9.477127e-07

Energy  Fluence     90% Error
[keV]   [erg/cm2]   [erg/cm2]
15- 25  1.628e-08   1.620e-09
25- 50  7.408e-08   5.715e-09
50-150  1.659e-07   1.710e-08
15-150  2.562e-07   1.750e-08
Thermal bremsstrahlung (OTTB)

Spectral model: thermal bremsstrahlung
------------------------------------------------------------
Parameters  : value         Lower 90%    Upper 90%
kT [keV]    : 200.000       (      )
Norm        : 15.5297       (-0.824721     0.824664)
------------------------------------------------------------
#Fit statistic : Chi-Squared =          82.58 using 59 PHA bins.
# Reduced chi-squared =          1.449 for     57 degrees of freedom
# Null hypothesis probability =   1.500910e-02

Energy  Fluence     90% Error
[keV]   [erg/cm2]   [erg/cm2]
15- 25  3.867e-08   2.245e-09
25- 50  7.438e-08   5.060e-09
50-150  1.631e-07   1.100e-08
15-150  2.762e-07   3.160e-08
Double BB
Spectral model: bbodyrad<1> + bbodyrad<2>
------------------------------------------------------------
Parameters  : value         Lower 90%    Upper 90%
kT1 [keV]   : 6.91888        (-1.39772      1.75509)
R1^2/D10^2  : 3.19799        (-1.61336      3.79472)
kT2 [keV]   : 27.0510        (-3.83884      6.36869)
R2^2/D10^2  : 5.30773E-02    (-0.02752   0.0381072)
------------------------------------------------------------
#Fit statistic : Chi-Squared =          56.55 using 59 PHA bins.
# Reduced chi-squared =          1.028 for     55 degrees of freedom
# Null hypothesis probability =   4.170507e-01

Energy  Fluence     90% Error
[keV]   [erg/cm2]   [erg/cm2]
15- 25  3.075e-08   7.425e-09
25- 50  7.061e-08   1.392e-08
50-150  2.087e-07   3.695e-08
15-150  3.100e-07   5.075e-08
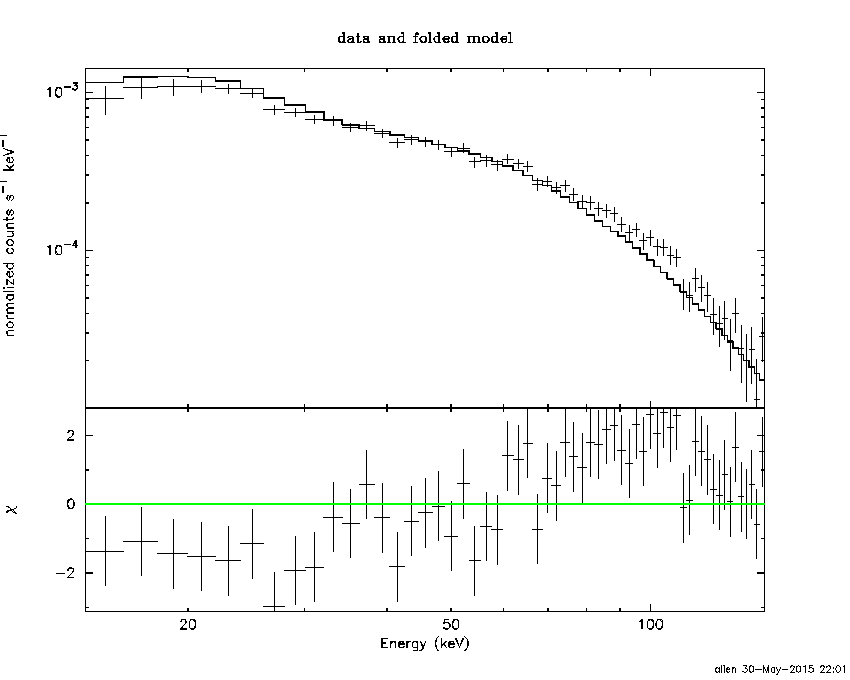
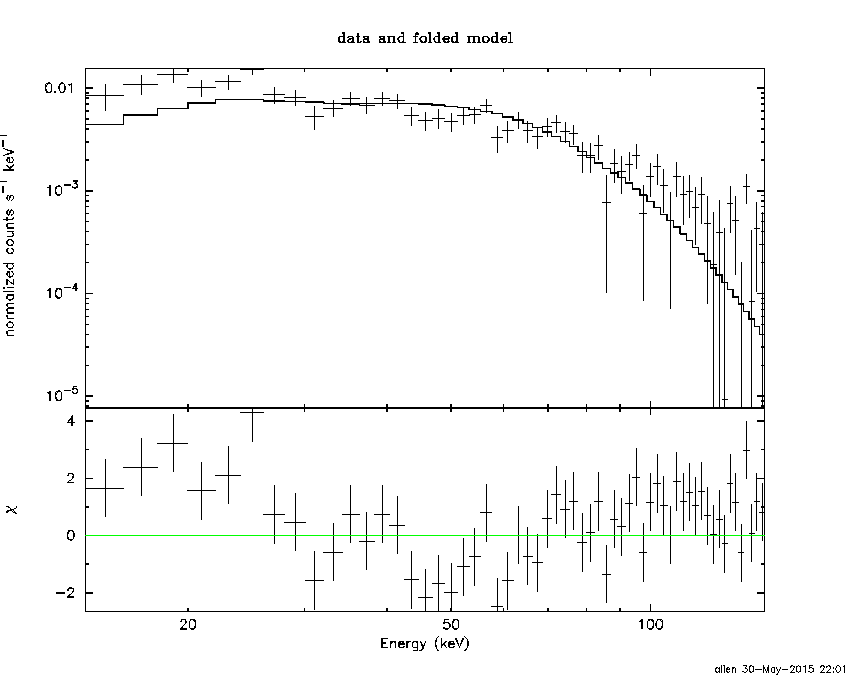
Pre-slew spectrum (Pre-slew PHA with pre-slew DRM)
Power-law model
Spectral model in power-law:
------------------------------------------------------------
Parameters  : value       lower 90%   higher 90%
Photon index: 1.29292     ( -0.0605324   0.0603066 )
Norm@50keV  : 9.37433E-03    ( -0.00030218   0.000302106 )
------------------------------------------------------------
#Fit statistic : Chi-Squared =          54.04 using 59 PHA bins.
# Reduced chi-squared =         0.9481 for     57 degrees of freedom
# Null hypothesis probability =   5.867140e-01

Photon flux (15-150 keV)    in 40.28 sec: 1.11694 ( -0.0387146  0.0388406 ) ph/cm2/s
Energy fluence (15-150 keV)             : 3.73783e-06 ( -1.29262e-07  1.2963e-07 ) ergs/cm2
Cutoff power-law model

Spectral model in the cutoff power-law:
------------------------------------------------------------
Parameters  : value       lower 90%   higher 90%
Photon index: 1.21923     ( -0.237413   0.0719043 )
Epeak [keV] : 550.673      ( -760.136 -964.194 )
Norm@50keV  : 1.01224E-02    ( -0.00065967   0.00255915 )
------------------------------------------------------------
#Fit statistic : Chi-Squared =          54.13 using 59 PHA bins.
# Reduced chi-squared =         0.9667 for     56 degrees of freedom
# Null hypothesis probability =   5.457811e-01

Photon flux (15-150 keV)    in 40.28 sec: 1.11607 ( -0.04478  0.0394 ) ph/cm2/s
Energy fluence (15-150 keV)             : 3.7271e-06 ( -1.36179e-07  6.94186e-08 ) ergs/cm2
Band function

Spectral model in the Band function:
------------------------------------------------------------
Parameters  : value       lower 90%   higher 90%
alpha       : -0.498673   ( 0.806777   0.806777 )
beta        : -1.32859    ( -0.102243   0.080926 )
Epeak [keV] : 60.0872      ( -59.7636 271.224 )
Norm@50keV   : 3.05566E-02    ( -0.0312671   523.482 )
------------------------------------------------------------
#Fit statistic : Chi-Squared =          52.59 using 59 PHA bins.
# Reduced chi-squared =         0.9562 for     55 degrees of freedom
# Null hypothesis probability =   5.671607e-01

Photon flux (15-150 keV)    in 40.28 sec:  (    ) ph/cm2/s
Energy fluence (15-150 keV)             : 0 ( 0  0 ) ergs/cm2
S(25-50 keV) vs. S(50-100 keV) plot

S(25-50 keV)  = 5.47e-06
S(50-100 keV) = 8.36e-06
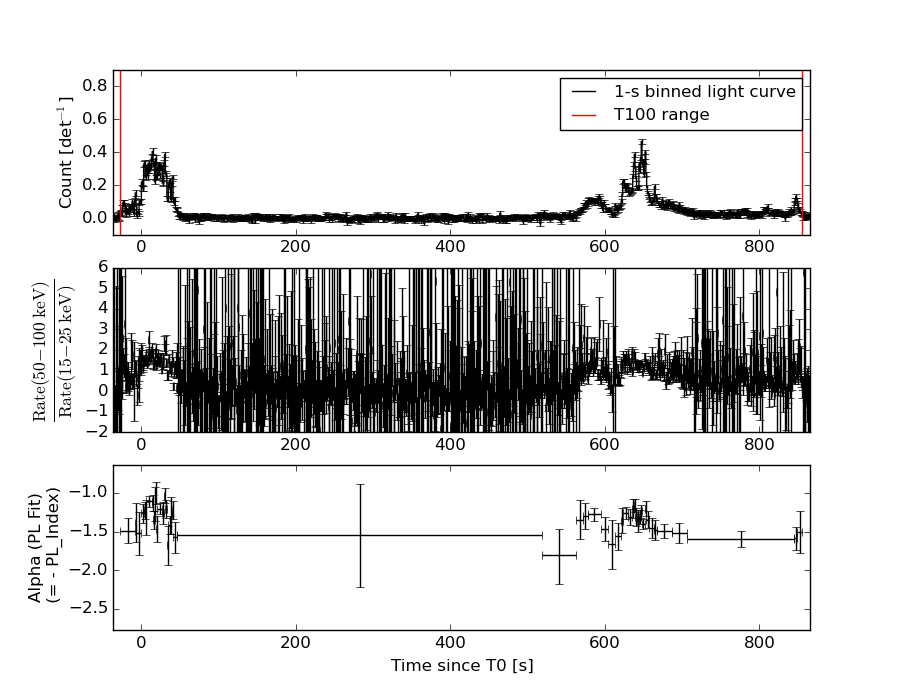
T90 vs. Hardness ratio plot

T90                                   = 810.471999943256 sec.
Hardness ratio (energy fluence ratio) = 1.52834
Color vs. Color plot
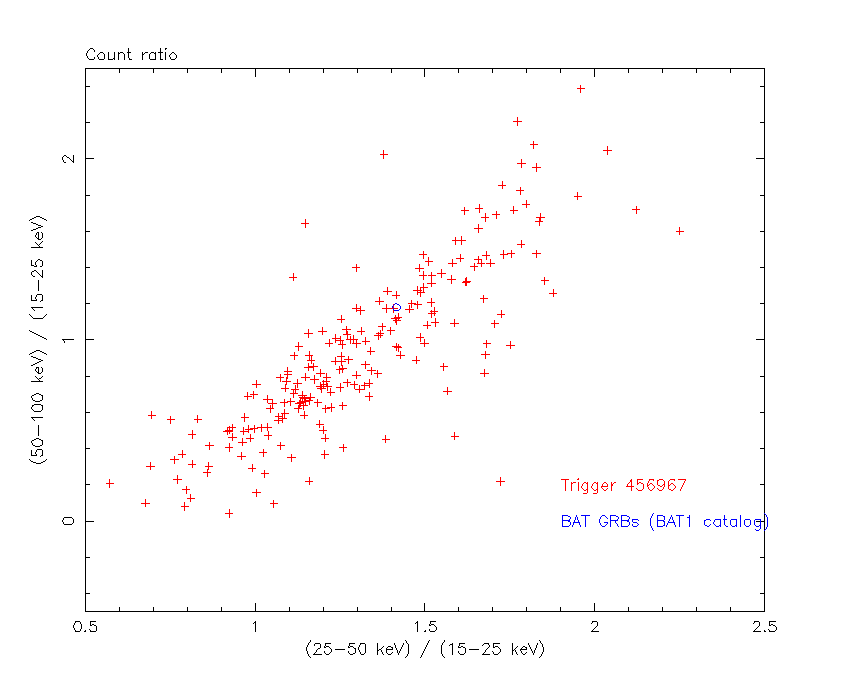
Count Ratio  (25-50 keV) / (15-25 keV) = 1.41569
Count Ratio (50-100 keV) / (15-25 keV) = 1.18106
Mask shadow pattern
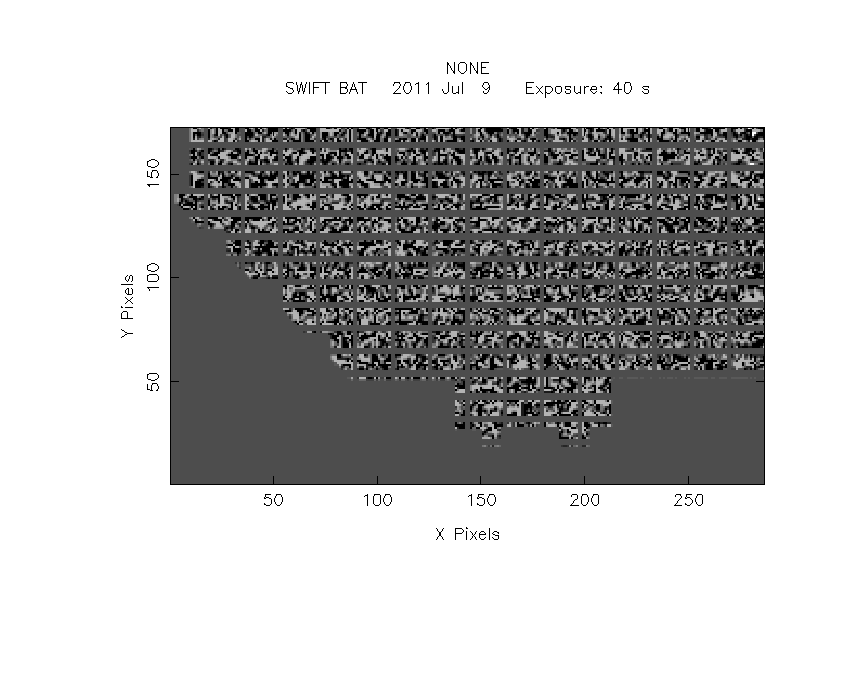
IMX = -4.592707663994564E-01, IMY = -2.963102109446565E-01
TIME vs. PHA plot around the trigger time
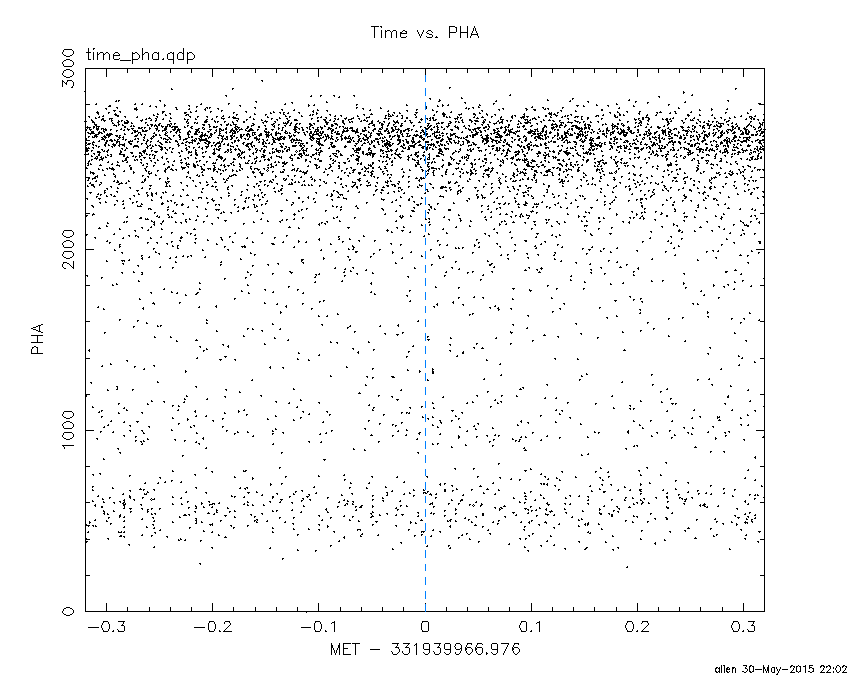
Blue+Cyan dotted lines: Time interval of the scaled map
From 0.000000 to 1.024000
TIME vs. DetID plot around the trigger time
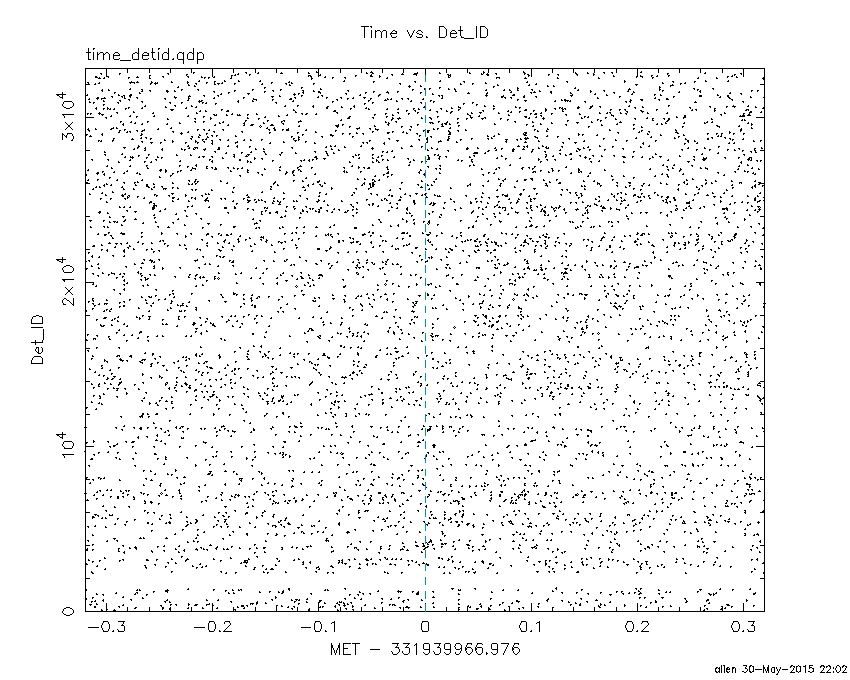
Blue+Cyan dotted lines: Time interval of the scaled map
From 0.000000 to 1.024000
100 us light curve (15-350 keV)

Blue+Cyan dotted lines: Time interval of the scaled map
From 0.000000 to 1.024000
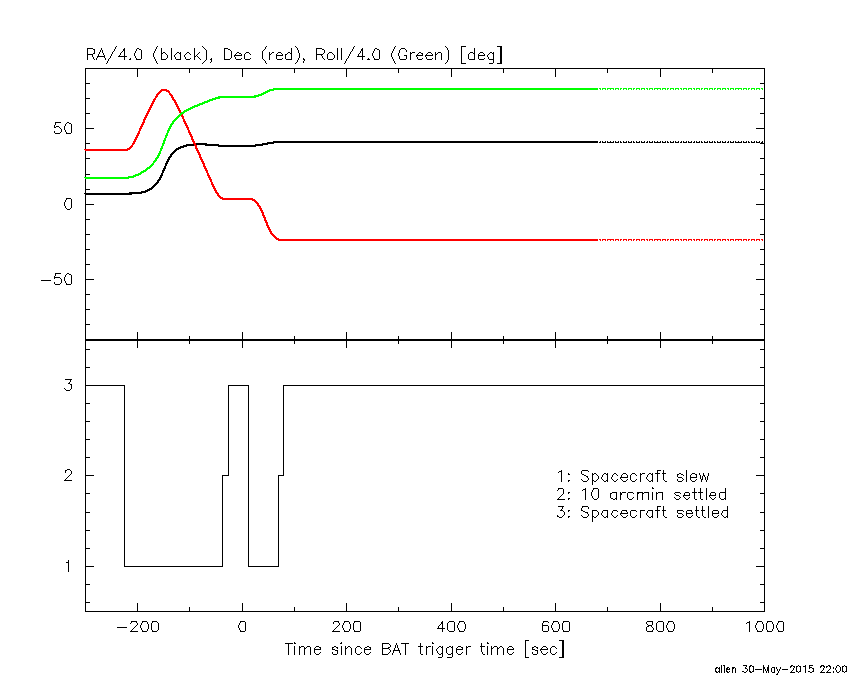
Spacecraft aspect plot
Bright source in the pre-burst/pre-slew/post-slew images
Pre-burst image of 15-350 keV band
Time interval of the image:
-36.875410 -27.360000

# RAcent  DECcent POSerr Theta    Phi  PeakCts   SNR AngSep     Name
#  [deg]    [deg]    ['] [deg]  [deg]                   [']
135.3939 -40.5401    5.9  47.6 -173.9  -0.1258  -1.9    6.2	Vela X-1
187.5270   6.3924    2.3  32.5   69.6   0.3200   5.0 ------	UNKNOWN
175.0257  14.6479    2.5  22.6   45.4   0.1740   4.6 ------	UNKNOWN
168.5738  34.9461    2.2  33.8    6.2   0.2213   5.2 ------	UNKNOWN
115.4555  19.5574    2.4  41.7  -78.3   0.6203   4.9 ------	UNKNOWN
Pre-slew background subtracted image of 15-350 keV band
Time interval of the image:
-27.360000 12.924600

# RAcent  DECcent POSerr Theta    Phi  PeakCts   SNR AngSep     Name
#  [deg]    [deg]    ['] [deg]  [deg]                   [']
135.4067 -40.5104    4.0  47.6 -173.9   0.8632   2.9    6.2	Vela X-1
190.0436   0.8073    2.3  35.1   79.6   1.9783   5.1 ------	UNKNOWN
164.6683 -23.4699    0.4  28.7  147.2   5.8732  28.0 ------	UNKNOWN
170.0483  34.0713    2.4  33.5    8.8   0.9487   4.8 ------	UNKNOWN
158.0200  15.2050    2.0  12.0   -0.0   0.8513   5.7 ------	UNKNOWN
133.8211 -41.9418    2.1  49.4 -173.4   1.8449   5.5 ------	UNKNOWN
148.6812  32.4947    2.8  29.5  -25.0   0.7091   4.2 ------	UNKNOWN
117.9939 -41.2975    2.4  56.1 -161.1   2.9372   4.7 ------	UNKNOWN
114.2589 -41.2543    2.2  58.2 -158.9   4.6951   5.3 ------	UNKNOWN
Post-slew image of 15-350 keV band
Time interval of the image:
68.924600 233.744000
235.024000 1285.694000
1287.024000 1548.096500

# RAcent  DECcent POSerr Theta    Phi  PeakCts   SNR AngSep     Name
#  [deg]    [deg]    ['] [deg]  [deg]                   [']
135.5647 -40.5695    0.9  29.8 -167.7  11.7935  12.4    1.9	Vela X-1
170.3688 -60.6139    1.8  37.3  139.6  11.8388   6.4    1.7	Cen X-3
186.7993 -62.7497    6.0  42.0  129.3   6.4736   1.9    4.1	GX 301-2
187.6919 -57.1223    3.4  37.5  123.9   7.8697   3.4 ------	UNKNOWN
204.8978 -13.1763    2.6  39.4   46.4   9.5855   4.4 ------	UNKNOWN
175.6448 -41.7341    3.0  20.4  120.2   3.9572   3.8 ------	UNKNOWN
193.7043   4.5495    3.6  39.9   13.3   4.6763   3.2 ------	UNKNOWN
154.5777 -39.6382    2.7  18.3  169.7   3.9454   4.2 ------	UNKNOWN
197.2291  21.8431    3.2  55.3    1.7  14.5867   3.6 ------	UNKNOWN
164.6585 -23.4562    0.4   0.0   -2.5  25.1609  26.0 ------	UNKNOWN
110.8739 -30.5827    2.7  48.0 -146.5   8.3652   4.3 ------	UNKNOWN
102.7020 -28.5964    6.7  55.3 -145.2  12.4943   1.7 ------	UNKNOWN
112.6008 -18.6085    3.0  48.6 -130.3  16.6039   3.9 ------	UNKNOWN
Plot creation:
Sat May 30 22:02:29 EDT 2015