Click here for the BAT GCN circular template
Image
Pre-slew 15-350 keV image (Event data; bkg subtracted)

#   RAcent  DECcent POSerr  Theta    Phi     Peak Cts     SNR  Name
  344.4430 -65.6362 0.0349   38.5  -16.1       0.6424     5.5  TRIG_00457076
------------------------------------------

Foreground time interval of the image:
  0.000  64.000 (delta_t =  64.000 [sec])
Background time interval of the image:
Lightcurves
Notes:
- 1) All plots contain as much data as has been downloaded to date.
- 2) The mask-weighted light curves are using the flight position.
- 3) Multiple plots of different time binning/intervals are shown to cover all scenarios of short/long GRBs, rate/image triggers, and real/false positives.
- 4) For all the mask-weighted lightcurves, the y-axis units are counts/sec/det where a det is 0.4 x 0.4 = 0.16 sq cm.
- 5) The verticle lines correspond to following: green dotted lines are T50 interval, black dotted lines are T90 interval, blue solid line(s) is a spacecraft slew start time, and orange solid line(s) is a spacecraft slew end time.
- 6) Time of each bin is in the middle of the bin.
1 s binning
From T0-310 s to T0+310 s

From T100_start - 20 s to T100_end + 30 s

Full time interval

64 ms binning
Full time interval

From T100_start to T100_end

From T0-5 sec to T0+5 sec

16 ms binning
From T100_start-5 s to T100_start+5 s

8 ms binning
From T100_start-3 s to T100_start+3 s

2 ms binning
From T100_start-1 s to T100_start+1 s

SN=5 or 10 sec. binning (whichever binning is satisfied first)

SN=5 or 10 sec. binning (T < 200 sec)

Flight mask-tagged light curves
Caution: Mask-weight map is always using the same on-axis map


Quad-rate summed light curves (from T0-300 to T0+1000)

Spectra
Notes:
- 1) The fitting includes the systematic errors.
- 2) For long bursts, a spectral fit of the pre-slew DRM will introduce some errors in both a spectral shape and a normalization if the PHA file contains a lot of the slew/post-slew time interval.
- 3) For fits to more complicated models (e.g. a power-law over a cutoff power-law), the BAT team has decided to require a chi-square improvement of more than 6 for each extra dof.
- 4) For short bursts (T90<1sec), the specrtum is also fit with Blackbody, OTTB, and Double Blackbody.
Time averaged spectrum fit using the pre-slew DRM
Power-law model
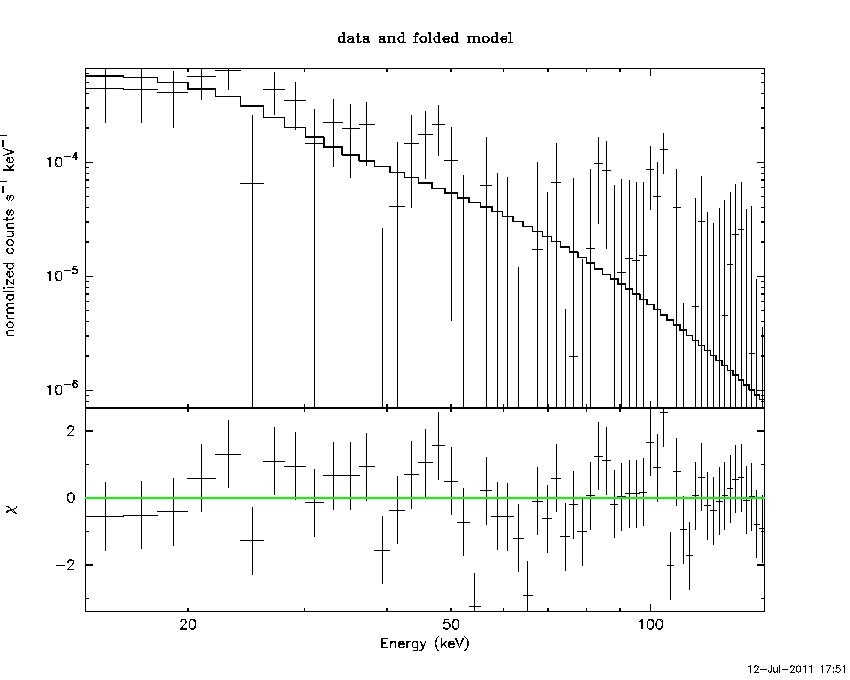
Time interval is from    0.000 sec. to   64.000 sec.

Spectral model in power-law:
------------------------------------------------------------
Parameters  : value       lower 90%   higher 90%
Photon index: 2.75162     ( -0.535454   0.682223 )
Norm@50keV  : 3.91733E-04    ( -0.000189038   0.000205902 )
------------------------------------------------------------
# Chi-Squared =          64.19 using 59 PHA bins.
# Reduced chi-squared =          1.126 for     57 degrees of freedom
# Null hypothesis probability =   2.392156e-01

Photon flux (15-150 keV)    in 64 sec: 9.04974E-02 ( -0.0236242  0.0237284 ) ph/cm2/s
Energy fluence (15-150 keV)             : 2.71693e-07 ( -8.79469e-08  9.86464e-08 ) ergs/cm2
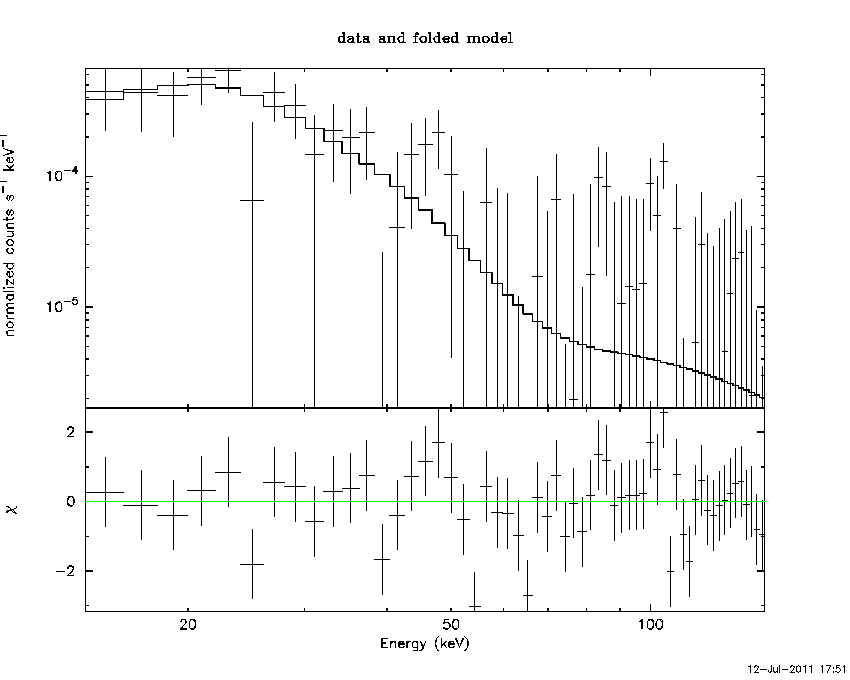
Cutoff power-law model

Time interval is from    0.000 sec. to   64.000 sec.
Spectral model in the cutoff power-law:
------------------------------------------------------------
Parameters  : value       lower 90%   higher 90%
Photon index: -2.55475     ( -6.80768   2.8487 )
Epeak [keV] : 25.0229      ( -23.9781 6.59726 )
Norm@50keV  : 2.07545    (     )
------------------------------------------------------------
# Chi-Squared =          60.13 using 59 PHA bins.
# Reduced chi-squared =          1.074 for     56 degrees of freedom
# Null hypothesis probability =   3.286382e-01

Photon flux (15-150 keV)    in 64 sec: 8.87741E-02 ( -0.0222024  0.0223599 ) ph/cm2/s
Energy fluence (15-150 keV)             : 2.31668e-07 ( -6.2544e-08  6.83949e-08 ) ergs/cm2
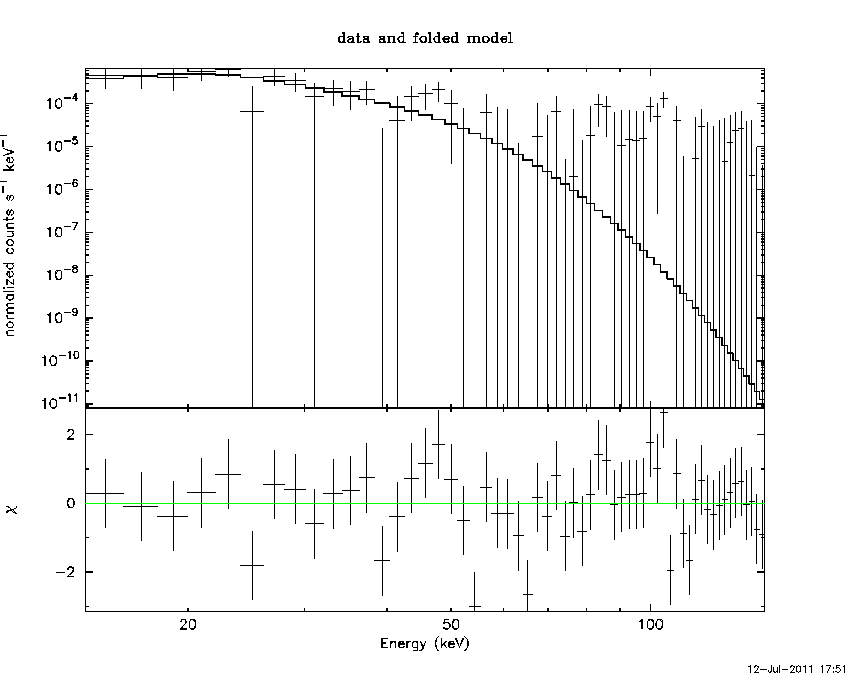
Band function

Time interval is from    0.000 sec. to   64.000 sec.

Spectral model in the Band function:
------------------------------------------------------------
Parameters  : value       lower 90%   higher 90%
alpha       : 1.25305   ( 1.66546   1.66546 )
beta        : -7.29190    ( 5.88034   15.6276 )
Epeak [keV] : 23.9073      ( -3.80813 6.29431 )
Norm@50keV   : 0.253198    ( -0.253225   64.7291 )
------------------------------------------------------------
# Chi-Squared =          60.14 using 59 PHA bins.
# Reduced chi-squared =          1.093 for     55 degrees of freedom
# Null hypothesis probability =   2.950510e-01

Photon flux (15-150 keV)    in 64 sec:  (    ) ph/cm2/s
Energy fluence (15-150 keV)             : 0 ( 0  0 ) ergs/cm2
Single BB

Spectral model blackbody:
------------------------------------------------------------
Parameters  : value    Lower 90%  Upper 90%
kT [keV]    : 6.26634  (-1.31728  1.53415)
R^2/D10^2   : 0.296169  (-0.181459   0.524495)
(R is the radius in km and D10 is the distance to the source in units of 10 kpc)
------------------------------------------------------------
# Chi-Squared =          60.06 using 59 PHA bins.
# Reduced chi-squared =          1.054 for     57 degrees of freedom
# Null hypothesis probability =   3.655156e-01

Energy  Fluence     90% Error
[keV]   [erg/cm2]   [erg/cm2]
15- 25  1.050e-07   6.038e-08
25- 50  1.149e-07   7.021e-08
50-150  1.253e-08   1.062e-08
15-150  2.324e-07   1.371e-07
Thermal bremsstrahlung (OTTB)

Spectral model: thermal bremsstrahlung
------------------------------------------------------------
Parameters  : value         Lower 90%    Upper 90%
kT [keV]    : 21.2806       (-8.36563      16.196)
Norm        : 1.04439       (-0.458572     0.859892)
------------------------------------------------------------
# Chi-Squared =          61.97 using 59 PHA bins.
# Reduced chi-squared =          1.087 for     57 degrees of freedom
# Null hypothesis probability =   3.033183e-01

Energy  Fluence     90% Error
[keV]   [erg/cm2]   [erg/cm2]
15- 25  1.091e-07   4.842e-08
25- 50  1.001e-07   5.604e-08
50-150  3.320e-08   2.911e-08
15-150  2.423e-07   1.167e-07
Double BB
------------------------------------------------------------
Parameters  : value         Lower 90%    Upper 90%
kT1 [keV]   : 199.894        (      )
R1^2/D10^2  : 1.77213E-06        (-1.77213e-06      2.49895e-05)
kT2 [keV]   : 6.20067        (-1.29765      1.54679)
R2^2/D10^2  : 0.307362    (-0.187812   0.560203)
------------------------------------------------------------
# Chi-Squared =          60.06 using 59 PHA bins.
# Chi-Squared =          59.89 using 59 PHA bins.
# Reduced chi-squared =          1.092 for     55 degrees of freedom
# Reduced chi-squared =          1.089 for     55 degrees of freedom
# Null hypothesis probability =   2.973831e-01
# Null hypothesis probability =   3.027245e-01

Energy  Fluence     90% Error
[keV]   [erg/cm2]   [erg/cm2]
15- 25  1.054e-07   1.741e-02
25- 50  1.167e-07   1.754e-01
50-150  1.301e-08   3.533e+00
15-150  2.351e-07   3.571e+00
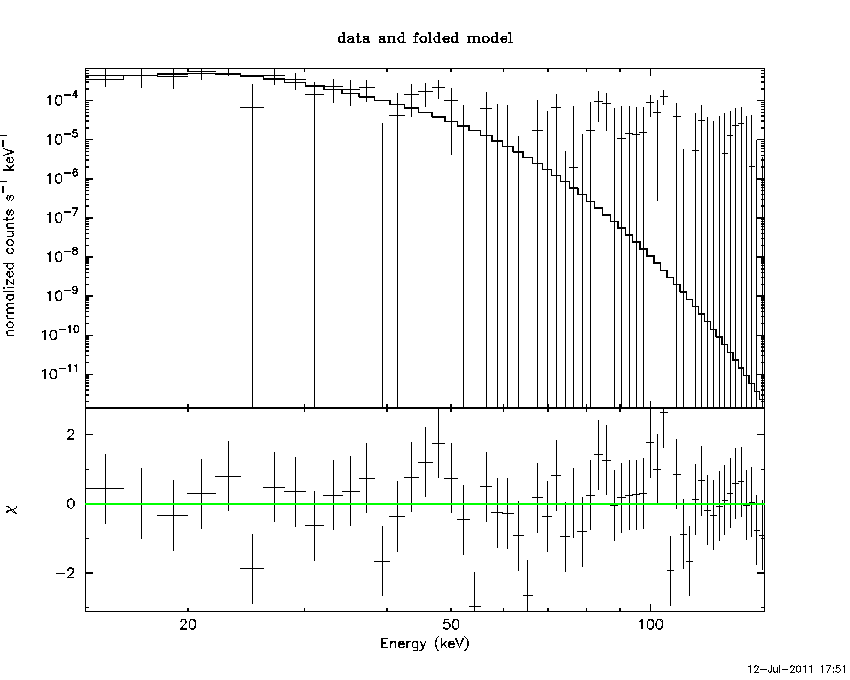
Peak spectrum fit
Power-law model

Time interval is from    0.000 sec. to   64.000 sec.

Spectral model in power-law:
------------------------------------------------------------
Parameters  : value       lower 90%   higher 90%
Photon index: 2.75162     ( -0.535454   0.682223 )
Norm@50keV  : 3.91733E-04    ( -0.000189038   0.000205902 )
------------------------------------------------------------
# Chi-Squared =          64.19 using 59 PHA bins.
# Reduced chi-squared =          1.126 for     57 degrees of freedom
# Null hypothesis probability =   2.392156e-01

Photon flux (15-150 keV)    in 64 sec: 9.04974E-02 ( -0.0236242  0.0237284 ) ph/cm2/s
Energy fluence (15-150 keV)             : 2.71693e-07 ( -8.79469e-08  9.86464e-08 ) ergs/cm2
Cutoff power-law model

Time interval is from    0.000 sec. to   64.000 sec.
Spectral model in the cutoff power-law:
------------------------------------------------------------
Parameters  : value       lower 90%   higher 90%
Photon index: -2.55475     ( -6.80768   2.8487 )
Epeak [keV] : 25.0229      ( -23.9781 6.59726 )
Norm@50keV  : 2.07545    (     )
------------------------------------------------------------
# Chi-Squared =          60.13 using 59 PHA bins.
# Reduced chi-squared =          1.074 for     56 degrees of freedom
# Null hypothesis probability =   3.286382e-01

Photon flux (15-150 keV)    in 64 sec: 8.87741E-02 ( -0.0222024  0.0223599 ) ph/cm2/s
Energy fluence (15-150 keV)             : 2.31668e-07 ( -6.2544e-08  6.83949e-08 ) ergs/cm2
Band function

Time interval is from    0.000 sec. to   64.000 sec.

Spectral model in the Band function:
------------------------------------------------------------
Parameters  : value       lower 90%   higher 90%
alpha       : 1.25305   ( 1.66546   1.66546 )
beta        : -7.29190    ( 5.88034   15.6276 )
Epeak [keV] : 23.9073      ( -3.80813 6.29431 )
Norm@50keV   : 0.253198    ( -0.253225   64.7291 )
------------------------------------------------------------
# Chi-Squared =          60.14 using 59 PHA bins.
# Reduced chi-squared =          1.093 for     55 degrees of freedom
# Null hypothesis probability =   2.950510e-01

Photon flux (15-150 keV)    in 64 sec:  (    ) ph/cm2/s
Energy fluence (15-150 keV)             : 0 ( 0  0 ) ergs/cm2
Single BB
Spectral model blackbody:
------------------------------------------------------------
Parameters  : value    Lower 90%  Upper 90%
kT [keV]    : 6.26634  (-1.31728  1.53415)
R^2/D10^2   : 0.296169  (-0.181459   0.524495)
(R is the radius in km and D10 is the distance to the source in units of 10 kpc)
------------------------------------------------------------
# Chi-Squared =          60.06 using 59 PHA bins.
# Reduced chi-squared =          1.054 for     57 degrees of freedom
# Null hypothesis probability =   3.655156e-01

Energy  Fluence     90% Error
[keV]   [erg/cm2]   [erg/cm2]
15- 25  1.050e-07   6.174e-08
25- 50  1.149e-07   7.014e-08
50-150  1.253e-08   1.009e-08
15-150  2.324e-07   1.405e-07
Thermal bremsstrahlung (OTTB)

Spectral model: thermal bremsstrahlung
------------------------------------------------------------
Parameters  : value         Lower 90%    Upper 90%
kT [keV]    : 21.2806       (-8.36563      16.196)
Norm        : 1.04439       (-0.458572     0.859892)
------------------------------------------------------------
# Chi-Squared =          61.97 using 59 PHA bins.
# Reduced chi-squared =          1.087 for     57 degrees of freedom
# Null hypothesis probability =   3.033183e-01

Energy  Fluence     90% Error
[keV]   [erg/cm2]   [erg/cm2]
15- 25  1.091e-07   4.919e-08
25- 50  1.001e-07   5.737e-08
50-150  3.320e-08   2.818e-08
15-150  2.423e-07   1.108e-07
Double BB

------------------------------------------------------------
Parameters  : value         Lower 90%    Upper 90%
kT1 [keV]   : 199.894        (      )
R1^2/D10^2  : 1.77213E-06        (-1.77213e-06      2.49895e-05)
kT2 [keV]   : 6.20067        (-1.29765      1.54679)
R2^2/D10^2  : 0.307362    (-0.187812   0.560203)
------------------------------------------------------------
# Chi-Squared =          60.06 using 59 PHA bins.
# Chi-Squared =          59.89 using 59 PHA bins.
# Reduced chi-squared =          1.092 for     55 degrees of freedom
# Reduced chi-squared =          1.089 for     55 degrees of freedom
# Null hypothesis probability =   2.973831e-01
# Null hypothesis probability =   3.027245e-01

Energy  Fluence     90% Error
[keV]   [erg/cm2]   [erg/cm2]
15- 25  1.054e-07   1.681e-02
25- 50  1.167e-07   1.399e-01
50-150  1.301e-08   4.048e+00
15-150  2.351e-07   3.584e+00
Pre-slew spectrum (Pre-slew PHA with pre-slew DRM)
Power-law model

Spectral model in power-law:
------------------------------------------------------------
Parameters  : value       lower 90%   higher 90%
Photon index: 2.75162     ( -0.535454   0.682223 )
Norm@50keV  : 3.91733E-04    ( -0.000189038   0.000205902 )
------------------------------------------------------------
# Chi-Squared =          64.19 using 59 PHA bins.
# Reduced chi-squared =          1.126 for     57 degrees of freedom
# Null hypothesis probability =   2.392156e-01

Photon flux (15-150 keV)    in 64 sec: 9.04974E-02 ( -0.0236242  0.0237284 ) ph/cm2/s
Energy fluence (15-150 keV)             : 2.71693e-07 ( -8.79469e-08  9.86464e-08 ) ergs/cm2
Cutoff power-law model
Spectral model in the cutoff power-law:
------------------------------------------------------------
Parameters  : value       lower 90%   higher 90%
Photon index: -2.55475     ( -6.80768   2.8487 )
Epeak [keV] : 25.0229      ( -23.9781 6.59726 )
Norm@50keV  : 2.07545    (     )
------------------------------------------------------------
# Chi-Squared =          60.13 using 59 PHA bins.
# Reduced chi-squared =          1.074 for     56 degrees of freedom
# Null hypothesis probability =   3.286382e-01

Photon flux (15-150 keV)    in 64 sec: 8.87741E-02 ( -0.0222024  0.0223599 ) ph/cm2/s
Energy fluence (15-150 keV)             : 2.31668e-07 ( -6.2544e-08  6.83949e-08 ) ergs/cm2
Band function

Spectral model in the Band function:
------------------------------------------------------------
Parameters  : value       lower 90%   higher 90%
alpha       : 1.25305   ( 1.66546   1.66546 )
beta        : -7.29190    ( 5.88034   15.6276 )
Epeak [keV] : 23.9073      ( -3.80813 6.29431 )
Norm@50keV   : 0.253198    ( -0.253225   64.7291 )
------------------------------------------------------------
# Chi-Squared =          60.14 using 59 PHA bins.
# Reduced chi-squared =          1.093 for     55 degrees of freedom
# Null hypothesis probability =   2.950510e-01

Photon flux (15-150 keV)    in 64 sec:  (    ) ph/cm2/s
Energy fluence (15-150 keV)             : 0 ( 0  0 ) ergs/cm2
S(25-50 keV) vs. S(50-100 keV) plot

S(25-50 keV)  = 9.13293e-08
S(50-100 keV) = 5.42447e-08
T90 vs. Hardness ratio plot

T90                                   = 64 sec.
Hardness ratio (energy fluence ratio) = 0.593946
Color vs. Color plot

Count Ratio  (25-50 keV) / (15-25 keV) = 1.02852
Count Ratio (50-100 keV) / (15-25 keV) = -0.138095
Mask shadow pattern

IMX = 7.652979257497855E-01, IMY = 2.202522741323250E-01
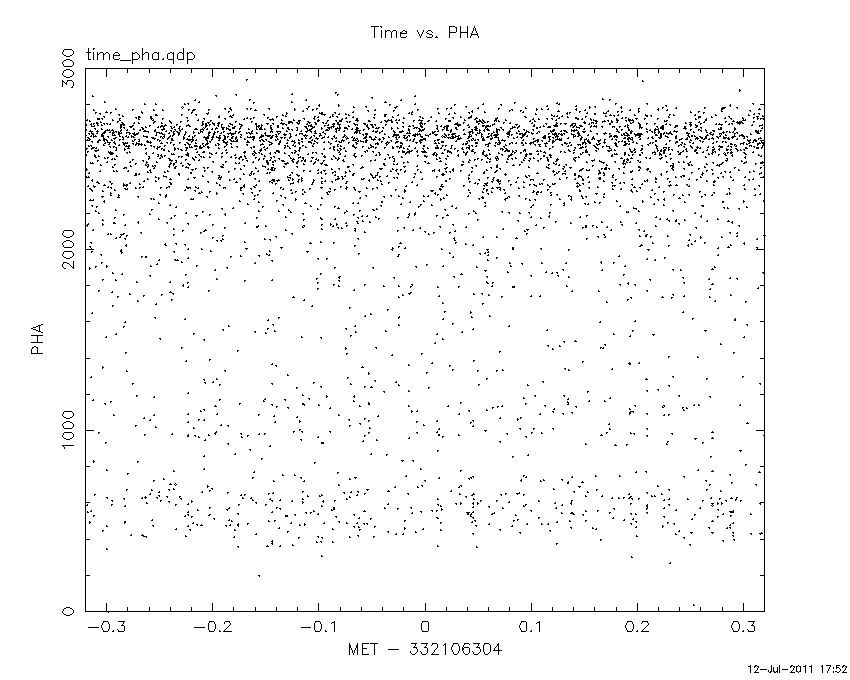
TIME vs. PHA plot around the trigger time
TIME vs. DetID plot around the trigger time

100 us light curve (15-350 keV)

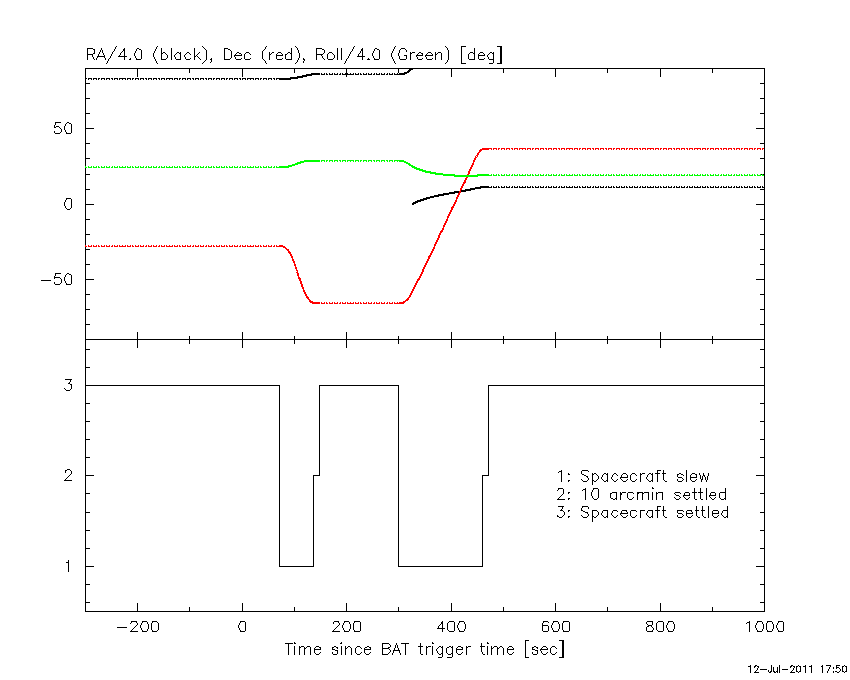
Spacecraft aspect plot
Bright source in the pre-burst/pre-slew/post-slew images
Pre-burst image of 15-350 keV band
Time interval of the image:
Pre-slew background subtracted image of 15-350 keV band
Time interval of the image:
0.000000 64.000000

# RAcent  DECcent POSerr Theta    Phi  PeakCts   SNR AngSep     Name
#  [deg]    [deg]    ['] [deg]  [deg]                   [']
286.2740 -28.2535    3.1  40.3   70.2   1.3416   3.8 ------	UNKNOWN
312.5259 -68.9742    2.3  42.7    2.3   0.7236   5.1 ------	UNKNOWN
344.4432 -65.6361    2.1  38.5  -16.1   0.6427   5.5 ------	UNKNOWN
  9.8176  10.0916    2.9  52.5 -138.9   1.8763   4.0 ------	UNKNOWN
Post-slew image of 15-350 keV band
Time interval of the image:
136.100620 243.097200

# RAcent  DECcent POSerr Theta    Phi  PeakCts   SNR AngSep     Name
#  [deg]    [deg]    ['] [deg]  [deg]                   [']
170.3145 -60.4808    4.9  53.8  -21.0   0.8094   2.4    8.5	Cen X-3
186.4688 -62.8626    6.3  50.5  -11.8  -0.4668  -1.8    7.6	GX 301-2
323.3216 -39.0412    2.9  29.2  120.4   0.7072   4.0 ------	UNKNOWN
  4.6258 -20.2996    2.5  47.2 -178.4   1.0392   4.6 ------	UNKNOWN
 11.4227 -29.7355    2.4  39.5 -166.3   0.7344   4.9 ------	UNKNOWN
 13.9392 -28.5606    2.6  41.3 -163.6   0.7334   4.4 ------	UNKNOWN
171.0988 -58.8531    2.8  55.4  -20.4   1.7650   4.1 ------	UNKNOWN
 73.8243 -55.7935    2.6  40.9  -83.7   2.3037   4.5 ------	UNKNOWN
103.4750 -61.8651    2.6  44.9  -60.3   2.1956   4.5 ------	UNKNOWN
Plot creation:
Tue Jul 12 17:52:17 EDT 2011