Special notes of this burst
Image
Pre-slew 15.0-350.0 keV image (Event data)
#   RAcent    DECcent   POSerr    Theta     Phi              Peak Cts       SNR   Name
   24.5780    34.5753   0.0119    43.5513   166.9462         2.8893371     16.163 TRIG_00457553

Foreground time interval of the image:
 -2.364  40.061 (delta_t =  42.425 [sec])
Background time interval of the image:
-239.040  -2.364 (delta_t = 236.676 [sec])
Lightcurves
Notes:
- 1) The mask-weighted light curves are using the flight position.
- 2) Multiple plots of different time binning/intervals are shown to cover all scenarios of short/long GRBs, rate/image triggers, and real/false positives.
- 3) For all the mask-weighted lightcurves, the y-axis units are counts/sec/det where a det is 0.4 x 0.4 = 0.16 sq cm.
- 4) The verticle lines correspond to following: green dotted lines are T50 interval, black dotted lines are T90 interval, blue solid line(s) is a spacecraft slew start time, and orange solid line(s) is a spacecraft slew end time.
- 5) Time of each bin is in the middle of the bin.
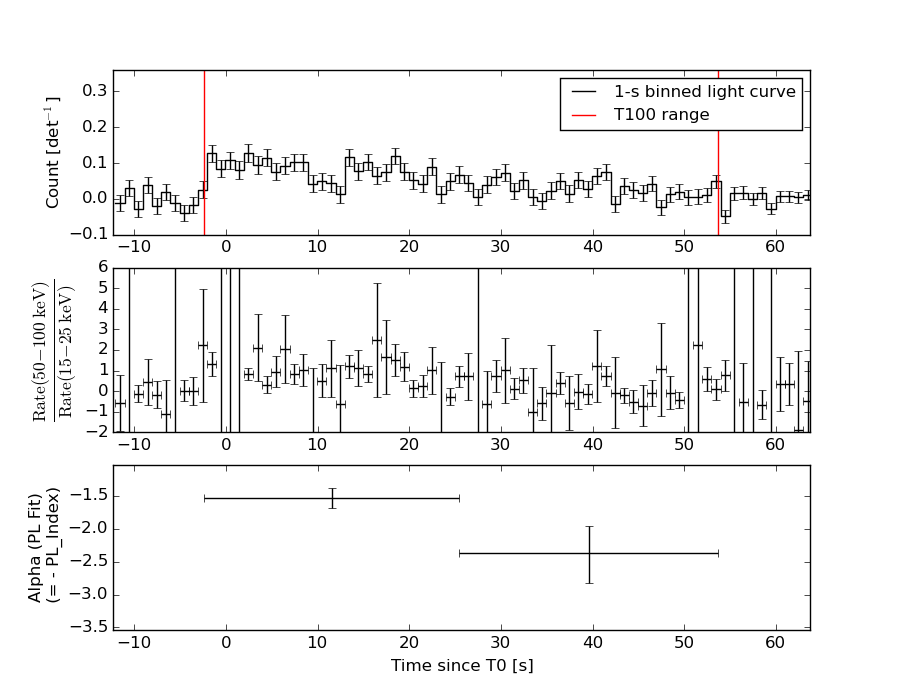
1 s binning
From T0-310 s to T0+310 s

From T100_start - 20 s to T100_end + 30 s

Full time interval
64 ms binning
Full time interval

From T100_start to T100_end
From T0-5 sec to T0+5 sec
16 ms binning
From T100_start-5 s to T100_start+5 s
Blue+Cyan dotted lines: Time interval of the scaled map
From 0.000000 to 3.072000
8 ms binning
From T100_start-3 s to T100_start+3 s

Blue+Cyan dotted lines: Time interval of the scaled map
From 0.000000 to 3.072000
2 ms binning
From T100_start-1 s to T100_start+1 s
Blue+Cyan dotted lines: Time interval of the scaled map
From 0.000000 to 3.072000
SN=5 or 10 sec. binning (whichever binning is satisfied first)

SN=5 or 10 sec. binning (T < 200 sec)

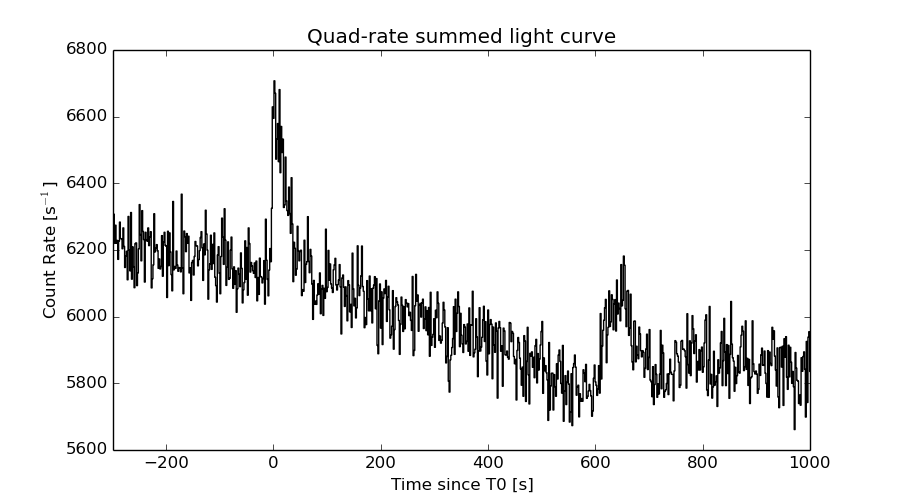
Quad-rate summed light curves (from T0-300s to T0+1000s)
Spectral Evolution
Spectra
Notes:
- 1) The fitting includes the systematic errors.
- 2) When the burst includes telescope slew time periods, the fitting uses an average response file made from multiple 5-s response files through out the slew time plus single time preiod for the non-slew times, and weighted by the total counts in the corresponding time period using addrmf. An average response file is needed becuase a spectral fit using the pre-slew DRM will introduce some errors in both a spectral shape and a normalization if the PHA file contains a lot of the slew/post-slew time interval.
- 3) For fits to more complicated models (e.g. a power-law over a cutoff power-law), the BAT team has decided to require a chi-square improvement of more than 6 for each extra dof.
Time averaged spectrum fit using the average DRM
Power-law model
Time interval is from   -2.364 sec. to   53.716 sec.

Spectral model in power-law:
------------------------------------------------------------
Parameters  : value       lower 90%   higher 90%
Photon index: 1.74211     ( -0.157552   0.16169 )
Norm@50keV  : 3.67986E-03    ( -0.000360298   0.000355666 )
------------------------------------------------------------
#Fit statistic : Chi-Squared =          45.88 using 59 PHA bins.
# Reduced chi-squared =         0.8049 for     57 degrees of freedom
# Null hypothesis probability =   8.541771e-01

Photon flux (15-150 keV)    in 56.08 sec: 0.496140 ( -0.044613  0.0446631 ) ph/cm2/s
Energy fluence (15-150 keV)             : 1.90511e-06 ( -1.9247e-07  1.94585e-07 ) ergs/cm2
Cutoff power-law model

Time interval is from   -2.364 sec. to   53.716 sec.
Spectral model in the cutoff power-law:
------------------------------------------------------------
Parameters  : value       lower 90%   higher 90%
Photon index: 1.40021     ( -0.685652   0.466372 )
Epeak [keV] : 81.3300      ( -22.3311 -81.3385 )
Norm@50keV  : 5.61964E-03    ( -0.00222579   0.00739574 )
------------------------------------------------------------
#Fit statistic : Chi-Squared =          44.94 using 59 PHA bins.
# Reduced chi-squared =         0.8024 for     56 degrees of freedom
# Null hypothesis probability =   8.552891e-01

Photon flux (15-150 keV)    in 56.08 sec: 0.488829 ( -0.023278  0.045945 ) ph/cm2/s
Energy fluence (15-150 keV)             : 1.84908e-06 ( -2.18275e-07  2.17809e-07 ) ergs/cm2
Band function
Time interval is from   -2.364 sec. to   53.716 sec.

Spectral model in the Band function:
------------------------------------------------------------
Parameters  : value       lower 90%   higher 90%
alpha       : 1.97194   ( -1.9755   -1.9755 )
beta        : -1.87501    ( -0.268066   0.215226 )
Epeak [keV] : 28.0712      ( -28.0494 120.556 )
Norm@50keV   : 1.83150    ( -1.88007   223.852 )
------------------------------------------------------------
#Fit statistic : Chi-Squared =          43.61 using 59 PHA bins.
# Reduced chi-squared =         0.7929 for     55 degrees of freedom
# Null hypothesis probability =   8.657589e-01

Photon flux (15-150 keV)    in 56.08 sec: 0.489246 (    ) ph/cm2/s
Energy fluence (15-150 keV)             : 1.85963e-06 ( -1.85924e-06  -1.9849e-07 ) ergs/cm2
Single BB

Spectral model blackbody:
------------------------------------------------------------
Parameters  : value    Lower 90%  Upper 90%
kT [keV]    : 11.8838  (-1.31506  1.51758)
R^2/D10^2   : 0.122807  (-0.0440205   0.0671505)
(R is the radius in km and D10 is the distance to the source in units of 10 kpc)
------------------------------------------------------------
#Fit statistic : Chi-Squared =          73.42 using 59 PHA bins.
# Reduced chi-squared =          1.288 for     57 degrees of freedom
# Null hypothesis probability =   7.050990e-02

Energy  Fluence     90% Error
[keV]   [erg/cm2]   [erg/cm2]
15- 25  2.055e-07   3.513e-08
25- 50  6.394e-07   7.327e-08
50-150  5.394e-07   1.187e-07
15-150  1.384e-06   1.581e-07
Thermal bremsstrahlung (OTTB)

Spectral model: thermal bremsstrahlung
------------------------------------------------------------
Parameters  : value         Lower 90%    Upper 90%
kT [keV]    : 113.935       (-33.1815      67.9389)
Norm        : 2.13641       (-0.246945     0.281136)
------------------------------------------------------------
#Fit statistic : Chi-Squared =          44.98 using 59 PHA bins.
# Reduced chi-squared =         0.7891 for     57 degrees of freedom
# Null hypothesis probability =   8.754938e-01

Energy  Fluence     90% Error
[keV]   [erg/cm2]   [erg/cm2]
15- 25  3.126e-07   4.071e-08
25- 50  5.542e-07   6.222e-08
50-150  9.635e-07   3.775e-07
15-150  1.830e-06   4.212e-07
Double BB

Spectral model: bbodyrad<1> + bbodyrad<2>
------------------------------------------------------------
Parameters  : value         Lower 90%    Upper 90%
kT1 [keV]   : 7.28613        (-1.64771      1.71127)
R1^2/D10^2  : 0.546358        (-0.274342      0.752146)
kT2 [keV]   : 27.4347        (-8.01342      19.7631)
R2^2/D10^2  : 4.09765E-03    (-0.00337497   0.0111508)
------------------------------------------------------------
#Fit statistic : Chi-Squared =          43.60 using 59 PHA bins.
# Reduced chi-squared =         0.7927 for     55 degrees of freedom
# Null hypothesis probability =   8.660341e-01

Energy  Fluence     90% Error
[keV]   [erg/cm2]   [erg/cm2]
15- 25  3.004e-07   9.253e-08
25- 50  5.713e-07   1.747e-07
50-150  1.004e-06   5.036e-07
15-150  1.876e-06   6.581e-07
Peak spectrum fit
Power-law model

Time interval is from    2.016 sec. to    3.016 sec.

Spectral model in power-law:
------------------------------------------------------------
Parameters  : value       lower 90%   higher 90%
Photon index: 1.70554     ( -0.530289   0.617752 )
Norm@50keV  : 9.47512E-03    ( -0.00314478   0.00281424 )
------------------------------------------------------------
#Fit statistic : Chi-Squared =          48.33 using 59 PHA bins.
# Reduced chi-squared =         0.8478 for     57 degrees of freedom
# Null hypothesis probability =   7.865216e-01

Photon flux (15-150 keV)    in 1 sec: 1.26085 ( -0.339843  0.339893 ) ph/cm2/s
Energy fluence (15-150 keV)             : 8.76892e-08 ( -2.84951e-08  2.89883e-08 ) ergs/cm2
Cutoff power-law model

Time interval is from    2.016 sec. to    3.016 sec.
Spectral model in the cutoff power-law:
------------------------------------------------------------
Parameters  : value       lower 90%   higher 90%
Photon index: 2.57801     (     )
Epeak [keV] : 196.829      (   )
Norm@50keV  : 3.48117E-03    (     )
------------------------------------------------------------
#Fit statistic : Chi-Squared =          47.44 using 59 PHA bins.
# Reduced chi-squared =         0.8472 for     56 degrees of freedom
# Null hypothesis probability =   7.851707e-01

Photon flux (15-150 keV)    in 1 sec: 1.25976 ( -0.336232  0.34013 ) ph/cm2/s
Energy fluence (15-150 keV)             : 8.7078e-08 ( -2.7731e-08  2.8788e-08 ) ergs/cm2
Band function
Time interval is from    2.016 sec. to    3.016 sec.

Spectral model in the Band function:
------------------------------------------------------------
Parameters  : value       lower 90%   higher 90%
alpha       : -1.98951   ( 1.98951   1.98951 )
beta        : -1.70558    ( 1.70558   0.530249 )
Epeak [keV] : 3.67704      ( -3.66608 -3.66608 )
Norm@50keV   : 9.60872E-03    ( -0.00278183   1.62283 )
------------------------------------------------------------
#Fit statistic : Chi-Squared =          48.33 using 59 PHA bins.
# Reduced chi-squared =         0.8786 for     55 degrees of freedom
# Null hypothesis probability =   7.256858e-01

Photon flux (15-150 keV)    in 1 sec:  (    ) ph/cm2/s
Energy fluence (15-150 keV)             : 0 ( 0  0 ) ergs/cm2
Single BB
Spectral model blackbody:
------------------------------------------------------------
Parameters  : value    Lower 90%  Upper 90%
kT [keV]    : 17.0935  (-7.55226  10.0528)
R^2/D10^2   : 8.31460E-02  (-0.0818969   0.533234)
(R is the radius in km and D10 is the distance to the source in units of 10 kpc)
------------------------------------------------------------
#Fit statistic : Chi-Squared =          57.14 using 59 PHA bins.
# Reduced chi-squared =          1.002 for     57 degrees of freedom
# Null hypothesis probability =   4.700326e-01

Energy  Fluence     90% Error
[keV]   [erg/cm2]   [erg/cm2]
15- 25  4.940e-09   3.114e-09
25- 50  2.195e-08   1.319e-08
50-150  4.588e-08   2.919e-08
15-150  7.278e-08   4.674e-08
Thermal bremsstrahlung (OTTB)

Spectral model: thermal bremsstrahlung
------------------------------------------------------------
Parameters  : value         Lower 90%    Upper 90%
kT [keV]    : 193.533       (-137.907      -191.45)
Norm        : 5.02227       (-1.3653     2.19718)
------------------------------------------------------------
#Fit statistic : Chi-Squared =          49.27 using 59 PHA bins.
# Reduced chi-squared =         0.8643 for     57 degrees of freedom
# Null hypothesis probability =   7.569920e-01

Energy  Fluence     90% Error
[keV]   [erg/cm2]   [erg/cm2]
15- 25  1.255e-08   7.465e-09
25- 50  2.407e-08   1.433e-08
50-150  5.226e-08   3.122e-08
15-150  8.888e-08   5.235e-08
Double BB

Spectral model: bbodyrad<1> + bbodyrad<2>
------------------------------------------------------------
Parameters  : value         Lower 90%    Upper 90%
kT1 [keV]   : 3.88697        (-1.58924      2.42705)
R1^2/D10^2  : 20.9873        (-18.7916      404.513)
kT2 [keV]   : 27.0891        (-10.1346      32.7189)
R2^2/D10^2  : 1.53762E-02    (-0.0137181   0.0401845)
------------------------------------------------------------
#Fit statistic : Chi-Squared =          45.41 using 59 PHA bins.
# Reduced chi-squared =         0.8257 for     55 degrees of freedom
# Null hypothesis probability =   8.182631e-01

Energy  Fluence     90% Error
[keV]   [erg/cm2]   [erg/cm2]
15- 25  1.846e-08   1.133e-08
25- 50  1.658e-08   8.805e-09
50-150  5.931e-08   3.725e-08
15-150  9.435e-08   5.145e-08
Pre-slew spectrum (Pre-slew PHA with pre-slew DRM)
Power-law model

Spectral model in power-law:
------------------------------------------------------------
Parameters  : value       lower 90%   higher 90%
Photon index: 1.64361     ( -0.149884   0.152763 )
Norm@50keV  : 4.43345E-03    ( -0.00041345   0.000410208 )
------------------------------------------------------------
#Fit statistic : Chi-Squared =          47.20 using 59 PHA bins.
# Reduced chi-squared =         0.8281 for     57 degrees of freedom
# Null hypothesis probability =   8.193125e-01

Photon flux (15-150 keV)    in 42.42 sec: 0.577686 ( -0.051679  0.0517492 ) ph/cm2/s
Energy fluence (15-150 keV)             : 1.75025e-06 ( -1.72586e-07  1.74159e-07 ) ergs/cm2
Cutoff power-law model

Spectral model in the cutoff power-law:
------------------------------------------------------------
Parameters  : value       lower 90%   higher 90%
Photon index: 0.873220     ( -0.743496   0.630046 )
Epeak [keV] : 69.8508      ( -15.5286 91.4759 )
Norm@50keV  : 1.12156E-02    ( -0.00587156   0.0159464 )
------------------------------------------------------------
#Fit statistic : Chi-Squared =          42.71 using 59 PHA bins.
# Reduced chi-squared =         0.7627 for     56 degrees of freedom
# Null hypothesis probability =   9.044361e-01

Photon flux (15-150 keV)    in 42.42 sec: 0.559160 ( -0.053911  0.053885 ) ph/cm2/s
Energy fluence (15-150 keV)             : 1.64994e-06 ( -1.90928e-07  1.9293e-07 ) ergs/cm2
Band function

Spectral model in the Band function:
------------------------------------------------------------
Parameters  : value       lower 90%   higher 90%
alpha       : -0.873102   ( -0.585854   0.577026 )
beta        : -10.0000    ( 10   0 )
Epeak [keV] : 69.8372      ( -14.0632 91.2968 )
Norm@50keV   : 1.12164E-02    ( -0.00587321   0.0159758 )
------------------------------------------------------------
#Fit statistic : Chi-Squared =          42.71 using 59 PHA bins.
# Reduced chi-squared =         0.7765 for     55 degrees of freedom
# Null hypothesis probability =   8.864192e-01

Photon flux (15-150 keV)    in 42.42 sec:  (    ) ph/cm2/s
Energy fluence (15-150 keV)             : 1.66508e-06 ( 0  0 ) ergs/cm2
S(25-50 keV) vs. S(50-100 keV) plot

S(25-50 keV)  = 5.25e-07
S(50-100 keV) = 6.27e-07
T90 vs. Hardness ratio plot

T90                                   = 41.227999985218 sec.
Hardness ratio (energy fluence ratio) = 1.19429
Color vs. Color plot

Count Ratio  (25-50 keV) / (15-25 keV) = 1.32095
Count Ratio (50-100 keV) / (15-25 keV) = 0.857754
Mask shadow pattern
IMX = -9.261000766324821E-01, IMY = -2.147233277370557E-01
TIME vs. PHA plot around the trigger time

Blue+Cyan dotted lines: Time interval of the scaled map
From 0.000000 to 3.072000
TIME vs. DetID plot around the trigger time

Blue+Cyan dotted lines: Time interval of the scaled map
From 0.000000 to 3.072000
100 us light curve (15-350 keV)

Blue+Cyan dotted lines: Time interval of the scaled map
From 0.000000 to 3.072000
Spacecraft aspect plot
Bright source in the pre-burst/pre-slew/post-slew images
Pre-burst image of 15-350 keV band
Time interval of the image:
-239.040000 -2.364000

# RAcent  DECcent POSerr Theta    Phi  PeakCts   SNR AngSep     Name
#  [deg]    [deg]    ['] [deg]  [deg]                   [']
 83.6306  22.0138    1.0  41.7 -111.1  10.0339  11.3    0.1	Crab
  7.0685  26.1634    2.3  49.6  144.6   5.3221   4.9 ------	UNKNOWN
 86.3766 -37.4145    2.0  49.0  -23.1   2.4962   5.7 ------	UNKNOWN
 96.0468 -20.4755    2.1  49.2  -48.2   5.5781   5.4 ------	UNKNOWN
Pre-slew background subtracted image of 15-350 keV band
Time interval of the image:
-2.364000 40.060600

# RAcent  DECcent POSerr Theta    Phi  PeakCts   SNR AngSep     Name
#  [deg]    [deg]    ['] [deg]  [deg]                   [']
 83.6700  21.9992   66.6  41.7 -111.1  -0.0547  -0.2    2.2	Crab
 24.5780  34.5753    0.7  43.6  166.9   2.8894  16.2 ------	UNKNOWN
 53.0237  46.8355    2.6  49.4 -159.8   0.7841   4.5 ------	UNKNOWN
Post-slew image of 15-350 keV band
Time interval of the image:
100.460600 567.260580

# RAcent  DECcent POSerr Theta    Phi  PeakCts   SNR AngSep     Name
#  [deg]    [deg]    ['] [deg]  [deg]                   [']
 53.5166  44.8928    2.5  24.4 -104.2   1.7021   4.6 ------	UNKNOWN
 85.1341  70.2417    3.6  47.9 -137.0   2.9407   3.2 ------	UNKNOWN
109.4127  77.4811    4.9  55.3 -145.2   5.5330   2.3 ------	UNKNOWN
Plot creation:
Sat May 30 21:58:31 EDT 2015