Special notes of this burst
Image
Pre-slew 15.0-350.0 keV image (Event data)
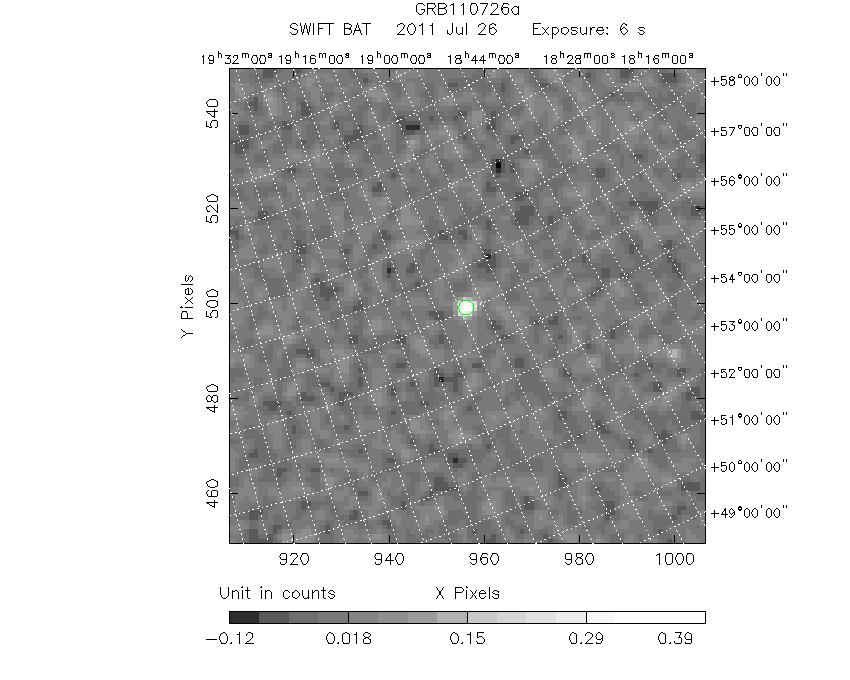
#   RAcent    DECcent   POSerr    Theta     Phi              Peak Cts       SNR   Name
  286.7130    56.0697   0.0131     9.5266  -163.6028         0.4344129     14.692 TRIG_00458059

Foreground time interval of the image:
 -0.864   5.012 (delta_t =   5.876 [sec])
Background time interval of the image:
-239.744  -0.864 (delta_t = 238.880 [sec])
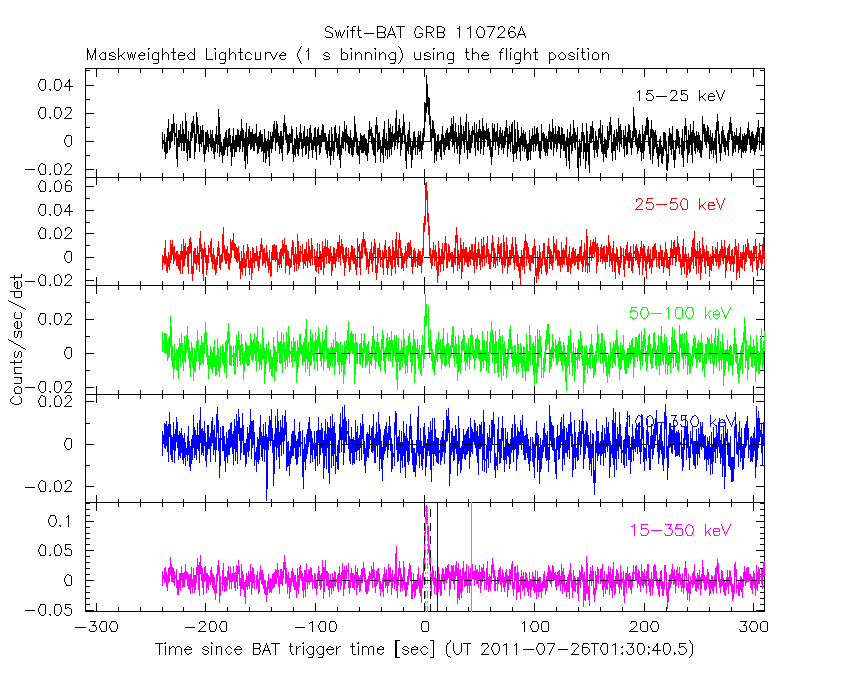
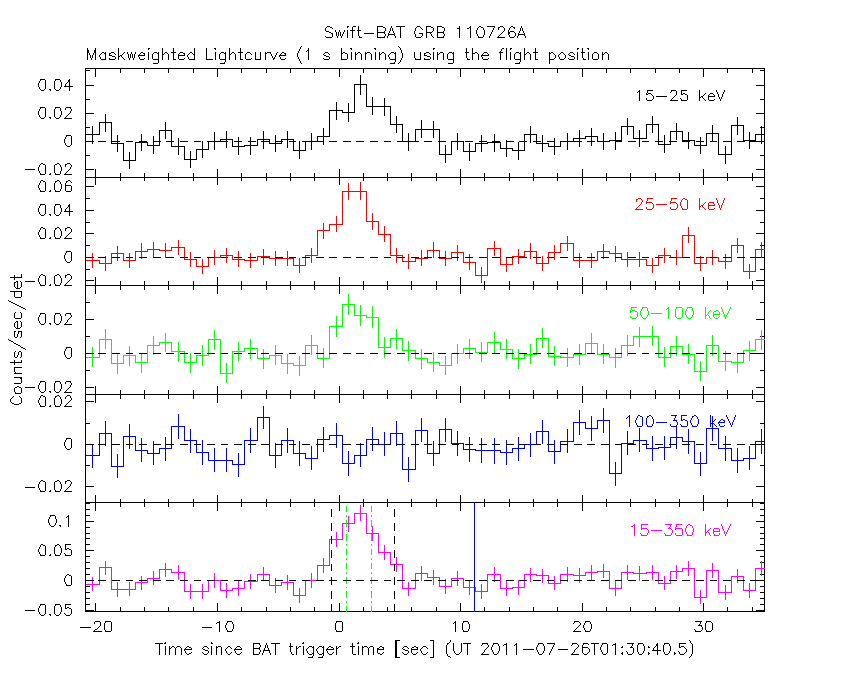
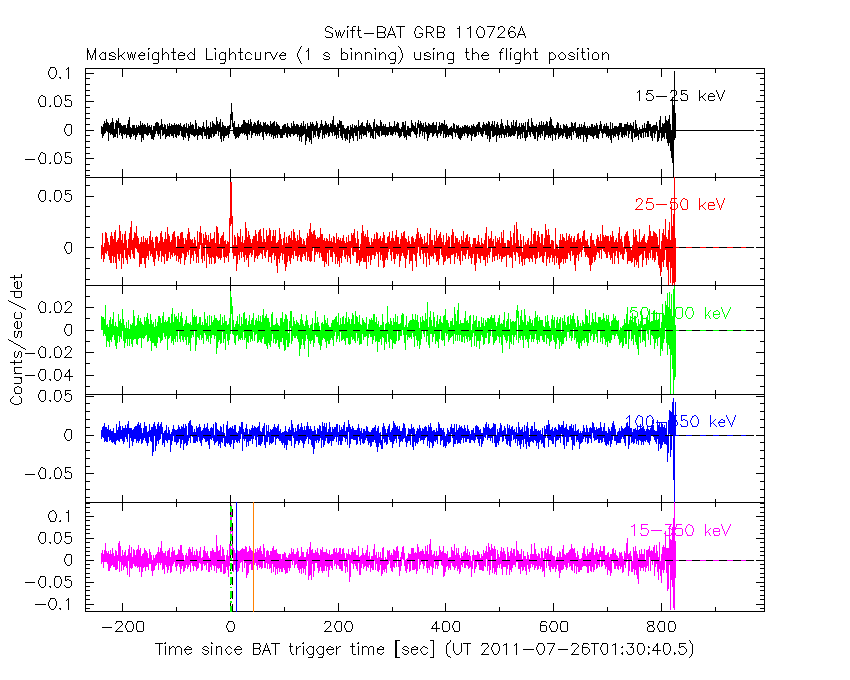
Lightcurves
Notes:
- 1) The mask-weighted light curves are using the flight position.
- 2) Multiple plots of different time binning/intervals are shown to cover all scenarios of short/long GRBs, rate/image triggers, and real/false positives.
- 3) For all the mask-weighted lightcurves, the y-axis units are counts/sec/det where a det is 0.4 x 0.4 = 0.16 sq cm.
- 4) The verticle lines correspond to following: green dotted lines are T50 interval, black dotted lines are T90 interval, blue solid line(s) is a spacecraft slew start time, and orange solid line(s) is a spacecraft slew end time.
- 5) Time of each bin is in the middle of the bin.
1 s binning
From T0-310 s to T0+310 s
From T100_start - 20 s to T100_end + 30 s
Full time interval
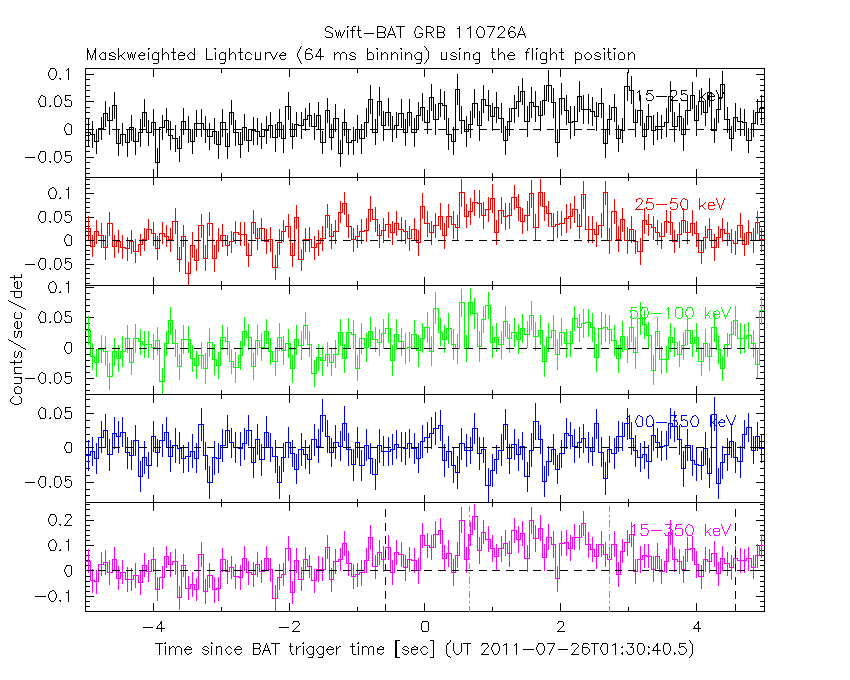
64 ms binning
Full time interval

From T100_start to T100_end
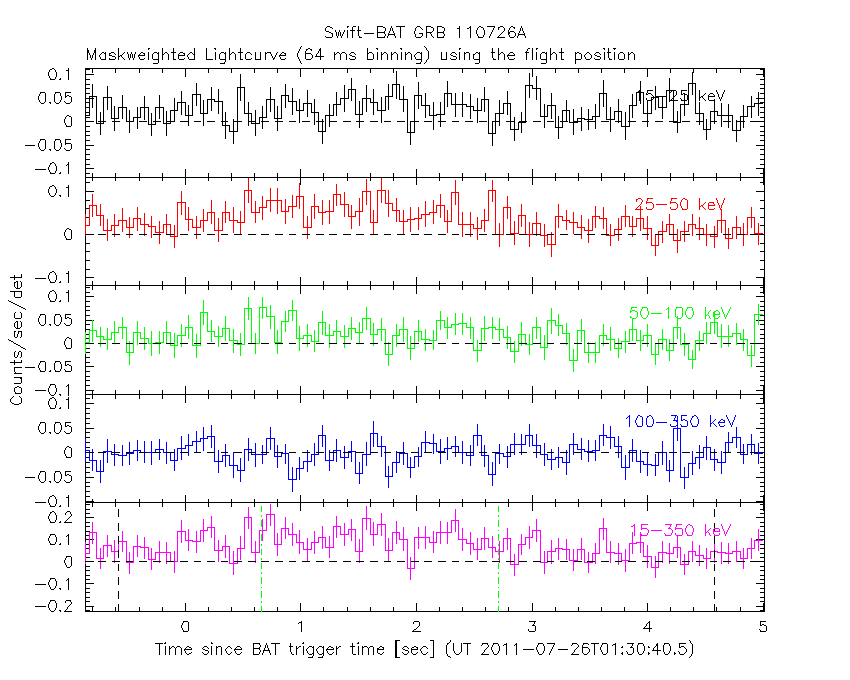
From T0-5 sec to T0+5 sec
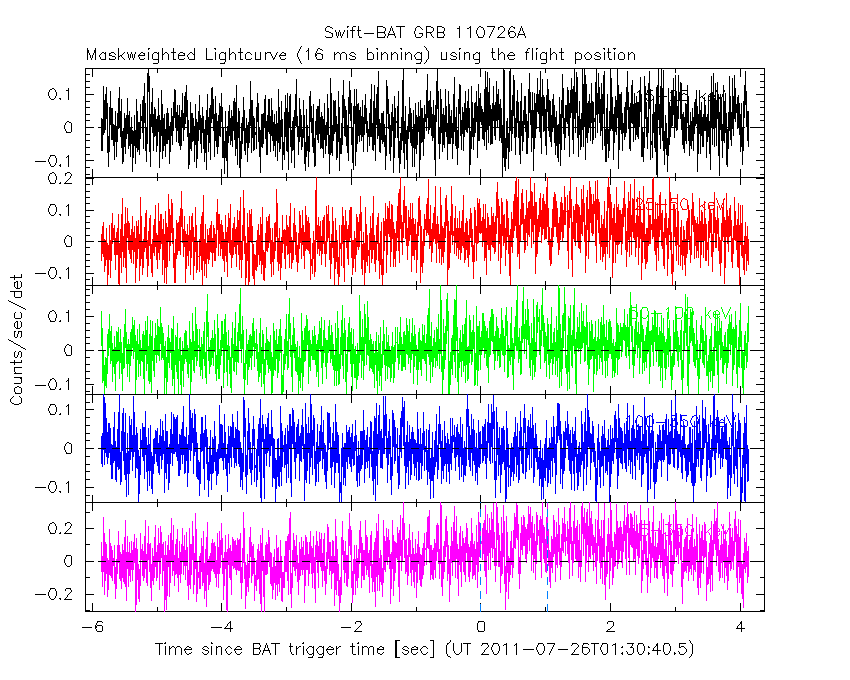
16 ms binning
From T100_start-5 s to T100_start+5 s
Blue+Cyan dotted lines: Time interval of the scaled map
From 0.000000 to 1.024000
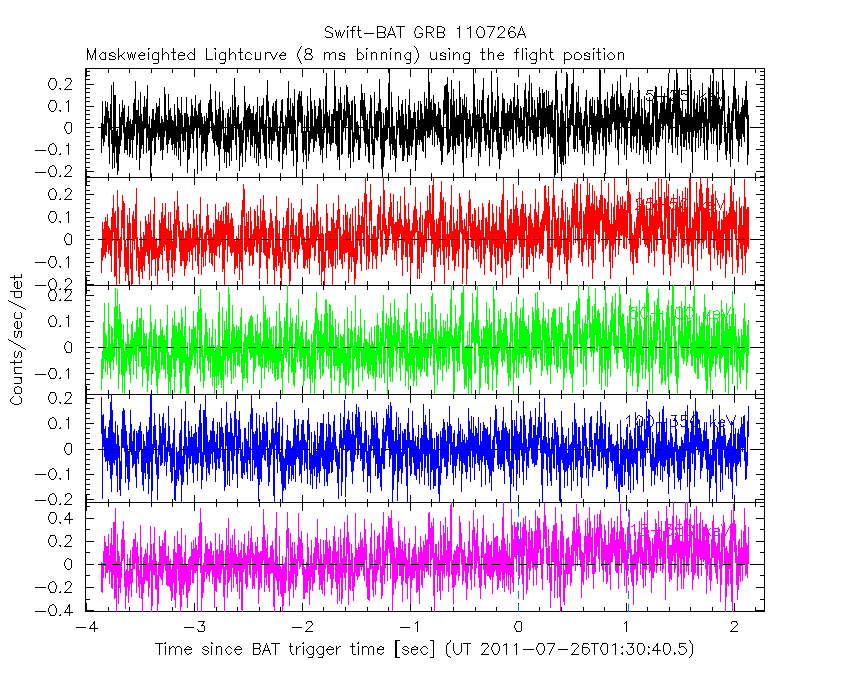
8 ms binning
From T100_start-3 s to T100_start+3 s
Blue+Cyan dotted lines: Time interval of the scaled map
From 0.000000 to 1.024000
2 ms binning
From T100_start-1 s to T100_start+1 s
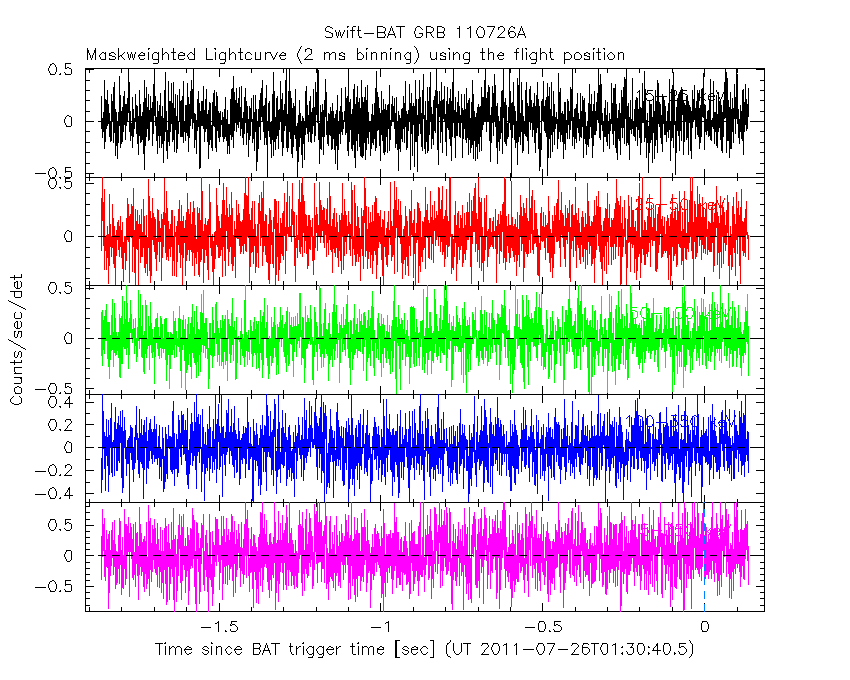
Blue+Cyan dotted lines: Time interval of the scaled map
From 0.000000 to 1.024000
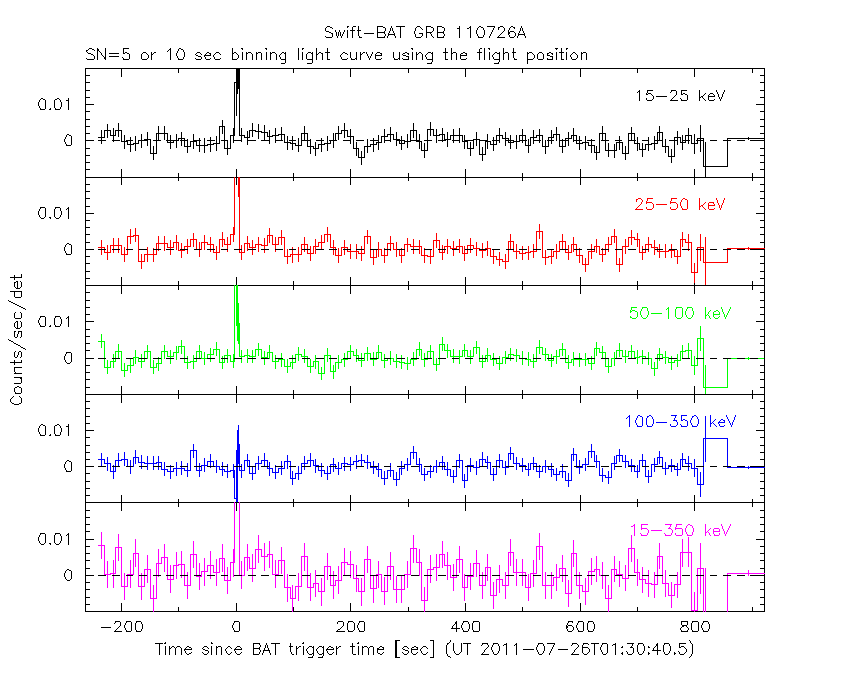
SN=5 or 10 sec. binning (whichever binning is satisfied first)
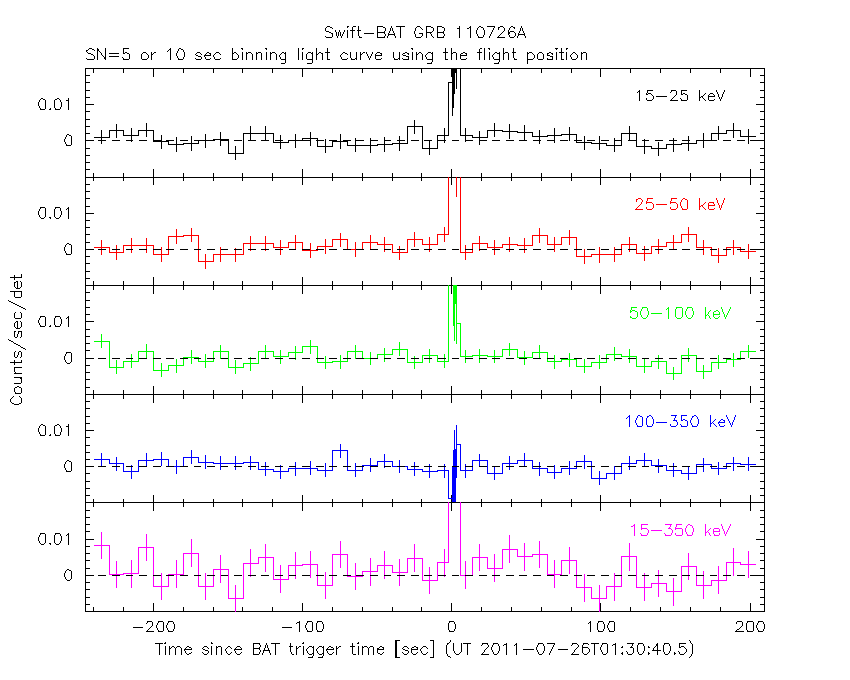
SN=5 or 10 sec. binning (T < 200 sec)
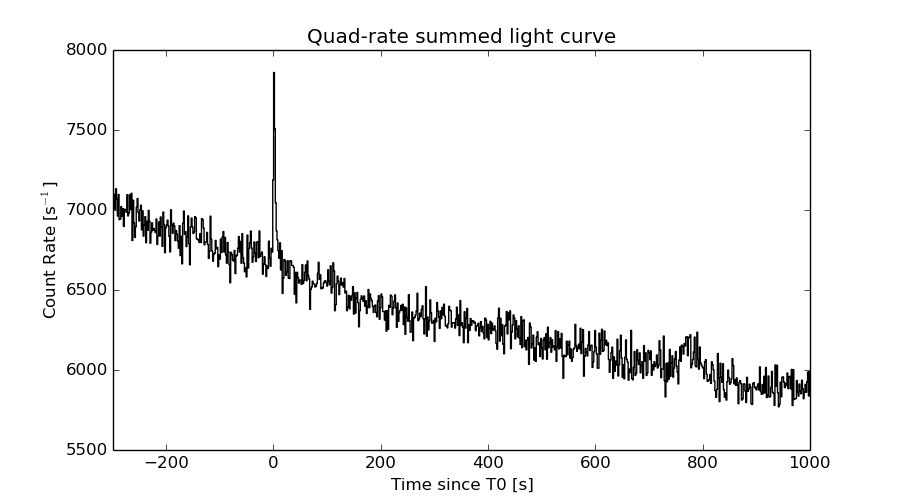
Quad-rate summed light curves (from T0-300s to T0+1000s)
The mask-weighted light curves based on cleaned DPHs

Spectral Evolution

Spectra
Notes:
- 1) The fitting includes the systematic errors.
- 2) When the burst includes telescope slew time periods, the fitting uses an average response file made from multiple 5-s response files through out the slew time plus single time preiod for the non-slew times, and weighted by the total counts in the corresponding time period using addrmf. An average response file is needed becuase a spectral fit using the pre-slew DRM will introduce some errors in both a spectral shape and a normalization if the PHA file contains a lot of the slew/post-slew time interval.
- 3) For fits to more complicated models (e.g. a power-law over a cutoff power-law), the BAT team has decided to require a chi-square improvement of more than 6 for each extra dof.
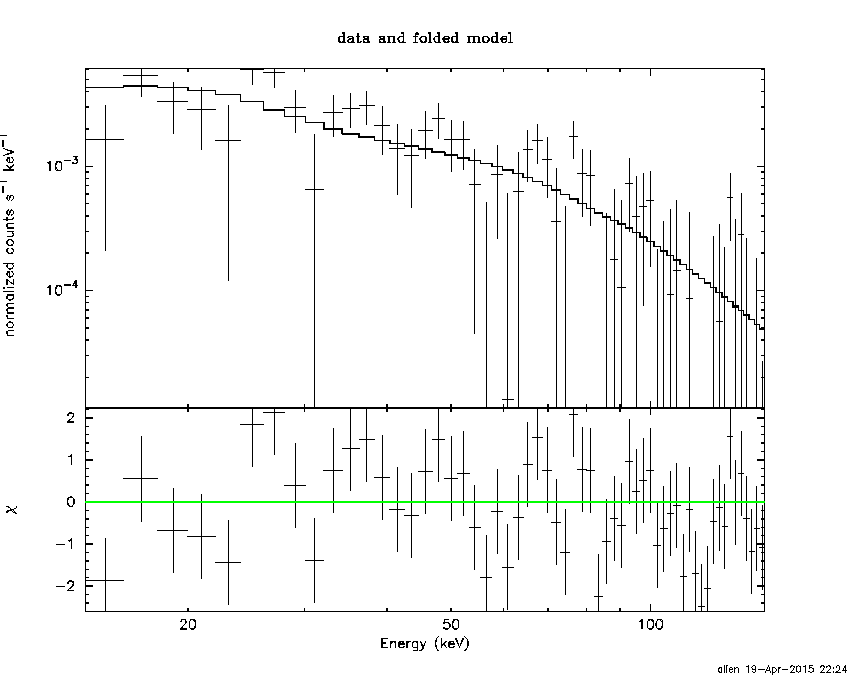
Time averaged spectrum fit using the average DRM
Power-law model
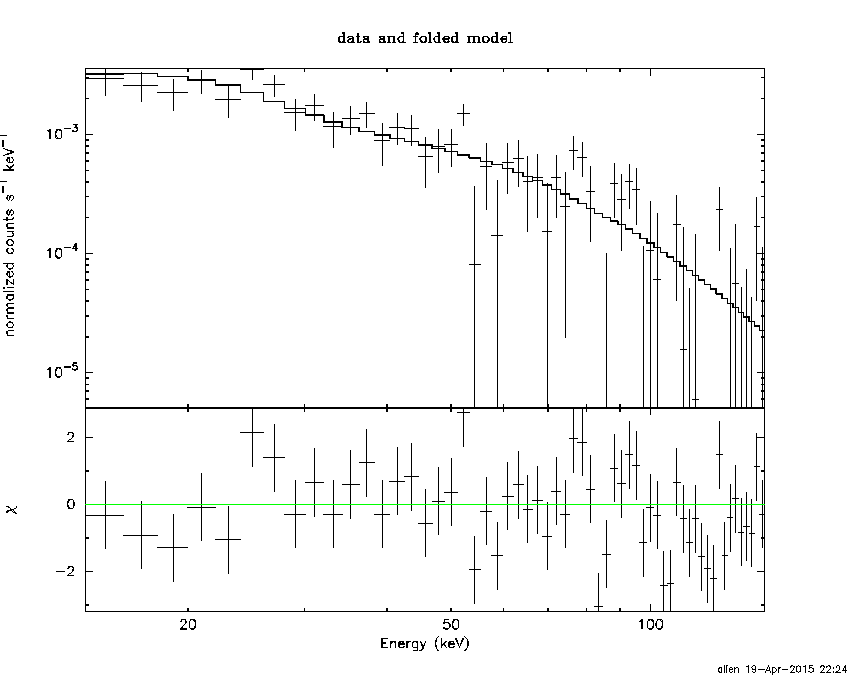
Time interval is from   -0.864 sec. to    5.012 sec.

Spectral model in power-law:
------------------------------------------------------------
Parameters  : value       lower 90%   higher 90%
Photon index: 1.85879     ( -0.173682   0.182257 )
Norm@50keV  : 4.53612E-03    ( -0.000555106   0.000545827 )
------------------------------------------------------------
#Fit statistic : Chi-Squared =          87.71 using 59 PHA bins.
# Reduced chi-squared =          1.539 for     57 degrees of freedom
# Null hypothesis probability =   5.559035e-03

Photon flux (15-150 keV)    in 5.876 sec: 0.639888 ( -0.0627806  0.0627814 ) ph/cm2/s
Energy fluence (15-150 keV)             : 2.45062e-07 ( -2.95783e-08  3.03203e-08 ) ergs/cm2
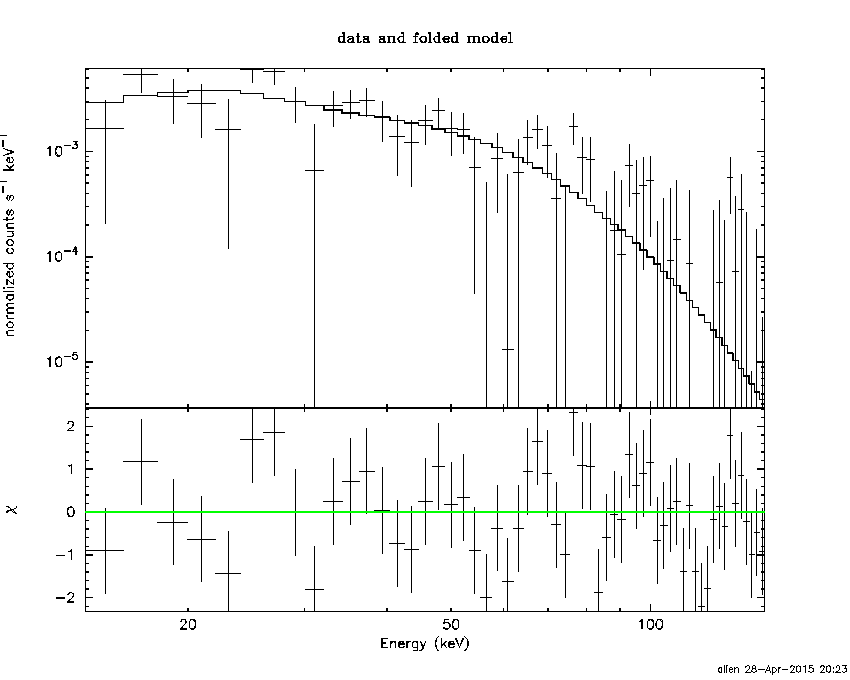
Cutoff power-law model

Time interval is from   -0.864 sec. to    5.012 sec.
Spectral model in the cutoff power-law:
------------------------------------------------------------
Parameters  : value       lower 90%   higher 90%
Photon index: 0.637790     ( -0.955678   0.779242 )
Epeak [keV] : 46.5334      ( -8.10926 15.5559 )
Norm@50keV  : 2.28581E-02    ( -0.0145744   0.0595655 )
------------------------------------------------------------
#Fit statistic : Chi-Squared =          79.85 using 59 PHA bins.
# Reduced chi-squared =          1.426 for     56 degrees of freedom
# Null hypothesis probability =   1.987724e-02

Photon flux (15-150 keV)    in 5.876 sec: 0.612647 ( -0.063998  0.06432 ) ph/cm2/s
Energy fluence (15-150 keV)             : 2.17839e-07 ( -3.03478e-08  3.29526e-08 ) ergs/cm2
Band function

Time interval is from   -0.864 sec. to    5.012 sec.

Spectral model in the Band function:
------------------------------------------------------------
Parameters  : value       lower 90%   higher 90%
alpha       : -0.637824   ( -0.604474   1.20743 )
beta        : -10.0000    ( 10   7.10543e-15 )
Epeak [keV] : 46.5249      ( -8.10809 15.5529 )
Norm@50keV   : 2.28574E-02    ( -0.014575   0.0597207 )
------------------------------------------------------------
#Fit statistic : Chi-Squared =          79.85 using 59 PHA bins.
# Reduced chi-squared =          1.452 for     55 degrees of freedom
# Null hypothesis probability =   1.594027e-02

Photon flux (15-150 keV)    in 5.876 sec: 0.618469 ( 6.38153  -0.070851 ) ph/cm2/s
Energy fluence (15-150 keV)             : 0 ( 0  0 ) ergs/cm2
Single BB
Spectral model blackbody:
------------------------------------------------------------
Parameters  : value    Lower 90%  Upper 90%
kT [keV]    : 10.5990  (-1.15317  1.31252)
R^2/D10^2   : 0.247834  (-0.0876467   0.133303)
(R is the radius in km and D10 is the distance to the source in units of 10 kpc)
------------------------------------------------------------
#Fit statistic : Chi-Squared =          90.90 using 59 PHA bins.
# Reduced chi-squared =          1.595 for     57 degrees of freedom
# Null hypothesis probability =   2.877044e-03

Energy  Fluence     90% Error
[keV]   [erg/cm2]   [erg/cm2]
15- 25  3.390e-08   5.870e-09
25- 50  9.130e-08   1.175e-08
50-150  5.625e-08   1.522e-08
15-150  1.814e-07   2.262e-08
Thermal bremsstrahlung (OTTB)
Spectral model: thermal bremsstrahlung
------------------------------------------------------------
Parameters  : value         Lower 90%    Upper 90%
kT [keV]    : 79.4955       (-21.7332      37.1399)
Norm        : 3.03731       (-0.408956     0.491776)
------------------------------------------------------------
#Fit statistic : Chi-Squared =          81.77 using 59 PHA bins.
# Reduced chi-squared =          1.435 for     57 degrees of freedom
# Null hypothesis probability =   1.740915e-02

Energy  Fluence     90% Error
[keV]   [erg/cm2]   [erg/cm2]
15- 25  4.629e-08   6.214e-09
25- 50  7.609e-08   8.755e-09
50-150  1.069e-07   4.865e-08
15-150  2.293e-07   4.842e-08
Double BB
Spectral model: bbodyrad<1> + bbodyrad<2>
------------------------------------------------------------
Parameters  : value         Lower 90%    Upper 90%
kT1 [keV]   : 6.25815        (-2.22849      2.10815)
R1^2/D10^2  : 1.02725        (-0.608158      3.50446)
kT2 [keV]   : 17.1842        (-4.39467      8.58459)
R2^2/D10^2  : 2.78467E-02    (-0.0231787   0.0762238)
------------------------------------------------------------
#Fit statistic : Chi-Squared =          79.01 using 59 PHA bins.
# Reduced chi-squared =          1.437 for     55 degrees of freedom
# Null hypothesis probability =   1.862346e-02

Energy  Fluence     90% Error
[keV]   [erg/cm2]   [erg/cm2]
15- 25  4.310e-08   2.322e-08
25- 50  8.012e-08   3.953e-08
50-150  9.657e-08   5.738e-08
15-150  2.198e-07   1.141e-07
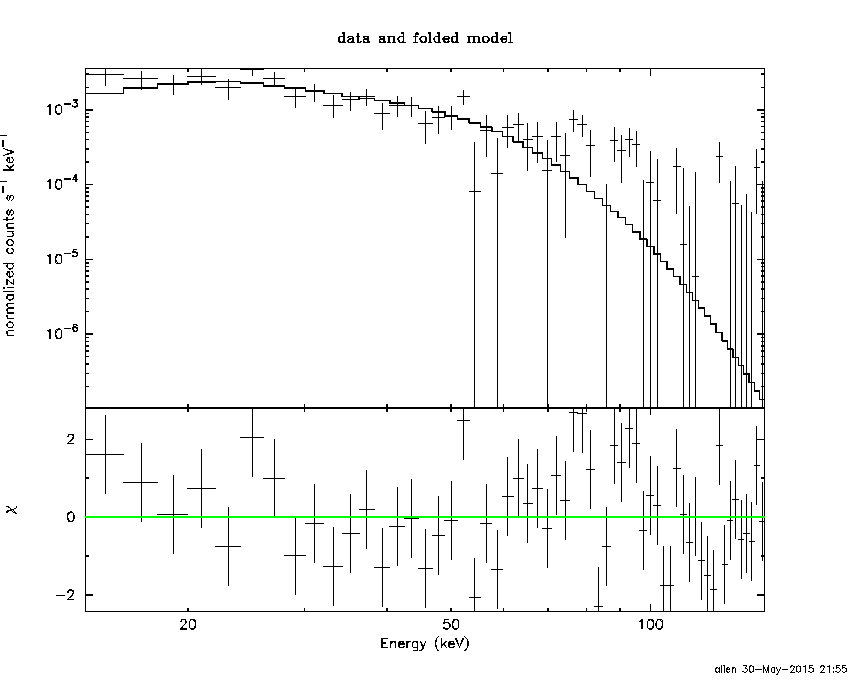
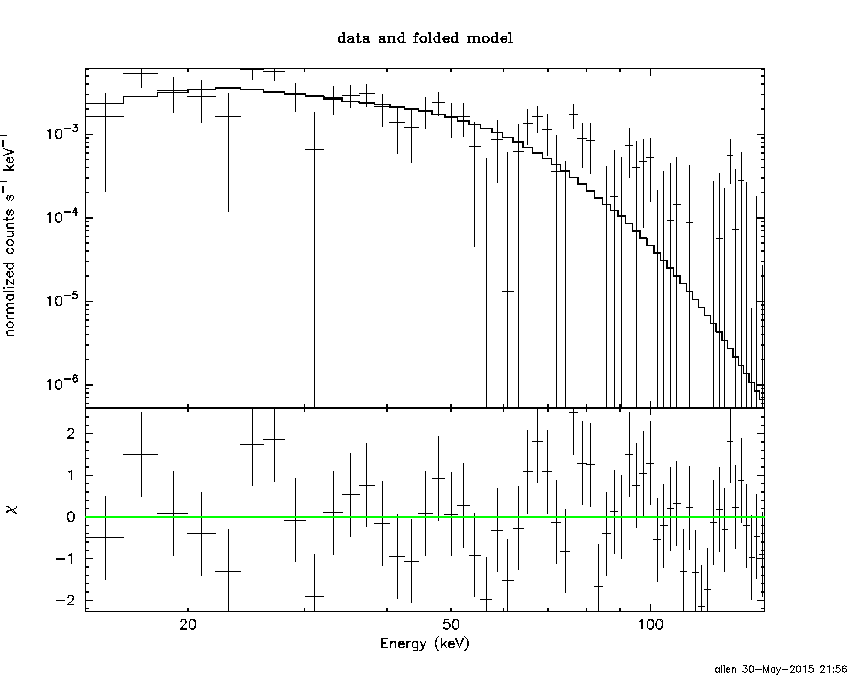
Peak spectrum fit
Power-law model
Time interval is from    0.612 sec. to    1.612 sec.

Spectral model in power-law:
------------------------------------------------------------
Parameters  : value       lower 90%   higher 90%
Photon index: 1.64607     ( -0.236566   0.244939 )
Norm@50keV  : 7.72695E-03    ( -0.00129603   0.00127831 )
------------------------------------------------------------
#Fit statistic : Chi-Squared =          75.33 using 59 PHA bins.
# Reduced chi-squared =          1.322 for     57 degrees of freedom
# Null hypothesis probability =   5.242713e-02

Photon flux (15-150 keV)    in 1 sec: 1.00764 ( -0.150357  0.150368 ) ph/cm2/s
Energy fluence (15-150 keV)             : 7.19009e-08 ( -1.26316e-08  1.30101e-08 ) ergs/cm2
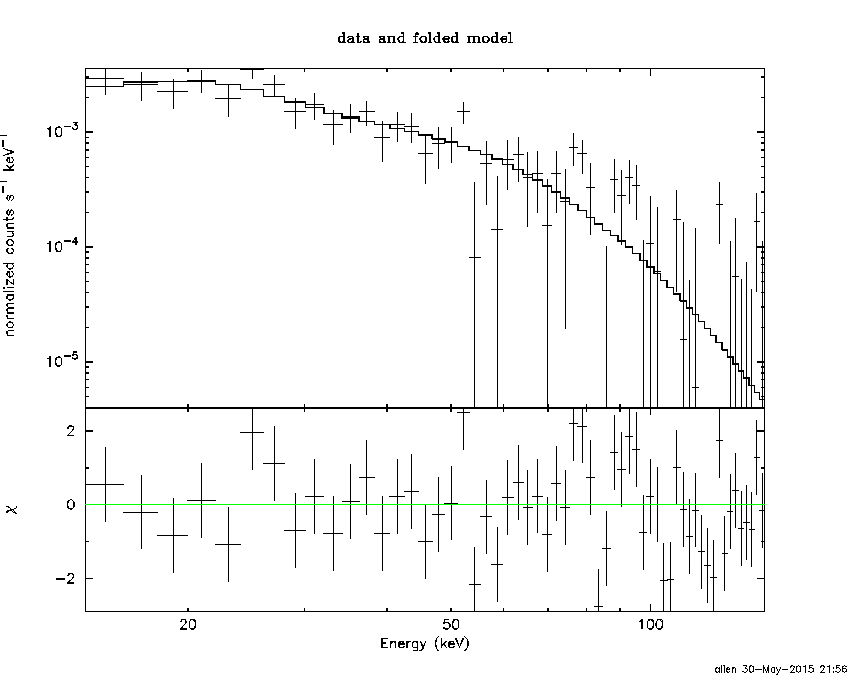
Cutoff power-law model
Time interval is from    0.612 sec. to    1.612 sec.
Spectral model in the cutoff power-law:
------------------------------------------------------------
Parameters  : value       lower 90%   higher 90%
Photon index: -0.324418     ( -1.73197   1.21815 )
Epeak [keV] : 49.9844      ( -8.95647 18.6769 )
Norm@50keV  : 0.102301    ( -0.102599   0.945388 )
------------------------------------------------------------
#Fit statistic : Chi-Squared =          66.31 using 59 PHA bins.
# Reduced chi-squared =          1.184 for     56 degrees of freedom
# Null hypothesis probability =   1.630521e-01

Photon flux (15-150 keV)    in 1 sec: 0.956231 ( -0.149972  0.151079 ) ph/cm2/s
Energy fluence (15-150 keV)             : 6.07506e-08 ( -1.18324e-08  1.34239e-08 ) ergs/cm2
Band function

Time interval is from    0.612 sec. to    1.612 sec.

Spectral model in the Band function:
------------------------------------------------------------
Parameters  : value       lower 90%   higher 90%
alpha       : 0.310700   ( -0.932365   2.17608 )
beta        : -10.0000    ( 10   5.32907e-15 )
Epeak [keV] : 50.0436      ( -9.06946 18.5859 )
Norm@50keV   : 0.100529    ( -0.100529   0.946965 )
------------------------------------------------------------
#Fit statistic : Chi-Squared =          66.31 using 59 PHA bins.
# Reduced chi-squared =          1.206 for     55 degrees of freedom
# Null hypothesis probability =   1.412820e-01

Photon flux (15-150 keV)    in 1 sec: 0.956186 ( 6.04381  -0.148778 ) ph/cm2/s
Energy fluence (15-150 keV)             : 0 ( 0  0 ) ergs/cm2
Single BB
Spectral model blackbody:
------------------------------------------------------------
Parameters  : value    Lower 90%  Upper 90%
kT [keV]    : 11.8613  (-1.68715  2.05716)
R^2/D10^2   : 0.276806  (-0.123617   0.209181)
(R is the radius in km and D10 is the distance to the source in units of 10 kpc)
------------------------------------------------------------
#Fit statistic : Chi-Squared =          67.99 using 59 PHA bins.
# Reduced chi-squared =          1.193 for     57 degrees of freedom
# Null hypothesis probability =   1.511285e-01

Energy  Fluence     90% Error
[keV]   [erg/cm2]   [erg/cm2]
15- 25  8.228e-09   2.212e-09
25- 50  2.554e-08   5.375e-09
50-150  2.144e-08   7.010e-09
15-150  5.521e-08   1.119e-08
Thermal bremsstrahlung (OTTB)

Spectral model: thermal bremsstrahlung
------------------------------------------------------------
Parameters  : value         Lower 90%    Upper 90%
kT [keV]    : 121.645       (-50.1151      -119.235)
Norm        : 4.32000       (-0.665246     0.925961)
------------------------------------------------------------
#Fit statistic : Chi-Squared =          71.49 using 59 PHA bins.
# Reduced chi-squared =          1.254 for     57 degrees of freedom
# Null hypothesis probability =   9.382851e-02

Energy  Fluence     90% Error
[keV]   [erg/cm2]   [erg/cm2]
15- 25  1.125e-08   5.517e-09
25- 50  2.017e-08   1.116e-08
50-150  3.623e-08   2.351e-08
15-150  6.764e-08   3.910e-08
Double BB

Spectral model: bbodyrad<1> + bbodyrad<2>
------------------------------------------------------------
Parameters  : value         Lower 90%    Upper 90%
kT1 [keV]   : 8.04026        (-8.06476      191.932)
R1^2/D10^2  : 0.612811        (-0.609089      -0.609089)
kT2 [keV]   : 17.7116        (-17.9541      -17.9541)
R2^2/D10^2  : 3.90392E-02    (-0.0367125   0.31202)
------------------------------------------------------------
#Fit statistic : Chi-Squared =          65.73 using 59 PHA bins.
# Reduced chi-squared =          1.195 for     55 degrees of freedom
# Null hypothesis probability =   1.523822e-01

Energy  Fluence     90% Error
[keV]   [erg/cm2]   [erg/cm2]
15- 25  9.655e-09   6.585e-09
25- 50  2.395e-08   1.428e-08
50-150  2.892e-08   1.780e-08
15-150  6.253e-08   3.674e-08
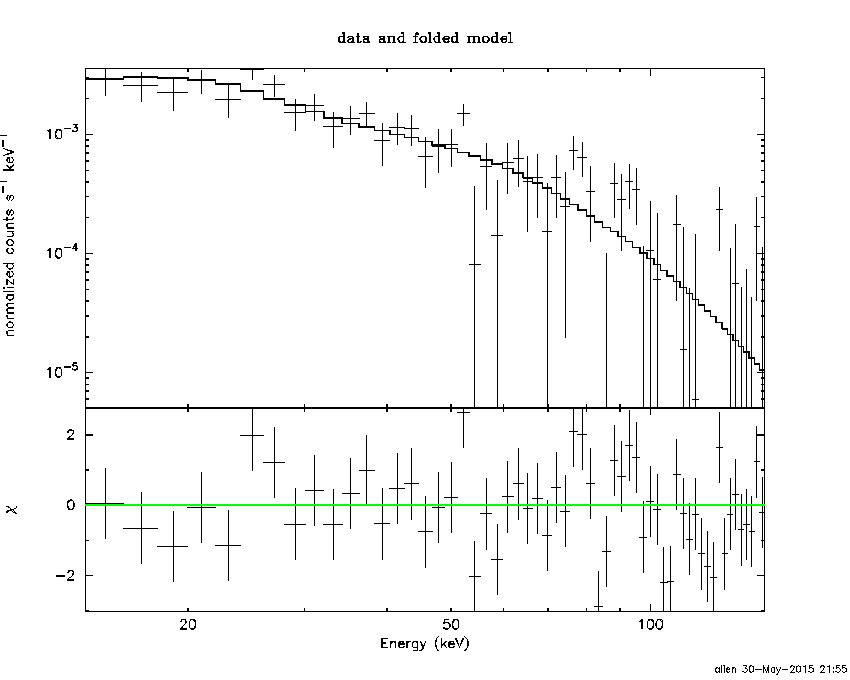
Pre-slew spectrum (Pre-slew PHA with pre-slew DRM)
Power-law model

Spectral model in power-law:
------------------------------------------------------------
Parameters  : value       lower 90%   higher 90%
Photon index: 1.85879     ( -0.173682   0.182257 )
Norm@50keV  : 4.53612E-03    ( -0.000555106   0.000545827 )
------------------------------------------------------------
#Fit statistic : Chi-Squared =          87.71 using 59 PHA bins.
# Reduced chi-squared =          1.539 for     57 degrees of freedom
# Null hypothesis probability =   5.559035e-03

Photon flux (15-150 keV)    in 5.876 sec: 0.639888 ( -0.0627806  0.0627814 ) ph/cm2/s
Energy fluence (15-150 keV)             : 2.45062e-07 ( -2.95783e-08  3.03203e-08 ) ergs/cm2
Cutoff power-law model

Spectral model in the cutoff power-law:
------------------------------------------------------------
Parameters  : value       lower 90%   higher 90%
Photon index: 0.637790     ( -0.955678   0.779242 )
Epeak [keV] : 46.5334      ( -8.10926 15.5559 )
Norm@50keV  : 2.28581E-02    ( -0.0145744   0.0595655 )
------------------------------------------------------------
#Fit statistic : Chi-Squared =          79.85 using 59 PHA bins.
# Reduced chi-squared =          1.426 for     56 degrees of freedom
# Null hypothesis probability =   1.987724e-02

Photon flux (15-150 keV)    in 5.876 sec: 0.612647 ( -0.063998  0.06432 ) ph/cm2/s
Energy fluence (15-150 keV)             : 2.17839e-07 ( -3.03478e-08  3.29526e-08 ) ergs/cm2
Band function
Spectral model in the Band function:
------------------------------------------------------------
Parameters  : value       lower 90%   higher 90%
alpha       : -0.637824   ( -0.604474   1.20743 )
beta        : -10.0000    ( 10   1.77636e-15 )
Epeak [keV] : 46.5249      ( -8.10809 15.5529 )
Norm@50keV   : 2.28574E-02    ( -0.014575   0.0597207 )
------------------------------------------------------------
#Fit statistic : Chi-Squared =          79.85 using 59 PHA bins.
# Reduced chi-squared =          1.452 for     55 degrees of freedom
# Null hypothesis probability =   1.594027e-02

Photon flux (15-150 keV)    in 5.876 sec: 0.618469 ( 6.38153  -0.070851 ) ph/cm2/s
Energy fluence (15-150 keV)             : 0 ( 0  0 ) ergs/cm2
S(25-50 keV) vs. S(50-100 keV) plot

S(25-50 keV)  = 7.05e-08
S(50-100 keV) = 7.77e-08
T90 vs. Hardness ratio plot
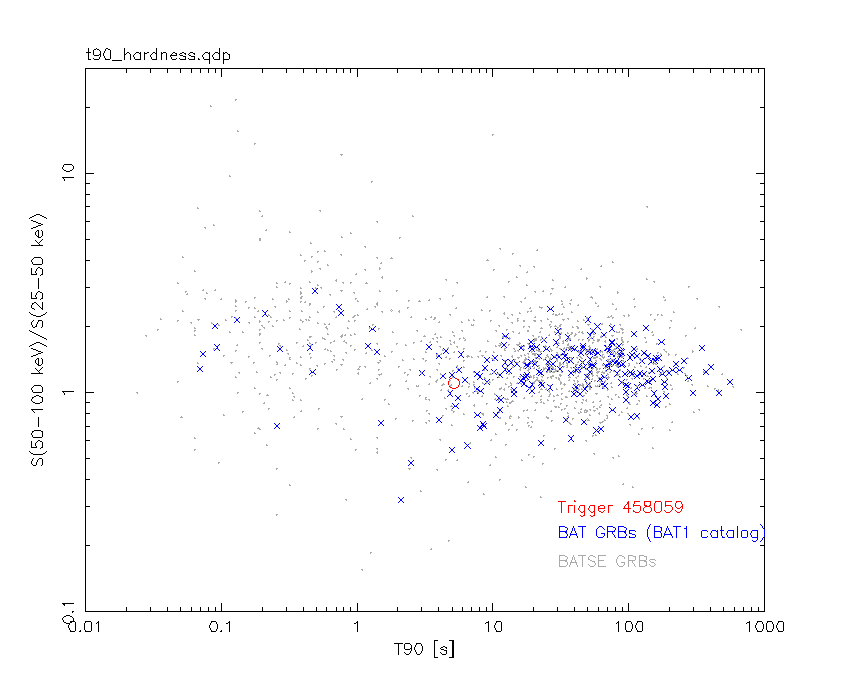
T90                                   = 5.15599995851517 sec.
Hardness ratio (energy fluence ratio) = 1.10213
Color vs. Color plot

Count Ratio  (25-50 keV) / (15-25 keV) = 1.34712
Count Ratio (50-100 keV) / (15-25 keV) = 0.686828
Mask shadow pattern
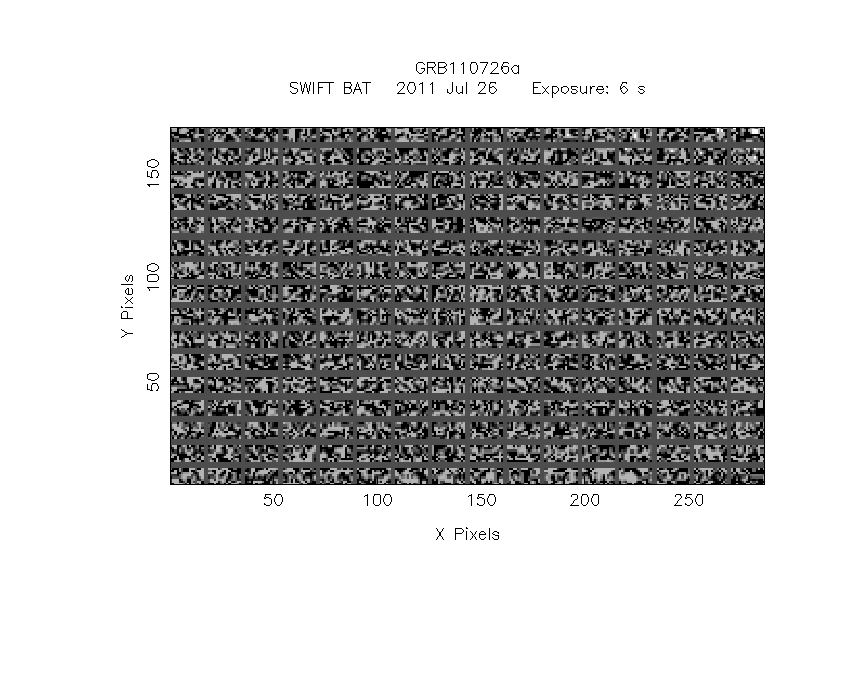
IMX = -1.609943794173015E-01, IMY = 4.737474650099357E-02
TIME vs. PHA plot around the trigger time
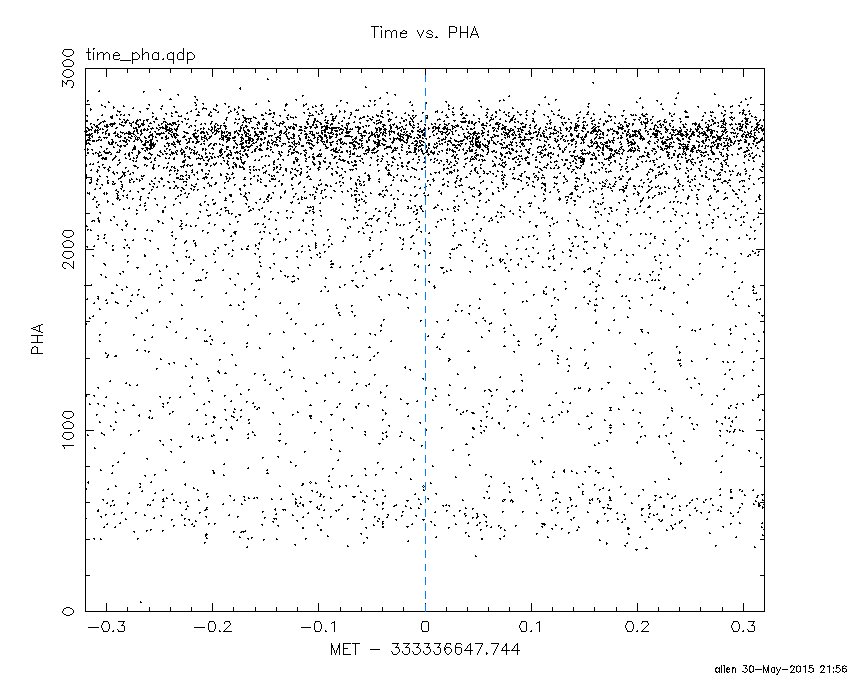
Blue+Cyan dotted lines: Time interval of the scaled map
From 0.000000 to 1.024000
TIME vs. DetID plot around the trigger time
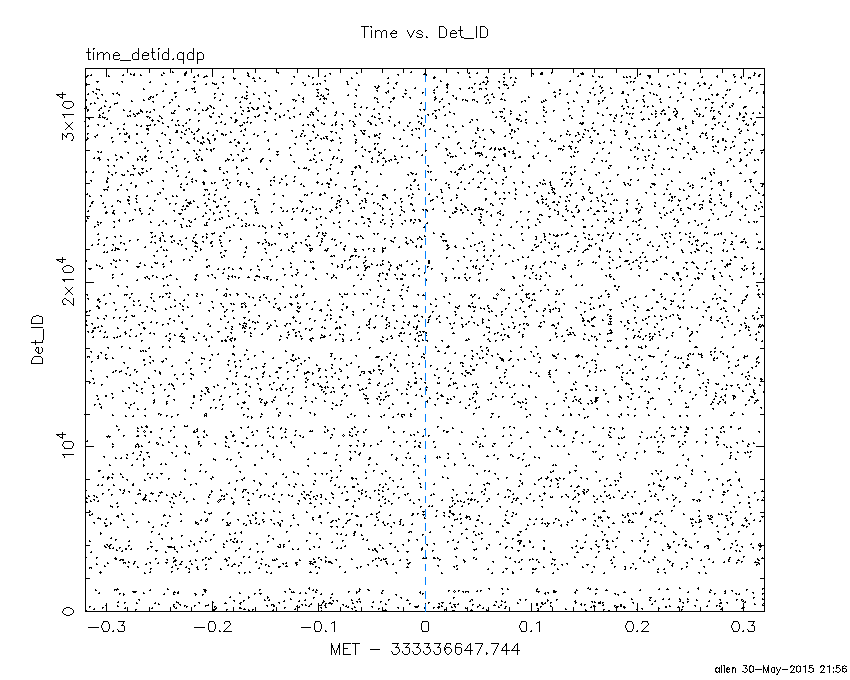
Blue+Cyan dotted lines: Time interval of the scaled map
From 0.000000 to 1.024000
100 us light curve (15-350 keV)
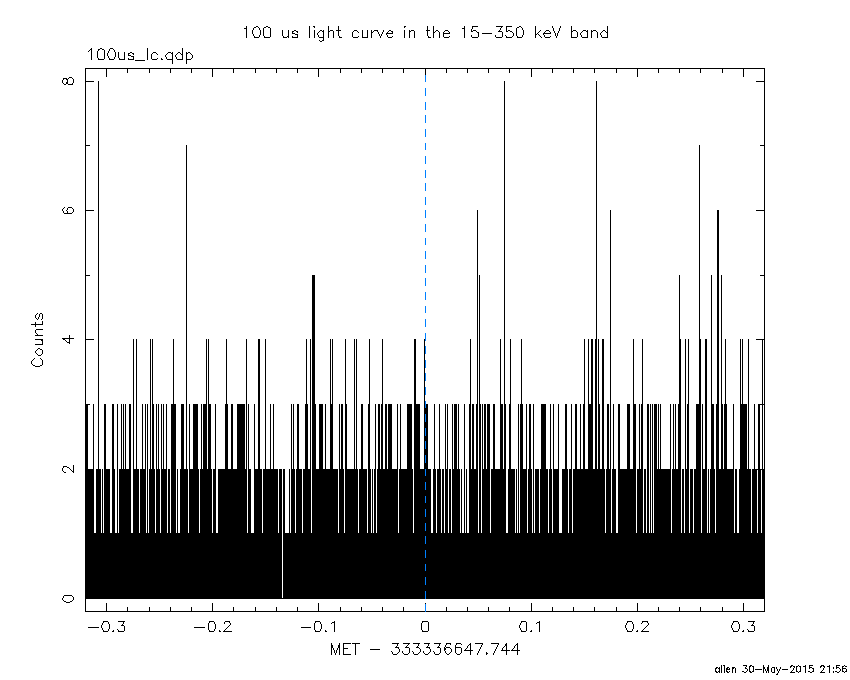
Blue+Cyan dotted lines: Time interval of the scaled map
From 0.000000 to 1.024000
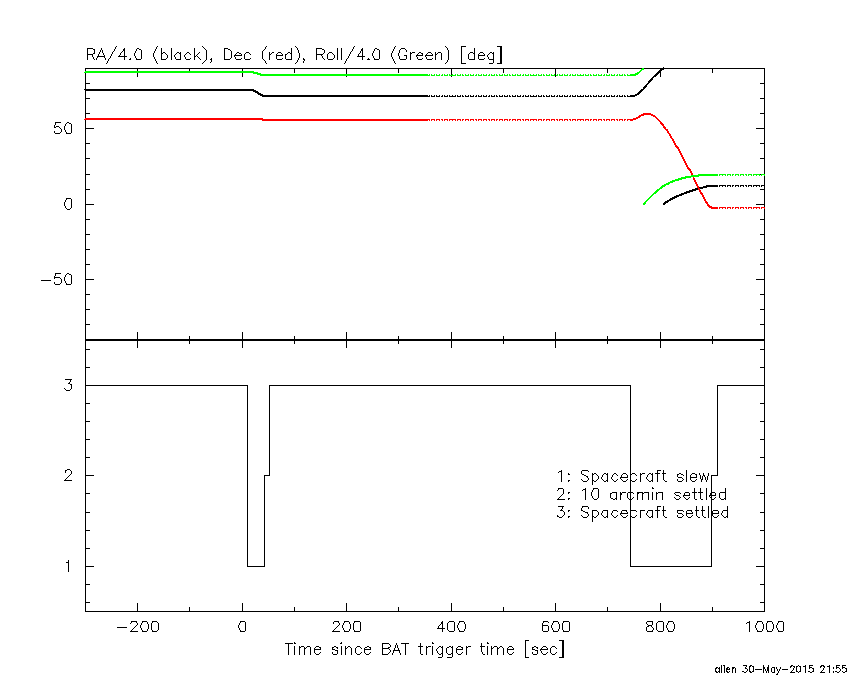
Spacecraft aspect plot
Bright source in the pre-burst/pre-slew/post-slew images
Pre-burst image of 15-350 keV band
Time interval of the image:
-239.744000 -0.864000

# RAcent  DECcent POSerr Theta    Phi  PeakCts   SNR AngSep     Name
#  [deg]    [deg]    ['] [deg]  [deg]                   [']
254.5628  35.3538   10.3  39.0  178.8  -0.4420  -1.1    5.2	Her X-1
299.5881  35.1897    0.4  21.2  109.5   9.2091  29.4    0.7	Cyg X-1
308.1466  40.8778    2.9  15.5   87.6   1.0248   3.9    4.8	Cyg X-3
326.1796  38.2292    6.6  23.3   50.7   0.5240   1.8    5.6	Cyg X-2
  5.9879  54.7754    3.7  34.0  -14.6   0.9265   3.1 ------	UNKNOWN
224.1782  31.5250    3.4  58.7 -159.1   6.6531   3.4 ------	UNKNOWN
Pre-slew background subtracted image of 15-350 keV band
Time interval of the image:
-0.864000 5.012000

# RAcent  DECcent POSerr Theta    Phi  PeakCts   SNR AngSep     Name
#  [deg]    [deg]    ['] [deg]  [deg]                   [']
254.3950  35.3527    4.1  39.1  179.0  -0.1262  -2.8    3.1	Her X-1
299.6568  35.3126    7.9  21.0  109.3  -0.0574  -1.5    7.4	Cyg X-1
308.2319  41.0237    4.8  15.4   87.2  -0.0863  -2.4    7.0	Cyg X-3
325.9986  38.3773    3.4  23.1   50.8   0.1288   3.4    8.8	Cyg X-2
286.7130  56.0697    0.8   9.5 -163.6   0.4344  14.7 ------	UNKNOWN
 19.0693  44.5821    2.2  46.8   -9.4   0.2953   5.2 ------	UNKNOWN
330.7708  70.2832    2.6  18.3  -51.1   0.1378   4.5 ------	UNKNOWN
 71.2681  76.4801    2.6  43.2  -64.5   0.4866   4.4 ------	UNKNOWN
Post-slew image of 15-350 keV band
Time interval of the image:
42.156600 742.956620

# RAcent  DECcent POSerr Theta    Phi  PeakCts   SNR AngSep     Name
#  [deg]    [deg]    ['] [deg]  [deg]                   [']
254.6029  35.2711    8.9  30.1  167.8   0.9609   1.3    8.3	Her X-1
299.5840  35.1941    0.3  22.6   79.7  28.6117  39.4    0.5	Cyg X-1
308.1558  40.9349    1.9  20.5   56.2   3.7929   6.1    2.3	Cyg X-3
326.2462  38.3649    7.8  31.5   35.2   1.1962   1.5    4.4	Cyg X-2
205.4748  37.3152    3.8  55.2 -145.3  16.5905   3.0 ------	UNKNOWN
197.5844  57.3915    3.2  45.3 -121.4   8.7783   3.6 ------	UNKNOWN
Plot creation:
Sat May 30 21:56:59 EDT 2015