Special notes of this burst
Image
Pre-slew 15.0-350.0 keV image (Event data)
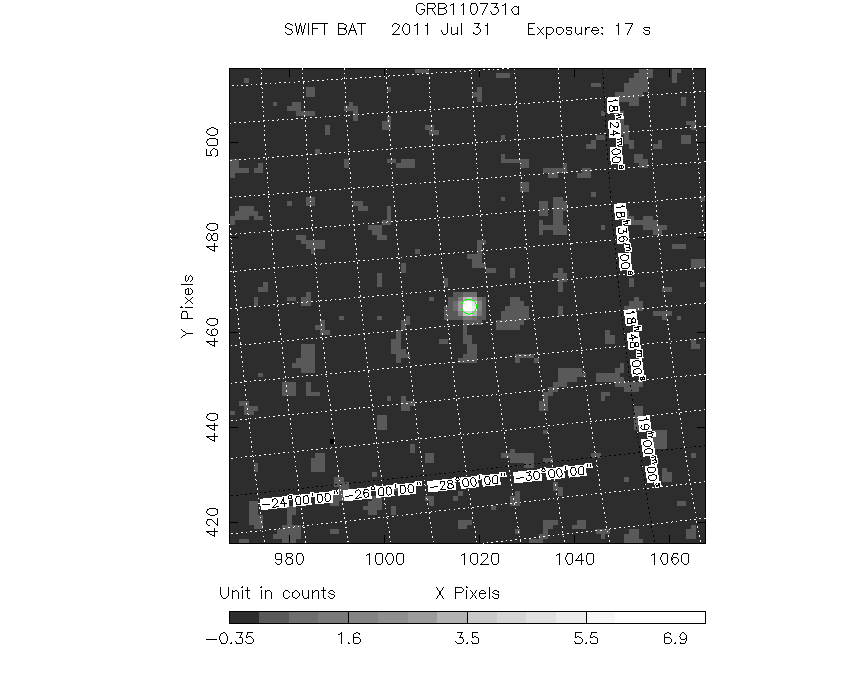
#   RAcent    DECcent   POSerr    Theta     Phi              Peak Cts       SNR   Name
  280.5124   -28.5362   0.0023    16.2420   175.3411         7.8844535     81.740 TRIG_00458448

Foreground time interval of the image:
 -1.056  15.837 (delta_t =  16.893 [sec])
Background time interval of the image:
-239.664  -1.056 (delta_t = 238.608 [sec])
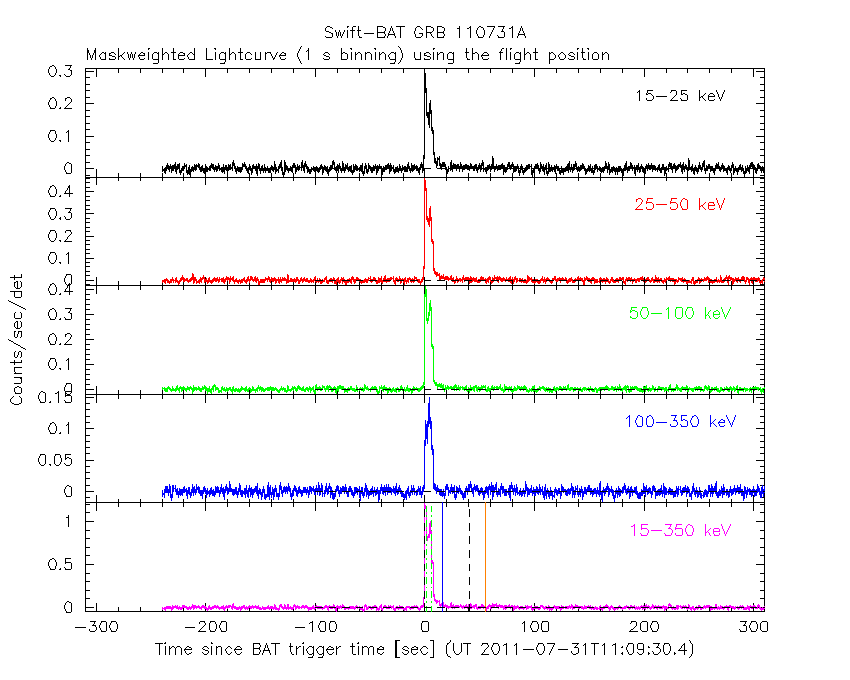
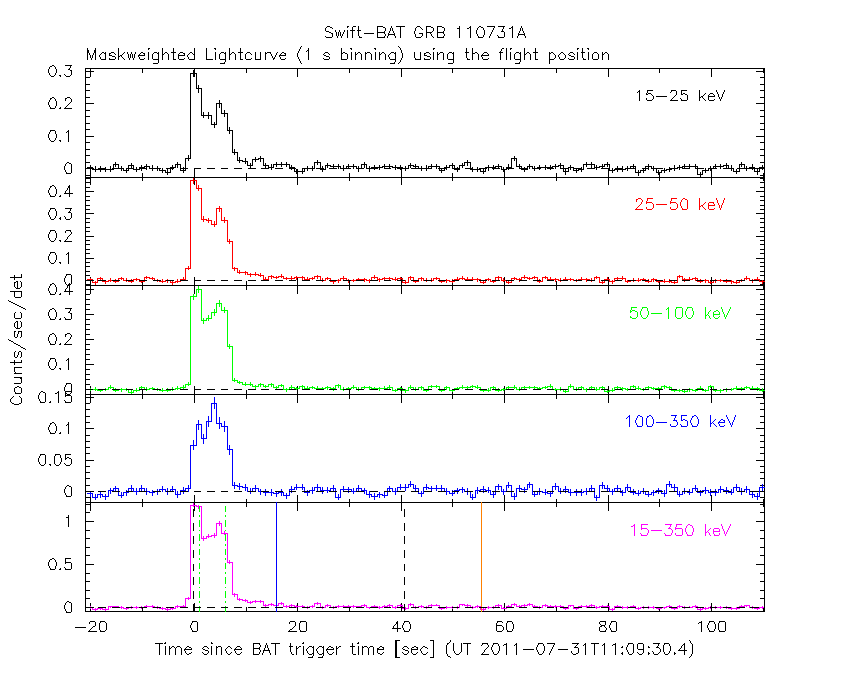
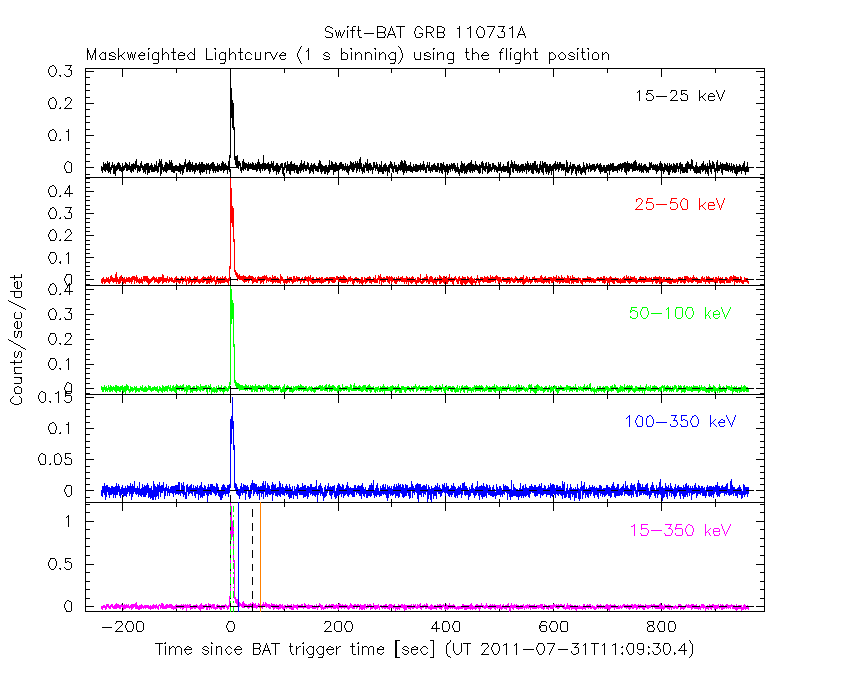
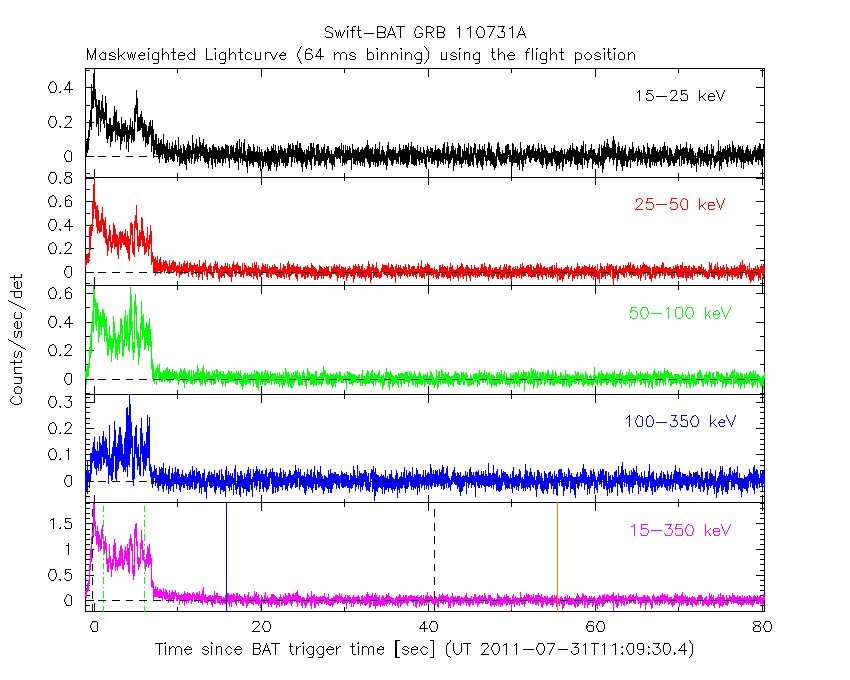
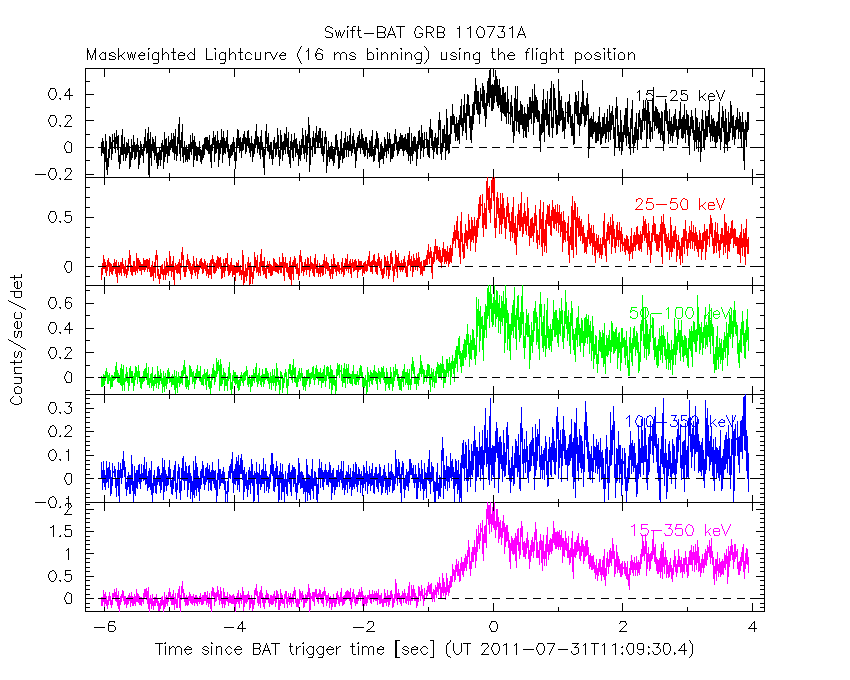
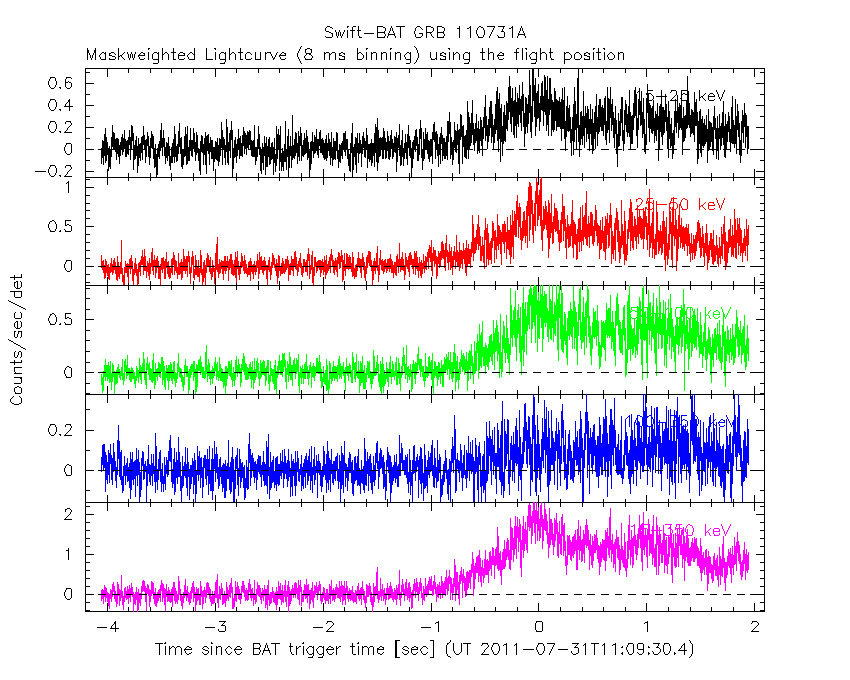
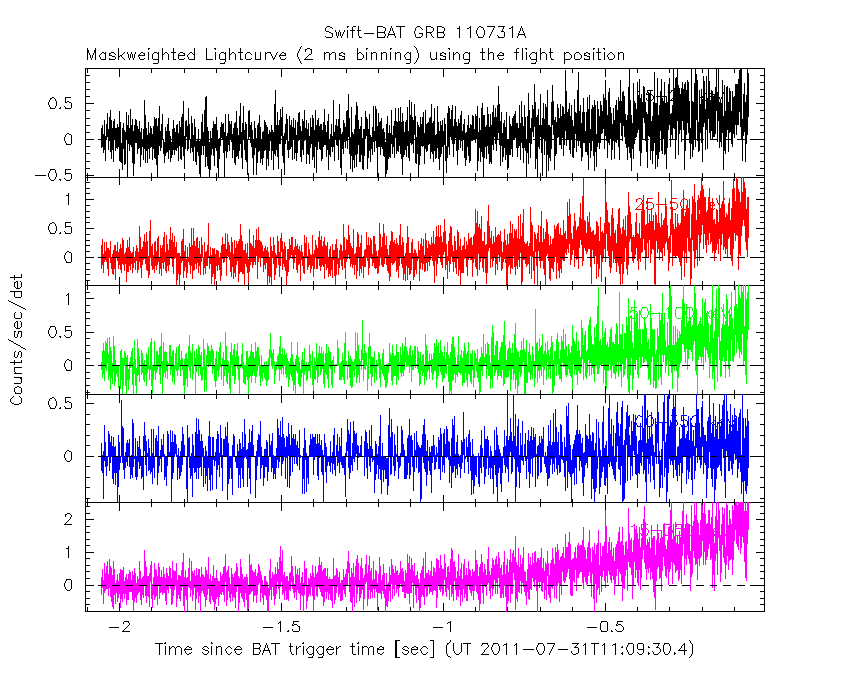
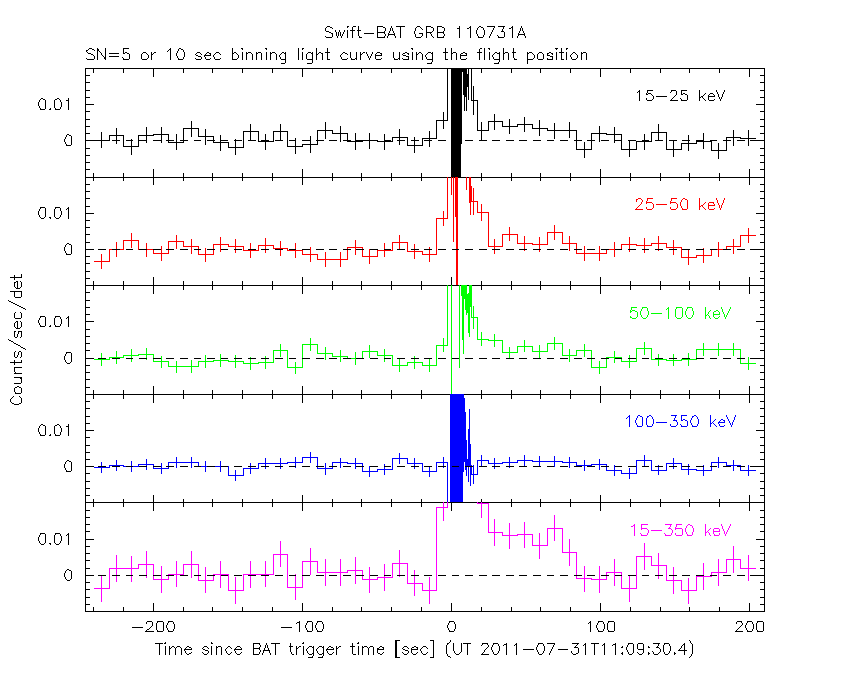
Lightcurves
Notes:
- 1) The mask-weighted light curves are using the flight position.
- 2) Multiple plots of different time binning/intervals are shown to cover all scenarios of short/long GRBs, rate/image triggers, and real/false positives.
- 3) For all the mask-weighted lightcurves, the y-axis units are counts/sec/det where a det is 0.4 x 0.4 = 0.16 sq cm.
- 4) The verticle lines correspond to following: green dotted lines are T50 interval, black dotted lines are T90 interval, blue solid line(s) is a spacecraft slew start time, and orange solid line(s) is a spacecraft slew end time.
- 5) Time of each bin is in the middle of the bin.
1 s binning
From T0-310 s to T0+310 s
From T100_start - 20 s to T100_end + 30 s
Full time interval
64 ms binning
Full time interval

From T100_start to T100_end
From T0-5 sec to T0+5 sec

16 ms binning
From T100_start-5 s to T100_start+5 s
8 ms binning
From T100_start-3 s to T100_start+3 s
2 ms binning
From T100_start-1 s to T100_start+1 s
SN=5 or 10 sec. binning (whichever binning is satisfied first)

SN=5 or 10 sec. binning (T < 200 sec)
Quad-rate summed light curves (from T0-300s to T0+1000s)

The mask-weighted light curves based on cleaned DPHs

Spectral Evolution

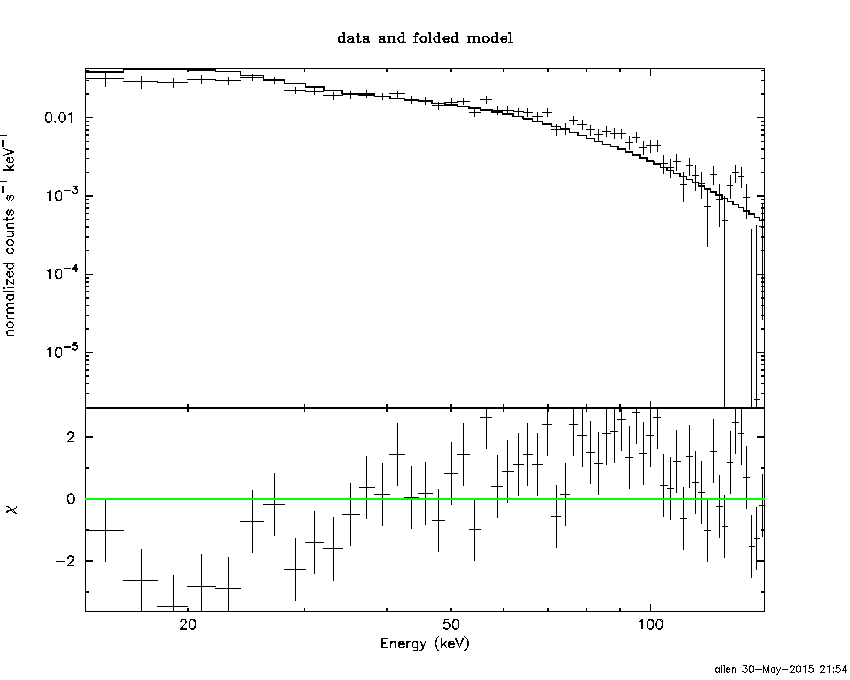
Spectra
Notes:
- 1) The fitting includes the systematic errors.
- 2) When the burst includes telescope slew time periods, the fitting uses an average response file made from multiple 5-s response files through out the slew time plus single time preiod for the non-slew times, and weighted by the total counts in the corresponding time period using addrmf. An average response file is needed becuase a spectral fit using the pre-slew DRM will introduce some errors in both a spectral shape and a normalization if the PHA file contains a lot of the slew/post-slew time interval.
- 3) For fits to more complicated models (e.g. a power-law over a cutoff power-law), the BAT team has decided to require a chi-square improvement of more than 6 for each extra dof.
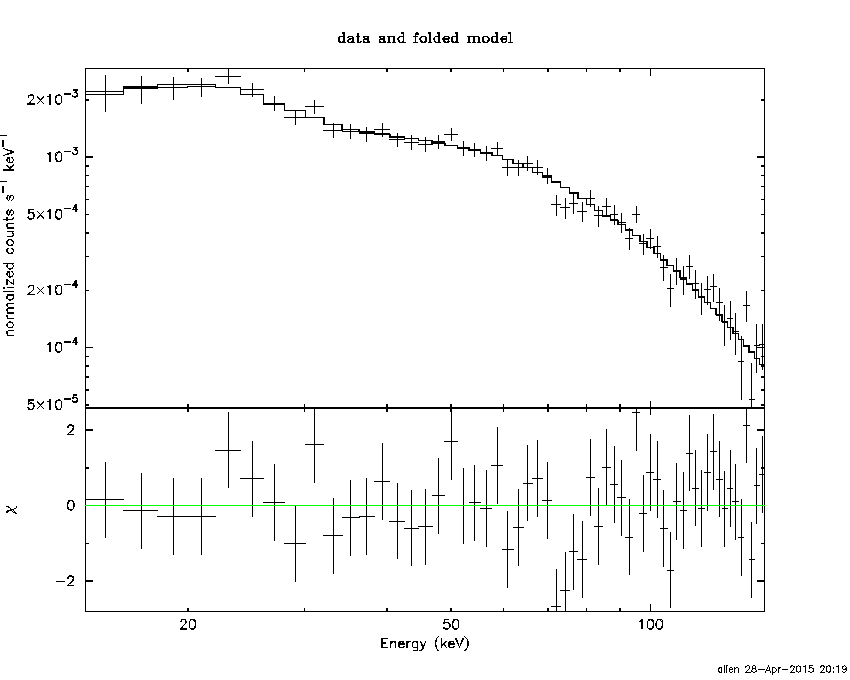
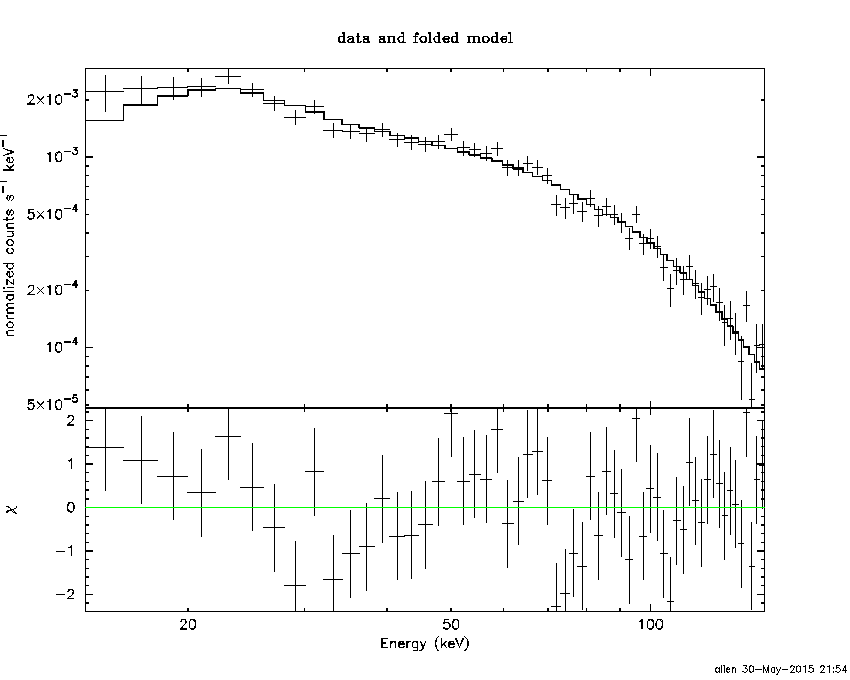
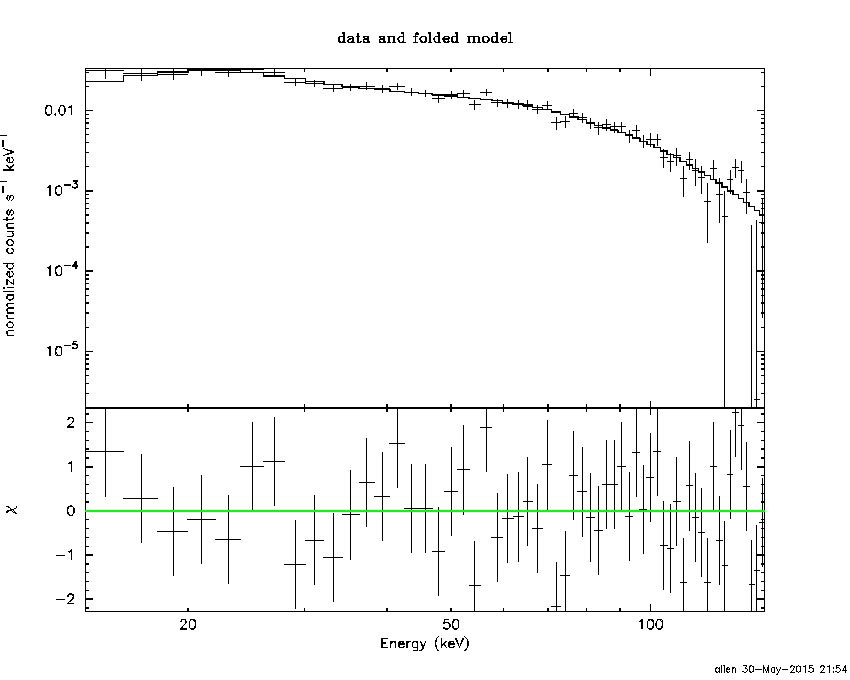
Time averaged spectrum fit using the average DRM
Power-law model

Time interval is from   -1.056 sec. to   80.272 sec.

Spectral model in power-law:
------------------------------------------------------------
Parameters  : value       lower 90%   higher 90%
Photon index: 1.14905     ( -0.0457998   0.0455342 )
Norm@50keV  : 7.09590E-03    ( -0.000169968   0.000169442 )
------------------------------------------------------------
#Fit statistic : Chi-Squared =          58.30 using 59 PHA bins.
# Reduced chi-squared =          1.023 for     57 degrees of freedom
# Null hypothesis probability =   4.272711e-01

Photon flux (15-150 keV)    in 81.33 sec: 0.827434 ( -0.0213777  0.0215045 ) ph/cm2/s
Energy fluence (15-150 keV)             : 5.9427e-06 ( -1.42943e-07  1.43186e-07 ) ergs/cm2
Cutoff power-law model
Time interval is from   -1.056 sec. to   80.272 sec.
Spectral model in the cutoff power-law:
------------------------------------------------------------
Parameters  : value       lower 90%   higher 90%
Photon index: 1.14397     ( -0.0493256   0.043279 )
Epeak [keV] : 1.00000E+04      (   )
Norm@50keV  : 7.13142E-03    ( -0.000170106   0.00016388 )
------------------------------------------------------------
#Fit statistic : Chi-Squared =          58.46 using 59 PHA bins.
# Reduced chi-squared =          1.044 for     56 degrees of freedom
# Null hypothesis probability =   3.853242e-01

Photon flux (15-150 keV)    in 81.33 sec: 0.828018 ( -0.022282  0.020549 ) ph/cm2/s
Energy fluence (15-150 keV)             : 5.94039e-06 ( -1.39888e-07  1.47874e-07 ) ergs/cm2
Band function

Time interval is from   -1.056 sec. to   80.272 sec.

Spectral model in the Band function:
------------------------------------------------------------
Parameters  : value       lower 90%   higher 90%
alpha       : -0.903468   ( 0.903468   0.903468 )
beta        : -1.14905    ( -0.0455357   0.0458064 )
Epeak [keV] : 54.7740      ( -54.774 -54.774 )
Norm@50keV   : 1.28092E-02    ( -0.00436861   390006 )
------------------------------------------------------------
#Fit statistic : Chi-Squared =          58.30 using 59 PHA bins.
# Reduced chi-squared =          1.060 for     55 degrees of freedom
# Null hypothesis probability =   3.549542e-01

Photon flux (15-150 keV)    in 81.33 sec:  (    ) ph/cm2/s
Energy fluence (15-150 keV)             : 0 ( 0  0 ) ergs/cm2
Single BB
Spectral model blackbody:
------------------------------------------------------------
Parameters  : value    Lower 90%  Upper 90%
kT [keV]    : 22.0923  (  )
R^2/D10^2   : 2.70022E-02  (   )
(R is the radius in km and D10 is the distance to the source in units of 10 kpc)
------------------------------------------------------------
#Fit statistic : Chi-Squared =         440.23 using 59 PHA bins.
# Reduced chi-squared =         7.7233 for     57 degrees of freedom
# Null hypothesis probability =   1.341303e-60

Energy  Fluence     90% Error
[keV]   [erg/cm2]   [erg/cm2]
15- 25  1.980e-07   9.353e-09
25- 50  1.049e-06   3.945e-08
50-150  3.827e-06   1.269e-07
15-150  5.075e-06   1.322e-07
Thermal bremsstrahlung (OTTB)
Spectral model: thermal bremsstrahlung
------------------------------------------------------------
Parameters  : value         Lower 90%    Upper 90%
kT [keV]    : 199.363       (      )
Norm        : 3.58598       (     )
------------------------------------------------------------
#Fit statistic : Chi-Squared =         324.92 using 59 PHA bins.
# Reduced chi-squared =         5.7003 for     57 degrees of freedom
# Null hypothesis probability =   3.644662e-39

Energy  Fluence     90% Error
[keV]   [erg/cm2]   [erg/cm2]
15- 25  7.262e-07   2.009e-08
25- 50  1.397e-06   3.538e-08
50-150  3.064e-06   8.052e-08
15-150  5.187e-06   1.383e-07
Double BB
Spectral model: bbodyrad<1> + bbodyrad<2>
------------------------------------------------------------
Parameters  : value         Lower 90%    Upper 90%
kT1 [keV]   : 8.90452        (-0.878038      0.948635)
R1^2/D10^2  : 0.325290        (-0.0875375      0.130511)
kT2 [keV]   : 40.2811        (-4.44709      6.35684)
R2^2/D10^2  : 3.54869E-03    (-0.0012217   0.00152427)
------------------------------------------------------------
#Fit statistic : Chi-Squared =          68.38 using 59 PHA bins.
# Reduced chi-squared =          1.243 for     55 degrees of freedom
# Null hypothesis probability =   1.062061e-01

Energy  Fluence     90% Error
[keV]   [erg/cm2]   [erg/cm2]
15- 25  4.662e-07   3.973e-08
25- 50  1.260e-06   6.588e-08
50-150  4.275e-06   2.859e-07
15-150  6.001e-06   3.111e-07
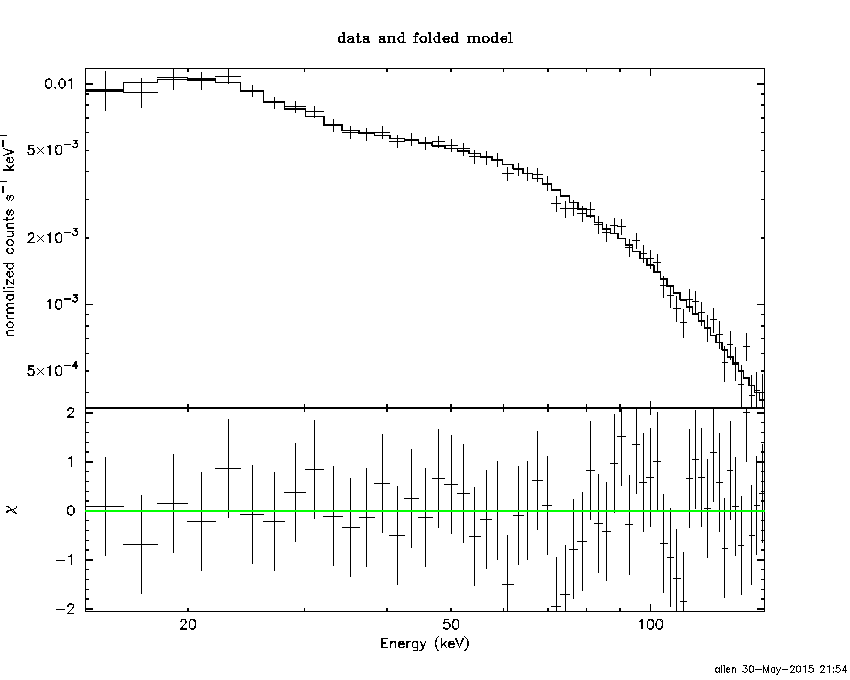
Peak spectrum fit
Power-law model
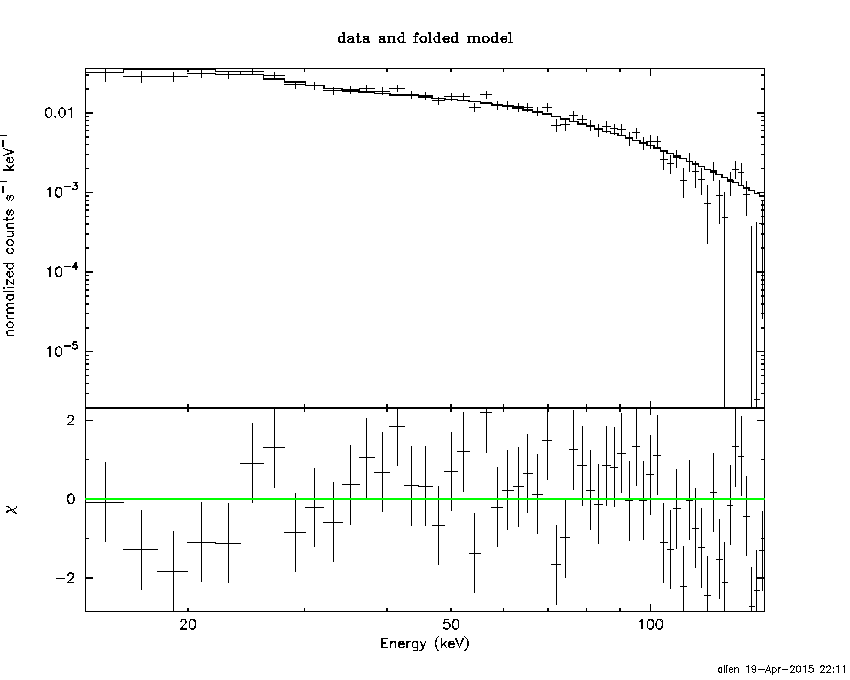
Time interval is from   -0.268 sec. to    0.732 sec.

Spectral model in power-law:
------------------------------------------------------------
Parameters  : value       lower 90%   higher 90%
Photon index: 1.28770     ( -0.0518138   0.0518352 )
Norm@50keV  : 9.21206E-02    ( -0.00270495   0.00270493 )
------------------------------------------------------------
#Fit statistic : Chi-Squared =          80.74 using 59 PHA bins.
# Reduced chi-squared =          1.416 for     57 degrees of freedom
# Null hypothesis probability =   2.099325e-02

Photon flux (15-150 keV)    in 1 sec: 10.9657 ( -0.338855  0.339284 ) ph/cm2/s
Energy fluence (15-150 keV)             : 9.13081e-07 ( -2.90903e-08  2.91396e-08 ) ergs/cm2
Cutoff power-law model

Time interval is from   -0.268 sec. to    0.732 sec.
Spectral model in the cutoff power-law:
------------------------------------------------------------
Parameters  : value       lower 90%   higher 90%
Photon index: 0.774481     ( -0.224204   0.214027 )
Epeak [keV] : 135.193      ( -24.7078 54.7844 )
Norm@50keV  : 0.156661    ( -0.0303461   0.0395677 )
------------------------------------------------------------
#Fit statistic : Chi-Squared =          62.93 using 59 PHA bins.
# Reduced chi-squared =          1.124 for     56 degrees of freedom
# Null hypothesis probability =   2.445150e-01

Photon flux (15-150 keV)    in 1 sec: 10.6678 ( -0.3569  0.3577 ) ph/cm2/s
Energy fluence (15-150 keV)             : 8.91332e-07 ( -3.1008e-08  3.0919e-08 ) ergs/cm2
Band function
Time interval is from   -0.268 sec. to    0.732 sec.

Spectral model in the Band function:
------------------------------------------------------------
Parameters  : value       lower 90%   higher 90%
alpha       : -0.774532   ( -0.246729   0.183619 )
beta        : -10.0000    ( 10   3.37508e-14 )
Epeak [keV] : 135.184      ( -24.716 54.7636 )
Norm@50keV   : 0.156644    ( -0.0303257   0.0396052 )
------------------------------------------------------------
#Fit statistic : Chi-Squared =          62.93 using 59 PHA bins.
# Reduced chi-squared =          1.144 for     55 degrees of freedom
# Null hypothesis probability =   2.161529e-01

Photon flux (15-150 keV)    in 1 sec: 10.7004 (    ) ph/cm2/s
Energy fluence (15-150 keV)             : 0 ( 0  0 ) ergs/cm2
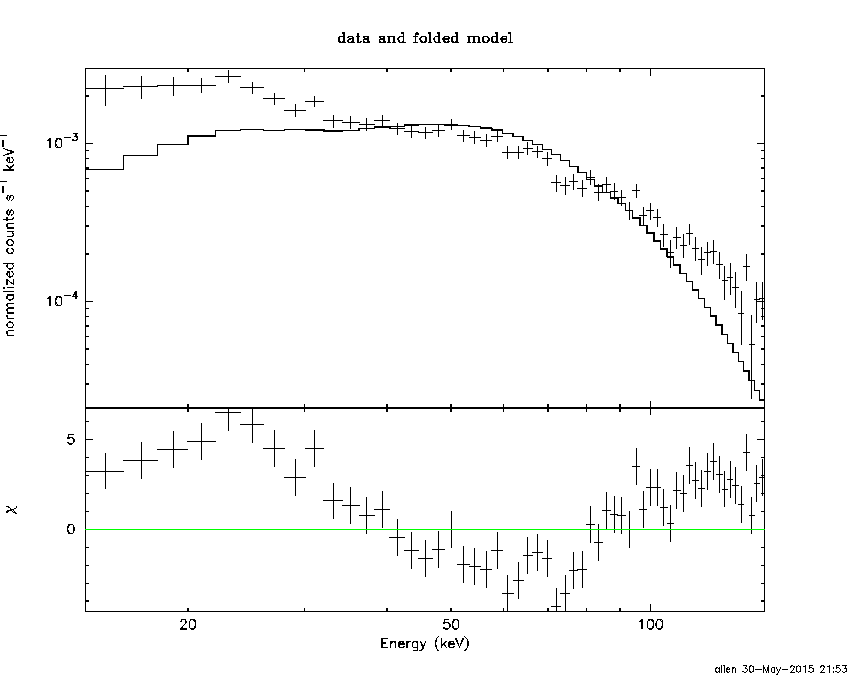
Single BB

Spectral model blackbody:
------------------------------------------------------------
Parameters  : value    Lower 90%  Upper 90%
kT [keV]    : 18.8466  (  )
R^2/D10^2   : 0.603760  (   )
(R is the radius in km and D10 is the distance to the source in units of 10 kpc)
------------------------------------------------------------
#Fit statistic : Chi-Squared =         236.00 using 59 PHA bins.
# Reduced chi-squared =         4.1404 for     57 degrees of freedom
# Null hypothesis probability =   1.215490e-23

Energy  Fluence     90% Error
[keV]   [erg/cm2]   [erg/cm2]
15- 25  4.228e-08   2.495e-09
25- 50  2.022e-07   8.400e-09
50-150  5.269e-07   2.500e-08
15-150  7.713e-07   2.775e-08
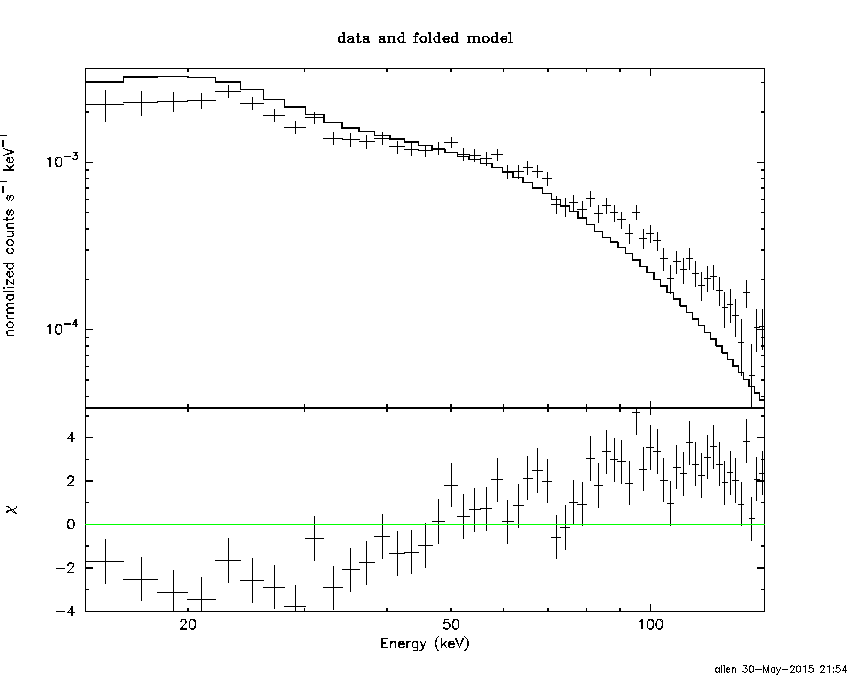
Thermal bremsstrahlung (OTTB)
Spectral model: thermal bremsstrahlung
------------------------------------------------------------
Parameters  : value         Lower 90%    Upper 90%
kT [keV]    : 199.363       (      )
Norm        : 45.9411       (     )
------------------------------------------------------------
#Fit statistic : Chi-Squared =         148.87 using 59 PHA bins.
# Reduced chi-squared =         2.6117 for     57 degrees of freedom
# Null hypothesis probability =   3.837555e-10

Energy  Fluence     90% Error
[keV]   [erg/cm2]   [erg/cm2]
15- 25  1.144e-07   3.650e-09
25- 50  2.201e-07   6.600e-09
50-150  4.826e-07   1.520e-08
15-150  8.171e-07   2.610e-08
Double BB
Spectral model: bbodyrad<1> + bbodyrad<2>
------------------------------------------------------------
Parameters  : value         Lower 90%    Upper 90%
kT1 [keV]   : 7.62548        (-0.948667      1.0528)
R1^2/D10^2  : 6.39643        (-2.12719      3.57897)
kT2 [keV]   : 27.6648        (-2.28385      2.98498)
R2^2/D10^2  : 0.139263    (-0.0433425   0.0518165)
------------------------------------------------------------
#Fit statistic : Chi-Squared =          59.16 using 59 PHA bins.
# Reduced chi-squared =          1.076 for     55 degrees of freedom
# Null hypothesis probability =   3.263817e-01

Energy  Fluence     90% Error
[keV]   [erg/cm2]   [erg/cm2]
15- 25  8.225e-08   1.040e-08
25- 50  2.084e-07   1.695e-08
50-150  6.024e-07   4.585e-08
15-150  8.930e-07   5.410e-08
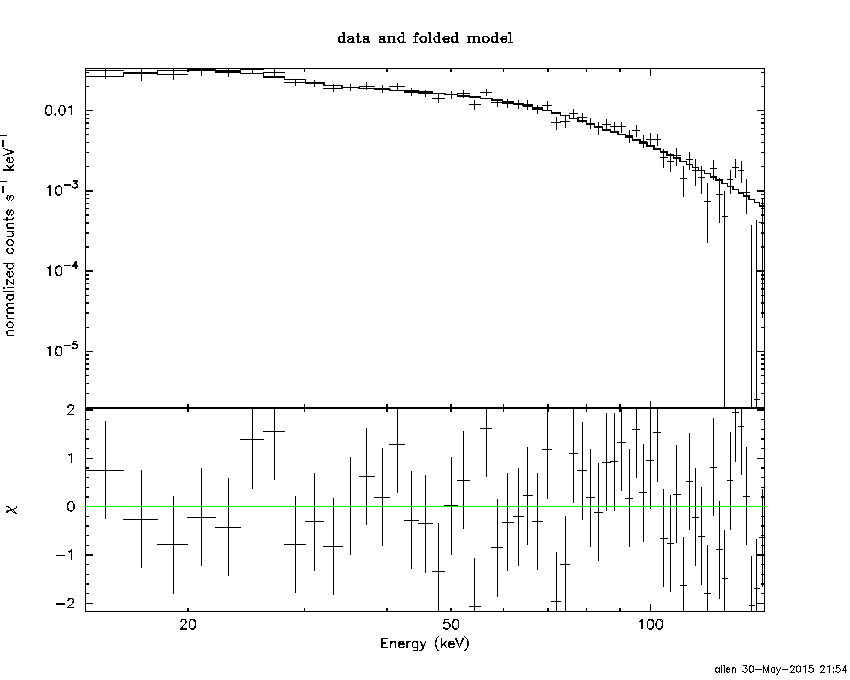
Pre-slew spectrum (Pre-slew PHA with pre-slew DRM)
Power-law model
Spectral model in power-law:
------------------------------------------------------------
Parameters  : value       lower 90%   higher 90%
Photon index: 1.12803     ( -0.034338   0.03421 )
Norm@50keV  : 3.14206E-02    ( -0.000575844   0.000574218 )
------------------------------------------------------------
#Fit statistic : Chi-Squared =          39.00 using 59 PHA bins.
# Reduced chi-squared =         0.6842 for     57 degrees of freedom
# Null hypothesis probability =   9.672020e-01

Photon flux (15-150 keV)    in 16.89 sec: 3.65512 ( -0.0722197  0.07249 ) ph/cm2/s
Energy fluence (15-150 keV)             : 5.49989e-06 ( -9.91703e-08  9.92593e-08 ) ergs/cm2
Cutoff power-law model

Spectral model in the cutoff power-law:
------------------------------------------------------------
Parameters  : value       lower 90%   higher 90%
Photon index: 1.12196     ( -0.0340639   0.0351199 )
Epeak [keV] : 9999.12      ( -9999.2 -9999.2 )
Norm@50keV  : 3.15472E-02    ( -0.000566216   0.00213553 )
------------------------------------------------------------
#Fit statistic : Chi-Squared =          39.16 using 59 PHA bins.
# Reduced chi-squared =         0.6993 for     56 degrees of freedom
# Null hypothesis probability =   9.574145e-01

Photon flux (15-150 keV)    in 16.89 sec: 3.65315 ( -0.07218  0.07235 ) ph/cm2/s
Energy fluence (15-150 keV)             : 5.49972e-06 ( -9.82322e-08  9.94483e-08 ) ergs/cm2
Band function

Spectral model in the Band function:
------------------------------------------------------------
Parameters  : value       lower 90%   higher 90%
alpha       : -0.879610   ( 0.87961   0.87961 )
beta        : -1.12803    ( -0.0342159   0.0343372 )
Epeak [keV] : 58.2703      ( -58.2703 -58.2703 )
Norm@50keV   : 5.63769E-02    ( -0.017803   1.60756e+06 )
------------------------------------------------------------
#Fit statistic : Chi-Squared =          39.00 using 59 PHA bins.
# Reduced chi-squared =         0.7091 for     55 degrees of freedom
# Null hypothesis probability =   9.494767e-01

Photon flux (15-150 keV)    in 16.89 sec:  (    ) ph/cm2/s
Energy fluence (15-150 keV)             : 0 ( 0  0 ) ergs/cm2
S(25-50 keV) vs. S(50-100 keV) plot

S(25-50 keV)  = 1.21e-06
S(50-100 keV) = 2.18e-06
T90 vs. Hardness ratio plot
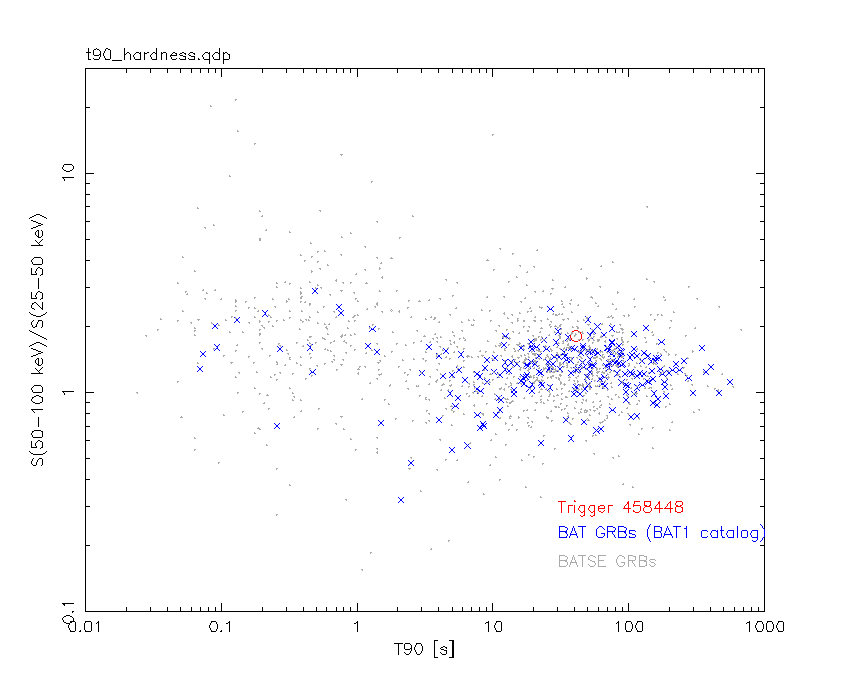
T90                                   = 40.944000005722 sec.
Hardness ratio (energy fluence ratio) = 1.80165
Color vs. Color plot

Count Ratio  (25-50 keV) / (15-25 keV) = 1.48721
Count Ratio (50-100 keV) / (15-25 keV) = 1.44925
Mask shadow pattern
IMX = -2.903595258416043E-01, IMY = -2.366202735736934E-02
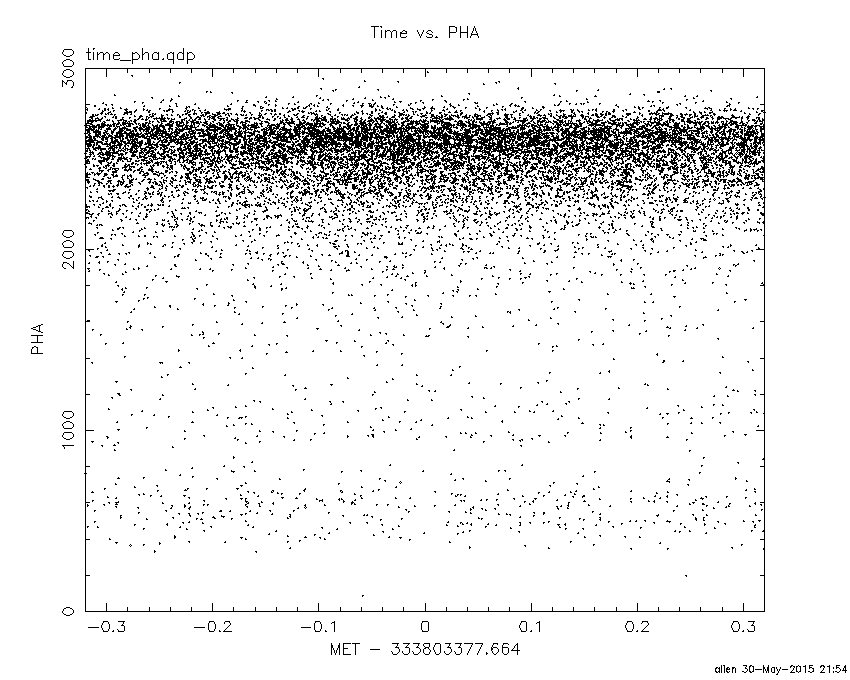
TIME vs. PHA plot around the trigger time
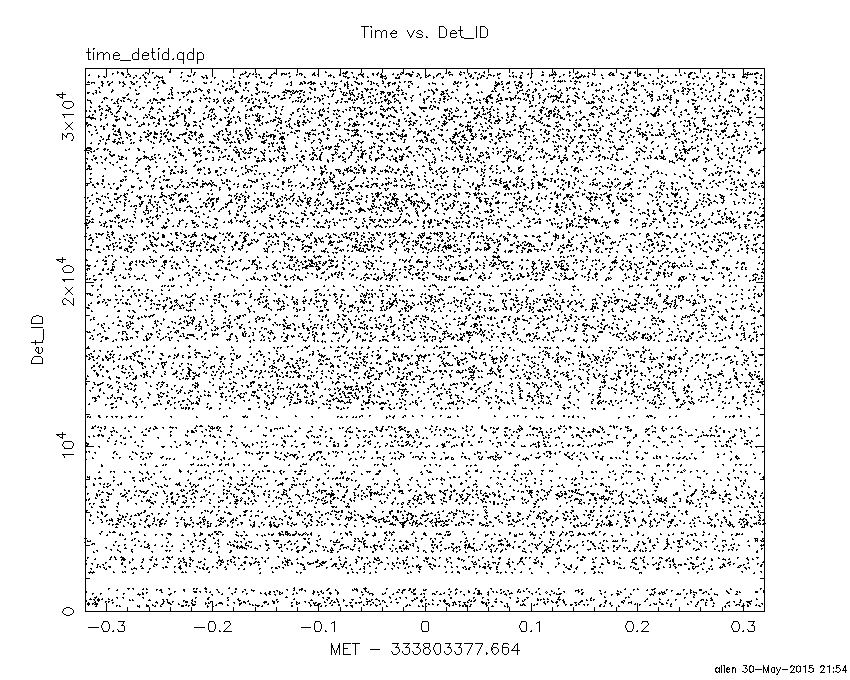
TIME vs. DetID plot around the trigger time
100 us light curve (15-350 keV)

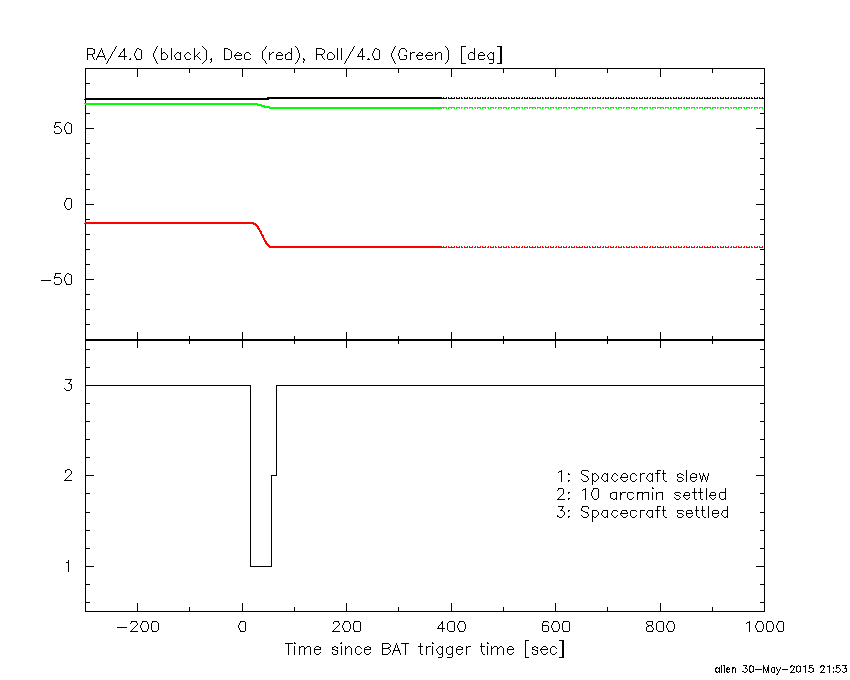
Spacecraft aspect plot
Bright source in the pre-burst/pre-slew/post-slew images
Pre-burst image of 15-350 keV band
Time interval of the image:
-239.664000 -1.056000

# RAcent  DECcent POSerr Theta    Phi  PeakCts   SNR AngSep     Name
#  [deg]    [deg]    ['] [deg]  [deg]                   [']
244.9766 -15.6310    0.6  31.8  -95.1   7.2077  19.5    0.6	Sco X-1
254.4345  35.3287    4.0  52.6  -19.4   1.7830   2.9    1.4	Her X-1
255.9684 -37.8595  807.3  31.9 -142.1  -0.0037  -0.0    1.3	4U 1700-377
256.4998 -36.4576    5.3  30.5 -140.8   0.5477   2.2    3.7	GX 349+2
262.9906 -24.5996   16.2  18.4 -128.8   0.1570   0.7    8.8	GX 1+4
264.7283 -44.4443   13.0  33.8 -158.9   0.2363   0.9    0.7	4U 1735-44
268.2914  -1.4281    3.3  14.4  -36.1   0.7359   3.5    4.8	SW J1753.5-0127
270.3016 -25.0350    2.0  14.3 -147.7   1.2109   5.8    2.8	GX 5-1
270.3886 -25.7601    5.7  14.9 -149.4   0.4180   2.0    4.8	GRS 1758-258
274.0136 -14.0284    3.4   3.8 -109.2   0.7364   3.4    0.7	GX 17+2
275.8237 -30.3268    6.1  17.9 -170.5   0.4013   1.9    5.8	H1820-303
284.9898 -24.7755   28.8  14.1  155.9   0.0813   0.4    9.1	HT1900.1-2455
288.7724  10.7983    3.8  25.8   30.3   0.7820   3.1    9.0	GRS 1915+105
263.0461 -33.8541    5.3  25.1 -146.1   0.5014   2.2    3.1	GX 354-0
277.3681 -23.8388    1.9  11.3 -174.4   1.2874   6.0 ------	UNKNOWN
269.2778  31.4927    2.2  44.7   -5.7   1.9469   5.1 ------	UNKNOWN
273.2590 -69.7151    4.4  57.3 -173.8   2.8269   2.6 ------	UNKNOWN
234.3285 -27.3639    4.3  43.1 -112.4   2.5470   2.7 ------	UNKNOWN
236.3702  -2.6884    2.3  42.0  -75.5   4.3438   5.0 ------	UNKNOWN
Pre-slew background subtracted image of 15-350 keV band
Time interval of the image:
-1.056000 15.836590

# RAcent  DECcent POSerr Theta    Phi  PeakCts   SNR AngSep     Name
#  [deg]    [deg]    ['] [deg]  [deg]                   [']
244.9767 -15.5896    5.9  31.8  -95.0  -0.3169  -2.0    3.0	Sco X-1
254.4988  35.5038    7.2  52.8  -19.2   0.4377   1.6    9.9	Her X-1
255.8744 -37.9731   23.1  32.0 -142.1   0.0556   0.5    9.4	4U 1700-377
256.2652 -36.2933   18.4  30.6 -140.3  -0.0715  -0.6   11.3	GX 349+2
262.9481 -24.6324    5.4  18.4 -128.8   0.2081   2.1    7.6	GX 1+4
264.5936 -44.3800   10.3  33.8 -158.7   0.1345   1.1    7.7	4U 1735-44
268.2484  -1.3126   27.2  14.6  -36.0  -0.0388  -0.4   11.1	SW J1753.5-0127
270.3687 -24.9288    9.1  14.2 -147.7  -0.1112  -1.3   10.1	GX 5-1
270.1411 -25.7648    5.6  15.0 -148.6  -0.1775  -2.1    8.8	GRS 1758-258
274.0815 -13.9368    4.2   3.7 -108.3   0.2587   2.8    7.4	GX 17+2
275.7683 -30.4771    7.2  18.0 -170.4  -0.1502  -1.6   10.5	H1820-303
285.2020 -24.9527    5.2  14.3  155.6   0.2221   2.2    9.2	HT1900.1-2455
288.8517  11.0937    4.6  26.1   30.2   0.2919   2.5    9.4	GRS 1915+105
262.8161 -33.6784    0.0  25.1 -145.5   0.0694   0.7   12.7	GX 354-0
295.5105   7.2767    3.1  26.6   47.3   0.4929   3.6 ------	UNKNOWN
287.0849 -48.9998    2.3  37.3  174.2   0.6641   5.1 ------	UNKNOWN
280.5124 -28.5362    0.1  16.2  175.3   7.8846  81.7 ------	UNKNOWN
265.3173 -64.2480    2.1  52.4 -168.9   1.3731   5.6 ------	UNKNOWN
Post-slew image of 15-350 keV band
Time interval of the image:
55.436620 962.436700

# RAcent  DECcent POSerr Theta    Phi  PeakCts   SNR AngSep     Name
#  [deg]    [deg]    ['] [deg]  [deg]                   [']
244.9851 -15.6313    0.4  35.2  -61.9  26.4782  26.2    0.6	Sco X-1
256.0884 -37.7645    2.5  22.3 -106.5   2.7643   4.5    6.8	4U 1700-377
256.4308 -36.4939    2.8  21.7 -103.4   2.4566   4.1    4.3	GX 349+2
262.8681 -24.7451    3.1  16.2  -66.4   2.0775   3.7    7.7	GX 1+4
264.7092 -44.5409    4.1  20.4 -131.8   1.6968   2.9    5.6	4U 1735-44
268.3438  -1.4592    3.8  29.5  -11.1   2.1462   3.1    1.5	SW J1753.5-0127
270.3064 -25.0809    1.3   9.7  -57.4   4.8606   8.7    1.2	GX 5-1
270.2884 -25.8236    4.8   9.5  -61.6   1.3873   2.4    4.9	GRS 1758-258
274.0111 -14.0353    2.6  15.7   -9.7   2.5648   4.4    0.3	GX 17+2
276.0790 -30.2715    5.5   4.2 -101.1   1.2757   2.1    9.8	H1820-303
284.9682 -25.0712    2.7   5.3   64.3   2.4086   4.2    9.8	HT1900.1-2455
288.7477  10.9936    3.6  40.3   26.8   3.4192   3.2    4.1	GRS 1915+105
263.0070 -33.8188    1.9  15.9  -99.6   3.5733   5.9    1.3	GX 354-0
291.2171 -31.9529    2.9   9.9  127.2   2.3364   4.0 ------	UNKNOWN
268.9848  17.6303    3.3  47.5   -0.7   4.0456   3.5 ------	UNKNOWN
255.2337 -41.6679    1.8  24.4 -115.1   4.3051   6.3 ------	UNKNOWN
243.8854   8.0993    2.6  50.9  -35.3   8.4092   4.5 ------	UNKNOWN
215.3373 -71.4919    3.8  55.2 -145.2  12.5677   3.1 ------	UNKNOWN
Plot creation:
Sat May 30 21:55:07 EDT 2015