Click here for the BAT GCN circular template
Image
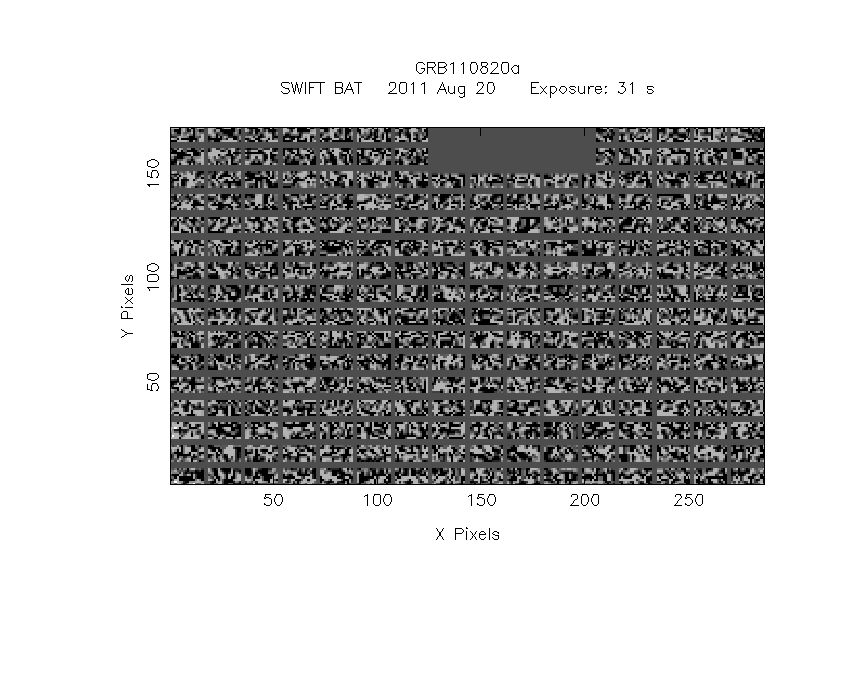
Pre-slew 15.0-350.0 keV image (Event data)

#   RAcent    DECcent   POSerr    Theta     Phi              Peak Cts       SNR   Name
  343.2186    70.3083   0.0151    11.4904  -117.9107         0.6521102     12.712 TRIG_00501095

Foreground time interval of the image:
 -3.072  27.629 (delta_t =  30.701 [sec])
Background time interval of the image:
-239.072  -3.072 (delta_t = 236.000 [sec])
Lightcurves
Notes:
- 1) The mask-weighted light curves are using the flight position.
- 2) Multiple plots of different time binning/intervals are shown to cover all scenarios of short/long GRBs, rate/image triggers, and real/false positives.
- 3) For all the mask-weighted lightcurves, the y-axis units are counts/sec/det where a det is 0.4 x 0.4 = 0.16 sq cm.
- 4) The verticle lines correspond to following: green dotted lines are T50 interval, black dotted lines are T90 interval, blue solid line(s) is a spacecraft slew start time, and orange solid line(s) is a spacecraft slew end time.
- 5) Time of each bin is in the middle of the bin.
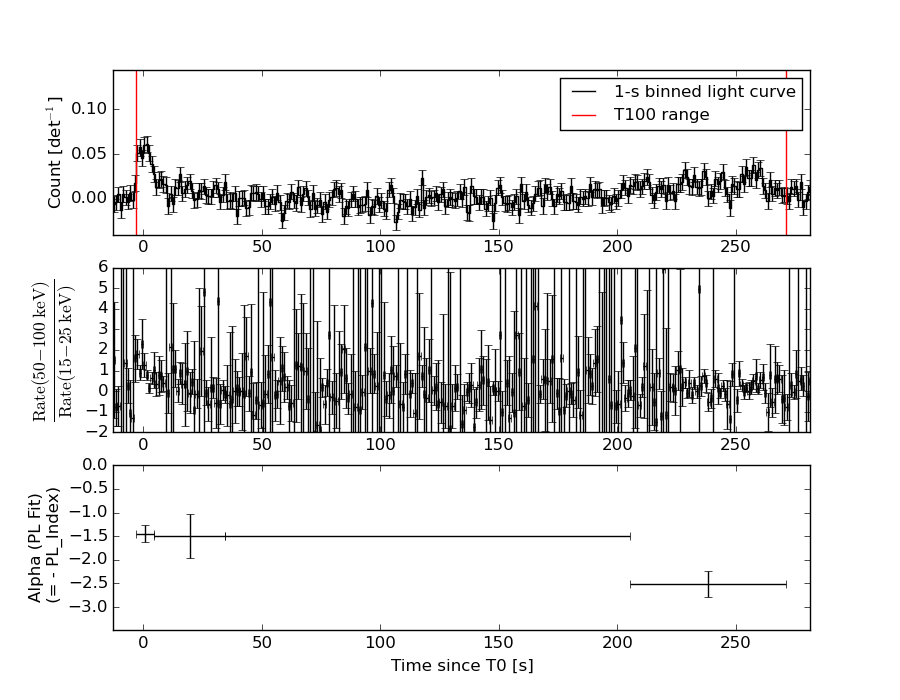
1 s binning
From T0-310 s to T0+310 s

From T100_start - 20 s to T100_end + 30 s

Full time interval

64 ms binning
Full time interval

From T100_start to T100_end

From T0-5 sec to T0+5 sec

16 ms binning
From T100_start-5 s to T100_start+5 s

Blue+Cyan dotted lines: Time interval of the scaled map
From 0.000000 to 2.048000
8 ms binning
From T100_start-3 s to T100_start+3 s

Blue+Cyan dotted lines: Time interval of the scaled map
From 0.000000 to 2.048000
2 ms binning
From T100_start-1 s to T100_start+1 s

Blue+Cyan dotted lines: Time interval of the scaled map
From 0.000000 to 2.048000
SN=5 or 10 sec. binning (whichever binning is satisfied first)

SN=5 or 10 sec. binning (T < 200 sec)

Quad-rate summed light curves (from T0-300s to T0+1000s)

The mask-weighted light curves based on cleaned DPHs

Spectral Evolution
Spectra
Notes:
- 1) The fitting includes the systematic errors.
- 2) When the burst includes telescope slew time periods, the fitting uses an average response file made from multiple 5-s response files through out the slew time plus single time preiod for the non-slew times, and weighted by the total counts in the corresponding time period using addrmf. An average response file is needed becuase a spectral fit using the pre-slew DRM will introduce some errors in both a spectral shape and a normalization if the PHA file contains a lot of the slew/post-slew time interval.
- 3) For fits to more complicated models (e.g. a power-law over a cutoff power-law), the BAT team has decided to require a chi-square improvement of more than 6 for each extra dof.
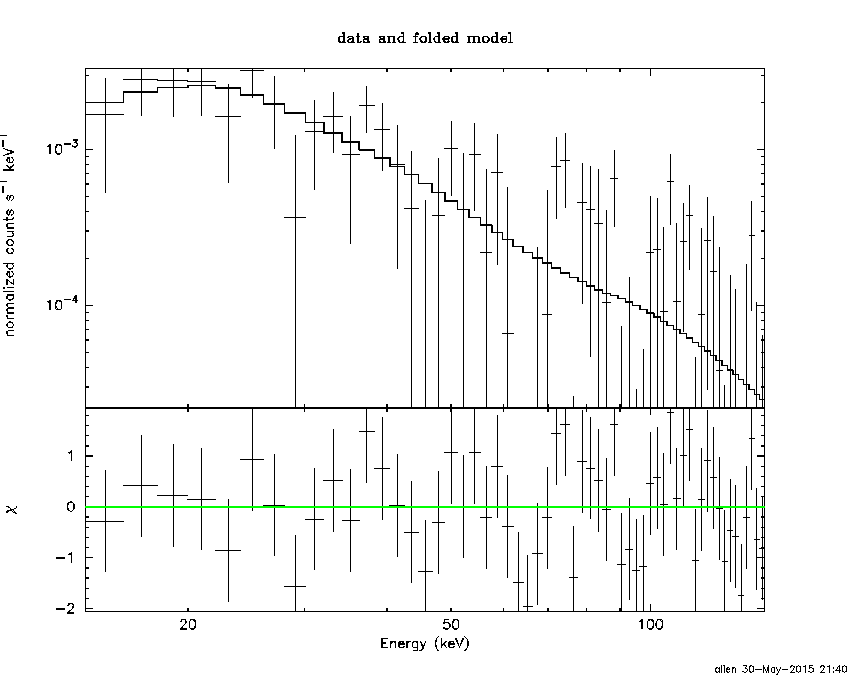
Time averaged spectrum fit using the average DRM
Power-law model

Time interval is from   -3.072 sec. to  271.324 sec.

Spectral model in power-law:
------------------------------------------------------------
Parameters  : value       lower 90%   higher 90%
Photon index: 1.98848     ( -0.269798   0.295823 )
Norm@50keV  : 3.23031E-04    ( -6.18385e-05   5.92076e-05 )
------------------------------------------------------------
#Fit statistic : Chi-Squared =          61.69 using 59 PHA bins.
# Reduced chi-squared =          1.082 for     57 degrees of freedom
# Null hypothesis probability =   3.120807e-01

Photon flux (15-150 keV)    in 274.4 sec: 4.81997E-02 ( -0.00654636  0.00654639 ) ph/cm2/s
Energy fluence (15-150 keV)             : 8.16927e-07 ( -1.42761e-07  1.47935e-07 ) ergs/cm2
Cutoff power-law model

Time interval is from   -3.072 sec. to  271.324 sec.
Spectral model in the cutoff power-law:
------------------------------------------------------------
Parameters  : value       lower 90%   higher 90%
Photon index: 2.03088     (     )
Epeak [keV] : 30.4379      (   )
Norm@50keV  : 3.05061E-04    (     )
------------------------------------------------------------
#Fit statistic : Chi-Squared =          61.68 using 59 PHA bins.
# Reduced chi-squared =          1.101 for     56 degrees of freedom
# Null hypothesis probability =   2.803098e-01

Photon flux (15-150 keV)    in 274.4 sec: 4.81898E-02 ( -0.0065529  0.0065349 ) ph/cm2/s
Energy fluence (15-150 keV)             : 8.17097e-07 ( -1.52819e-07  1.45684e-07 ) ergs/cm2
Band function

Time interval is from   -3.072 sec. to  271.324 sec.

Spectral model in the Band function:
------------------------------------------------------------
Parameters  : value       lower 90%   higher 90%
alpha       : -5.35151   ( 5.0587   5.35151 )
beta        : -1.98855    ( -0.295754   0.269961 )
Epeak [keV] : 9999.35      ( -9999.35 -9999.35 )
Norm@50keV   : 4.39031E-02    ( -0.00840334   0.00804854 )
------------------------------------------------------------
#Fit statistic : Chi-Squared =          61.69 using 59 PHA bins.
# Reduced chi-squared =          1.122 for     55 degrees of freedom
# Null hypothesis probability =   2.492588e-01

Photon flux (15-150 keV)    in 274.4 sec:  (    ) ph/cm2/s
Energy fluence (15-150 keV)             : 0 ( 0  0 ) ergs/cm2
Single BB

Spectral model blackbody:
------------------------------------------------------------
Parameters  : value    Lower 90%  Upper 90%
kT [keV]    : 9.88398  (-1.92345  2.43791)
R^2/D10^2   : 2.24154E-02  (-0.0222205   0.0284275)
(R is the radius in km and D10 is the distance to the source in units of 10 kpc)
------------------------------------------------------------
#Fit statistic : Chi-Squared =          82.34 using 59 PHA bins.
# Reduced chi-squared =          1.445 for     57 degrees of freedom
# Null hypothesis probability =   1.567953e-02

Energy  Fluence     90% Error
[keV]   [erg/cm2]   [erg/cm2]
15- 25  1.219e-07   3.344e-08
25- 50  2.981e-07   7.874e-08
50-150  1.504e-07   6.081e-08
15-150  5.703e-07   1.142e-07
Thermal bremsstrahlung (OTTB)

Spectral model: thermal bremsstrahlung
------------------------------------------------------------
Parameters  : value         Lower 90%    Upper 90%
kT [keV]    : 73.0437       (-27.8168      60.5603)
Norm        : 0.231462       (-0.045399     0.0616657)
------------------------------------------------------------
#Fit statistic : Chi-Squared =          63.48 using 59 PHA bins.
# Reduced chi-squared =          1.114 for     57 degrees of freedom
# Null hypothesis probability =   2.588056e-01

Energy  Fluence     90% Error
[keV]   [erg/cm2]   [erg/cm2]
15- 25  1.636e-07   3.082e-08
25- 50  2.633e-07   4.404e-08
50-150  3.489e-07   1.900e-07
15-150  7.758e-07   2.441e-07
Double BB

Spectral model: bbodyrad<1> + bbodyrad<2>
------------------------------------------------------------
Parameters  : value         Lower 90%    Upper 90%
kT1 [keV]   : 3.99307        (-1.26024      1.68339)
R1^2/D10^2  : 0.626591        (-0.489295      1.61656)
kT2 [keV]   : 18.4103        (-4.82422      7.86472)
R2^2/D10^2  : 1.84333E-03    (-0.00134294   0.00395711)
------------------------------------------------------------
#Fit statistic : Chi-Squared =          60.06 using 59 PHA bins.
# Reduced chi-squared =          1.092 for     55 degrees of freedom
# Null hypothesis probability =   2.975901e-01

Energy  Fluence     90% Error
[keV]   [erg/cm2]   [erg/cm2]
15- 25  1.891e-07   1.012e-07
25- 50  2.159e-07   9.734e-08
50-150  3.971e-07   2.420e-07
15-150  8.021e-07   3.551e-07
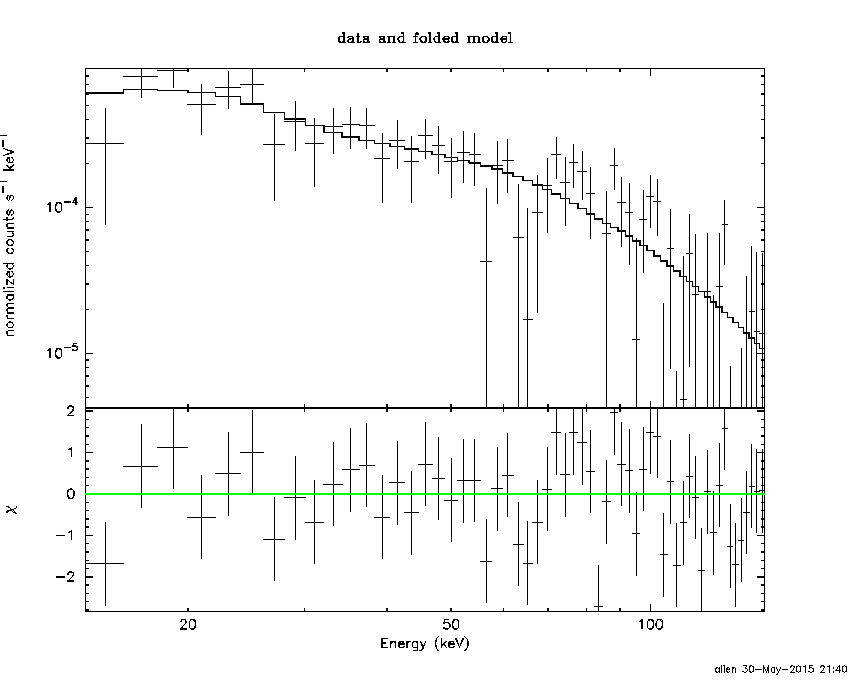
Peak spectrum fit
Power-law model

Time interval is from    1.556 sec. to    2.556 sec.

Spectral model in power-law:
------------------------------------------------------------
Parameters  : value       lower 90%   higher 90%
Photon index: 1.98421     ( -0.381746   0.430172 )
Norm@50keV  : 3.47483E-03    ( -0.00102215   0.000984708 )
------------------------------------------------------------
#Fit statistic : Chi-Squared =          55.41 using 59 PHA bins.
# Reduced chi-squared =         0.9721 for     57 degrees of freedom
# Null hypothesis probability =   5.348704e-01

Photon flux (15-150 keV)    in 1 sec: 0.517476 ( -0.109839  0.109881 ) ph/cm2/s
Energy fluence (15-150 keV)             : 3.20193e-08 ( -8.56748e-09  9.09864e-09 ) ergs/cm2
Cutoff power-law model

Time interval is from    1.556 sec. to    2.556 sec.
Spectral model in the cutoff power-law:
------------------------------------------------------------
Parameters  : value       lower 90%   higher 90%
Photon index: 0.910027     ( -4.95246   1.23126 )
Epeak [keV] : 36.3532      (   )
Norm@50keV  : 1.67900E-02    (     )
------------------------------------------------------------
#Fit statistic : Chi-Squared =          54.77 using 59 PHA bins.
# Reduced chi-squared =         0.9780 for     56 degrees of freedom
# Null hypothesis probability =   5.216351e-01

Photon flux (15-150 keV)    in 1 sec: 0.498361 ( -0.117373  0.117641 ) ph/cm2/s
Energy fluence (15-150 keV)             : 2.73097e-08 ( -9.2355e-09  1.26124e-08 ) ergs/cm2
Band function

Time interval is from    1.556 sec. to    2.556 sec.

Spectral model in the Band function:
------------------------------------------------------------
Parameters  : value       lower 90%   higher 90%
alpha       : -0.934189   ( -2.54686   2.17707 )
beta        : -10.00000    ( 10   4.79616e-14 )
Epeak [keV] : 36.4756      ( -13.8355 -36.4756 )
Norm@50keV   : 1.61707E-02    ( -0.00340455   37.5643 )
------------------------------------------------------------
#Fit statistic : Chi-Squared =          54.77 using 59 PHA bins.
# Reduced chi-squared =         0.9958 for     55 degrees of freedom
# Null hypothesis probability =   4.834651e-01

Photon flux (15-150 keV)    in 1 sec:  (    ) ph/cm2/s
Energy fluence (15-150 keV)             : 0 ( 0  0 ) ergs/cm2
Single BB

Spectral model blackbody:
------------------------------------------------------------
Parameters  : value    Lower 90%  Upper 90%
kT [keV]    : 8.48930  (-1.6462  2.12794)
R^2/D10^2   : 0.467631  (-0.273077   0.611582)
(R is the radius in km and D10 is the distance to the source in units of 10 kpc)
------------------------------------------------------------
#Fit statistic : Chi-Squared =          55.58 using 59 PHA bins.
# Reduced chi-squared =         0.9752 for     57 degrees of freedom
# Null hypothesis probability =   5.283125e-01

Energy  Fluence     90% Error
[keV]   [erg/cm2]   [erg/cm2]
15- 25  6.346e-09   2.945e-09
25- 50  1.228e-08   4.716e-09
50-150  3.906e-09   2.551e-09
15-150  2.253e-08   8.444e-09
Thermal bremsstrahlung (OTTB)

Spectral model: thermal bremsstrahlung
------------------------------------------------------------
Parameters  : value         Lower 90%    Upper 90%
kT [keV]    : 58.6109       (-27.5041      84.6066)
Norm        : 2.75983       (-0.831972     1.29192)
------------------------------------------------------------
#Fit statistic : Chi-Squared =          54.81 using 59 PHA bins.
# Reduced chi-squared =         0.9615 for     57 degrees of freedom
# Null hypothesis probability =   5.578650e-01

Energy  Fluence     90% Error
[keV]   [erg/cm2]   [erg/cm2]
15- 25  6.909e-09   2.266e-09
25- 50  1.044e-08   3.976e-09
50-150  1.165e-08   7.940e-09
15-150  2.900e-08   1.418e-08
Double BB
Spectral model: bbodyrad<1> + bbodyrad<2>
------------------------------------------------------------
Parameters  : value         Lower 90%    Upper 90%
kT1 [keV]   : 7.58704        (-5.16315      2.15556)
R1^2/D10^2  : 0.661919        (-0.401839      14.5822)
kT2 [keV]   : 53.5877        (-54.1086      -54.1087)
R2^2/D10^2  : 4.16429E-04    (-0.000402161   0.280692)
------------------------------------------------------------
#Fit statistic : Chi-Squared =          52.69 using 59 PHA bins.
# Reduced chi-squared =         0.9579 for     55 degrees of freedom
# Null hypothesis probability =   5.635126e-01

Energy  Fluence     90% Error
[keV]   [erg/cm2]   [erg/cm2]
15- 25  6.728e-09   3.870e-09
25- 50  1.143e-08   6.760e-09
50-150  1.415e-08   7.190e-09
15-150  3.230e-08   1.513e-08
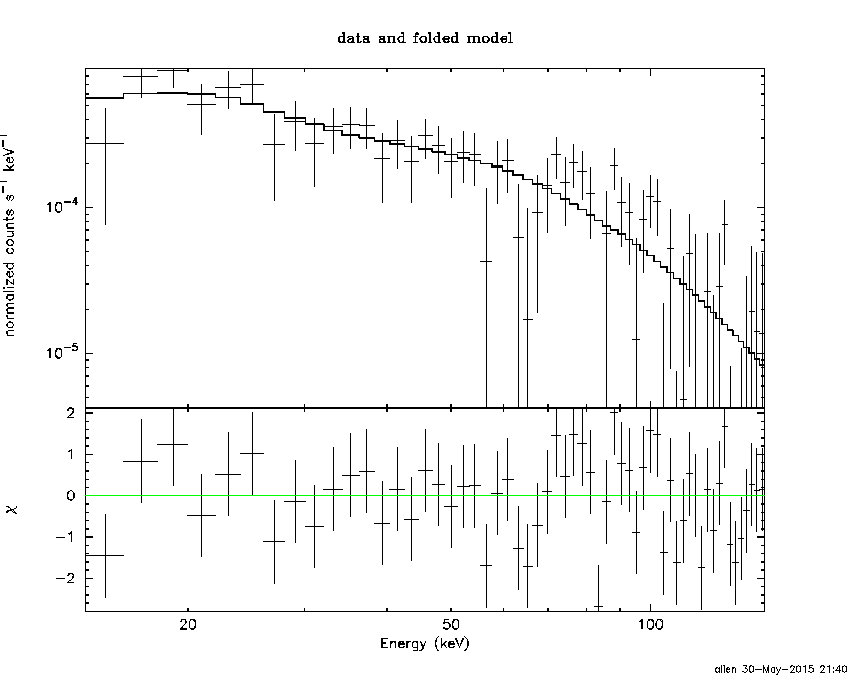
Pre-slew spectrum (Pre-slew PHA with pre-slew DRM)
Power-law model
Spectral model in power-law:
------------------------------------------------------------
Parameters  : value       lower 90%   higher 90%
Photon index: 1.44860     ( -0.202147   0.20401 )
Norm@50keV  : 1.36084E-03    ( -0.000163018   0.000161644 )
------------------------------------------------------------
#Fit statistic : Chi-Squared =          60.40 using 59 PHA bins.
# Reduced chi-squared =          1.060 for     57 degrees of freedom
# Null hypothesis probability =   3.539037e-01

Photon flux (15-150 keV)    in 30.7 sec: 0.167647 ( -0.0193861  0.0194004 ) ph/cm2/s
Energy fluence (15-150 keV)             : 3.99886e-07 ( -5.32986e-08  5.41428e-08 ) ergs/cm2
Cutoff power-law model

Spectral model in the cutoff power-law:
------------------------------------------------------------
Parameters  : value       lower 90%   higher 90%
Photon index: 1.14176     ( -0.80719   0.47907 )
Epeak [keV] : 137.300      ( -137.302 -137.302 )
Norm@50keV  : 1.95845E-03    ( -0.000739505   0.002983 )
------------------------------------------------------------
#Fit statistic : Chi-Squared =          59.85 using 59 PHA bins.
# Reduced chi-squared =          1.069 for     56 degrees of freedom
# Null hypothesis probability =   3.379022e-01

Photon flux (15-150 keV)    in 30.7 sec: 0.165420 ( -0.020049  0.020017 ) ph/cm2/s
Energy fluence (15-150 keV)             : 3.89522e-07 ( -5.8591e-08  5.83945e-08 ) ergs/cm2
Band function
Spectral model in the Band function:
------------------------------------------------------------
Parameters  : value       lower 90%   higher 90%
alpha       : -1.15949   ( -0.33207   0.824185 )
beta        : -9.37144    ( 9.37166   19.3717 )
Epeak [keV] : 144.528      ( -80.6357 -144.407 )
Norm@50keV   : 1.91308E-03    ( -0.000692025   0.00135261 )
------------------------------------------------------------
#Fit statistic : Chi-Squared =          59.85 using 59 PHA bins.
# Reduced chi-squared =          1.088 for     55 degrees of freedom
# Null hypothesis probability =   3.040813e-01

Photon flux (15-150 keV)    in 30.7 sec: 0.165341 (    ) ph/cm2/s
Energy fluence (15-150 keV)             : 0 ( 0  0 ) ergs/cm2
S(25-50 keV) vs. S(50-100 keV) plot

S(25-50 keV)  = 2.45e-07
S(50-100 keV) = 2.47e-07
T90 vs. Hardness ratio plot

T90                                   = 264.615999937057 sec.
Hardness ratio (energy fluence ratio) = 1.00816
Color vs. Color plot

Count Ratio  (25-50 keV) / (15-25 keV) = 0.884798
Count Ratio (50-100 keV) / (15-25 keV) = 0.584402
Mask shadow pattern
IMX = -9.515336926551408E-02, IMY = 1.796321127300071E-01
TIME vs. PHA plot around the trigger time
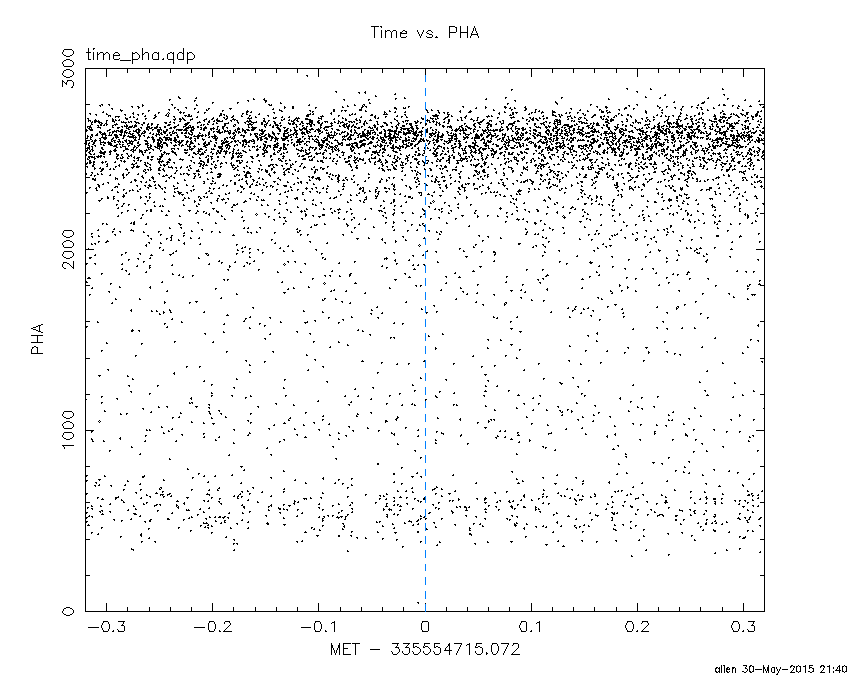
Blue+Cyan dotted lines: Time interval of the scaled map
From 0.000000 to 2.048000
TIME vs. DetID plot around the trigger time

Blue+Cyan dotted lines: Time interval of the scaled map
From 0.000000 to 2.048000
100 us light curve (15-350 keV)

Blue+Cyan dotted lines: Time interval of the scaled map
From 0.000000 to 2.048000
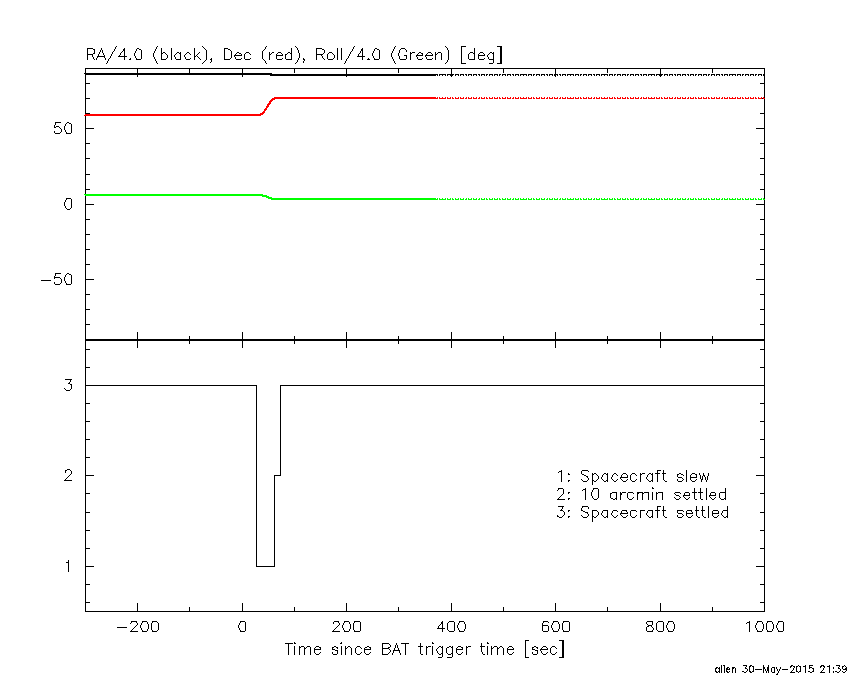
Spacecraft aspect plot
Bright source in the pre-burst/pre-slew/post-slew images
Pre-burst image of 15-350 keV band
Time interval of the image:
-239.072000 -3.072000

# RAcent  DECcent POSerr Theta    Phi  PeakCts   SNR AngSep     Name
#  [deg]    [deg]    ['] [deg]  [deg]                   [']
299.5613  35.2005    1.5  38.0  137.7   2.5818   7.5    1.4	Cyg X-1
308.0910  40.9663    1.5  29.3  134.6   1.8140   7.8    1.2	Cyg X-3
326.2885  38.2109    3.5  24.0  104.7   0.6756   3.3    8.6	Cyg X-2
341.3589  18.3029    2.9  40.7   71.4   2.7315   4.0 ------	UNKNOWN
340.7896  24.0016    2.7  35.0   72.8   1.5306   4.3 ------	UNKNOWN
 51.5190  70.2365    2.3  28.8  -74.5   1.0960   5.0 ------	UNKNOWN
Pre-slew background subtracted image of 15-350 keV band
Time interval of the image:
-3.072000 27.628600

# RAcent  DECcent POSerr Theta    Phi  PeakCts   SNR AngSep     Name
#  [deg]    [deg]    ['] [deg]  [deg]                   [']
299.4579  35.1956    5.5  38.0  137.8  -0.2294  -2.1    6.5	Cyg X-1
308.2700  41.0955    0.0  29.1  134.6  -0.0958  -1.4   11.2	Cyg X-3
326.3728  38.4430    0.0  23.8  104.8  -0.0845  -1.2   11.9	Cyg X-2
 33.1799  27.1680    2.8  45.6   -1.8   0.3697   4.1 ------	UNKNOWN
343.2186  70.3083    0.9  11.5 -117.9   0.6522  12.7 ------	UNKNOWN
Post-slew image of 15-350 keV band
Time interval of the image:
62.628600 962.978000

# RAcent  DECcent POSerr Theta    Phi  PeakCts   SNR AngSep     Name
#  [deg]    [deg]    ['] [deg]  [deg]                   [']
254.4171  35.2852    8.1  56.7  179.1   3.2675   1.4    4.0	Her X-1
299.5606  35.2177    1.9  42.1  134.1   8.4421   6.1    1.7	Cyg X-1
308.1114  40.9123    1.4  34.5  127.1   6.4473   8.4    2.4	Cyg X-3
325.9982  38.4722    0.0  33.1  101.9  -0.4830  -0.5   12.2	Cyg X-2
353.9713  61.6452    2.4   9.6   45.2   1.6972   4.7 ------	UNKNOWN
250.0812  38.0629    3.3  55.6 -175.7   5.7308   3.5 ------	UNKNOWN
242.0171  37.4319    3.1  58.7 -169.1   9.5430   3.8 ------	UNKNOWN
201.8255  58.8483    2.2  48.0 -129.0  10.3092   5.2 ------	UNKNOWN
Plot creation:
Sat May 30 21:41:08 EDT 2015